MENTAL IMAGERY IN SYNAESTHESIA
MARY JANE SPILLER
A thesis submitted in partial fulfilment of the requirements of the University of East London
for the degree of Doctorate of Philosophy
CONTENTS
Page
Contents 2
List of Table and Figures 6
Acknowledgements 16
Abstract 17
Chapter 1 Literature Review
1.1 Overview of Thesis 18
1.2 Research concerning the concurrent (the synaesthetic colour) 21 1.3 Research concerning the inducer (the presentation of the
grapheme)
41
1.4 Models of synaesthesia 59
1.5 Focus of thesis (mental imagery and synaesthesia) 65
Chapter 2 Generating a synaesthetic concurrent from a mental image of a grapheme: the role of object imagery processes
(Experiment 1)
2.1 Experiment 1 Introduction 77
2.2 Experiment 1 Method 88
2.3 Experiment 1 Results 97
2.4 Experiment 1 Discussion 105
Page Chapter 3 Generating a synaesthetic concurrent from a mental image
of a grapheme: the role of spatial imagery processes (Experiment 2)
3.1 Experiment 2 Introduction 119
3.2 Experiment 2 Method 129
3.3 Experiment 2 Results 133
3.4 Experiment 2 Discussion 146
Chapter 4 A further exploration of the role of spatial imagery processes in the generation of a synaesthetic concurrent from a mental image of a grapheme (Experiment 3)
4.1 Experiment 3 Introduction 157
4.2 Experiment 3 Method 162
4.3 Experiment 3 Results 164
4.4 Experiment 3 Discussion 170
Chapter 5 Exploring the determinants of a synaesthetic concurrent from different mental imagery processes (Experiment 4)
5.1 Experiment 4 Introduction 177
5.2 Experiment 4 Method 187
5.3 Experiment 4 Results 198
5.4 Experiment 4 General discussion 238
Page Chapter 6 Further exploring the determinants of a synaesthetic
concurrent from different imagery processes (Experiments 5a and 5b)
6.1 Experiment 5a and 5b Introduction 245
6.2 Experiment 5a Outline 245
6.3 Experiment 5a Method 247
6.4 Experiment 5a Results 248
6.5 Experiment 5a Discussion 259
6.6 Experiment 5b Outline 262
6.7 Experiment 5b Method 264
6.8 Experiment 5b Results 266
6.9 Experiment 5b Discussion 271
6.10 General Discussion 275
Chapter 7 Synaesthesia and mental imagery: a discussion
7.1 Overview of the research questions and how these have been answered
278
7.2 How has the research advanced the field 288
7.3 Future directions 297
7.4 Summary 303
REFERENCES 305
Page APPENDICES
Appendix A Experiment 1 Participant Instructions 320 Appendix B Experiment 2 Participant Instructions 321 Appendix C Experiment 3 Participant Instructions 322 Appendix D Experiment 4 and 5a Participant Instructions 323 Appendix E Experiment 5b Participant Instructions 332 Appendix F Copy of published material: Spiller, M.J. & Jansari, A.S. (2008)
Mental imagery and synaesthesia: is synaesthesia from
internally-generated stimuli possible? Cognition, 109, 143-151
LIST OF TABLES AND FIGURES
TABLES
Page2.1 Participant demographics for synaesthetes and each synaesthete’s corresponding group of matched controls in Experiment 1, including each synaesthete’s modified Test of Genuineness (Baron-Cohen, Wyke, & Binnie, 1987) test-retest reliability percentage (ToG %), location of colour experience (‘projector’ or ‘associator’), comparison of colour vividness from written/imagined graphemes, and each synaesthetes’ actual and control groups’ mean score on the Vividness of Visual Imagery Quota (VVIQ; Marks, 1973)
92
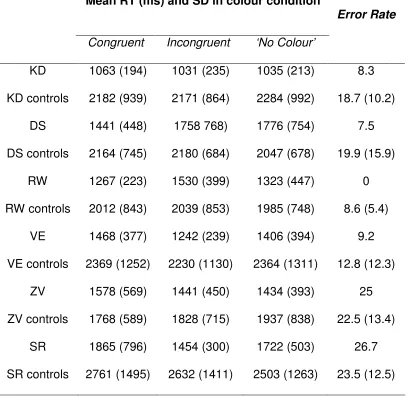
2.2 Mean response times (RTs in ms) for synaesthetes and controls in Experiment 1 as a function of colour condition (congruent, incongruent and ‘no colour’) with standard deviations (SD) in parentheses.
99
2.3 Mean response times (RTs) as a function of colour condition (congruent, incongruent and no colour), and Error Rates (ERs) for synaesthetes and each synaesthete’s corresponding group of matched controls in Experiment 1 (standard deviations in parentheses for RTs and ERs)
100
3.1 Summary of predicted effects and interactions for Task 1 and Task 2 in Experiment 2
Page 3.2 Participant demographics for synaesthetes and each
synaesthete’s corresponding group of matched controls in Experiment 2, including each synaesthete’s modified Test of Genuineness (Baron-Cohen, Wyke, & Binnie, 1987) test-retest reliability percentage (ToG %), location of colour experience (‘projector’ or ‘associator’), comparison of colour vividness from written/imagined graphemes, and each synaesthetes’ actual and control groups’ mean score on the Vividness of Visual Imagery Quota (VVIQ; Marks, 1973)
130
3.3 Mean response times (RTs in ms) in Task 1 of Experiment 2 as a function of colour condition (congruent, incongruent and ‘no colour’) with standard deviations (SD) in parentheses
134
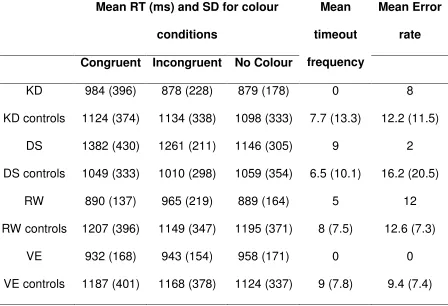
3.4 Mean response times (RTs) in Task 1 of Experiment 2 as a function of colour condition (congruent, incongruent and no colour), and timeout frequency for synaesthetes and each synaesthete’s corresponding group of matched controls (standard deviations in parentheses)
135
3.5 Mean response times (RTs in ms) in Task 2 of Experiment 2 as a function of group and of colour condition (congruent, incongruent and ‘no colour’) with standard deviations (SD) in parentheses
Page 3.6 Mean response times (RTs) in Task 2 of Experiment 2, as a
function of colour condition (congruent, incongruent and no colour), and timeout frequency for synaesthetes and each synaesthete’s corresponding group of matched controls (standard deviations in parentheses).
141
3.7 Synaesthete error rates and timeout frequencies for the 3 conditions (congruent, incongruent and no colour) for Task 2 in Experiment 2
145
4.1 Mean response times (RTs) as a function of colour condition (congruent, incongruent and no colour) in Experiment 3, with Timeout Frequency and Error Rates (standard deviations in parentheses)
165
5.1a Mean response times (RTs) and Congruency Effects (with standard deviations in parentheses) for synaesthetes as a function of colour condition (congruent, incongruent, opponent and ‘no colour’) in the Object Task in Experiment 4
200
5.1b Error rates (ERs) for synaesthetes as a function of colour condition (congruent, incongruent, opponent and ‘no colour’) in the Object Task in Experiment 4
Page 5.2a Mean response times (RTs) and Congruency Effects (with
standard deviations in parentheses) for synaesthetes as a function of colour condition (congruent, incongruent, opponent and ‘no colour’) in the Resolution Task in Experiment 4
208
5.2b Error rates (ERs) for synaesthetes as a function of colour condition (congruent, incongruent, opponent and ‘no colour’) in the Resolution Task in Experiment 4
209
5.3a Mean response times (RTs) and Congruency Effects (with standard deviations in parentheses) for synaesthetes as a function of colour condition (congruent, incongruent, opponent and ‘no colour’) in the Transformation Task in Experiment 4
216
5.3b Error rates (ERs) for synaesthetes as a function of colour condition (congruent, incongruent, opponent and ‘no colour’) in the Transformation Task in Experiment 4
217
5.4a Mean response times (RTs) and Congruency Effects (with standard deviations in parentheses) for synaesthetes as a function of colour condition (congruent, incongruent, opponent and ‘no colour’) in the Spatial Task in Experiment 4
221
5.4b Error rates (ERs) for synaesthetes as a function of colour condition (congruent, incongruent, opponent and ‘no colour’) in the Spatial Task in Experiment 4
Page 5.5a Mean response times (RTs) and Congruency Effects (with
standard deviations in parentheses) for synaesthetes as a function of colour condition (congruent, incongruent, opponent and ‘no colour’) in the Visual Task in Experiment 4
226
5.5b Error rates (ERs) for synaesthetes as a function of colour condition (congruent, incongruent, opponent and ‘no colour’) in the Visual Task in Experiment 4
227
6.1 Participant demographics for synaesthetes in Experiment 5a, including each synaesthete’s Test of Genuineness (modified) test-retest reliability percentage (ToG %), and each synaesthete’s total score on the Vividness of Visual Imagery Quota (VVIQ; Marks, 1973)
248
6.2a Mean response times (RTs) and Congruency Effects (with
standard deviations in parentheses) for ‘naïve’ synaesthetes as a function of colour condition (congruent, incongruent, opponent and ‘no colour’) in the Object Task in Experiment 5a
250
6.2b Error rates (ERs) for synaesthetes as a function of colour condition (congruent, incongruent, opponent and ‘no colour’) in the Object Task in Experiment 5a
250
6.3a Mean response times (RTs) and Congruency Effects (with
standard deviations in parentheses) for ‘naïve’ synaesthetes as a function of colour condition (congruent, incongruent, opponent and ‘no colour’) in the Resolution Task in Experiment 5a
251
Page 6.3b Error rates (ERs) for synaesthetes as a function of colour
condition (congruent, incongruent, opponent and ‘no colour’) in the Resolution Task in Experiment 5a
252
6.4a Mean response times (RTs) and Congruency Effects (with
standard deviations in parentheses) for ‘naïve’ synaesthetes as a function of colour condition (congruent, incongruent, opponent and ‘no colour’) in the Transformation Task in Experiment 5a
253
6.4b Error rates (ERs) for synaesthetes as a function of colour condition (congruent, incongruent, opponent and ‘no colour’) in the Transformation Task in Experiment 5a
254
6.5a Mean response times (RTs) and Congruency Effects (with
standard deviations in parentheses) for ‘naïve’ synaesthetes as a function of colour condition (congruent, incongruent, opponent and ‘no colour’) in the Spatial Task in Experiment 5a
255
6.5b Error rates (ERs) for synaesthetes as a function of colour condition (congruent, incongruent, opponent and ‘no colour’) in the Spatial Task in Experiment 5a
256
6.6a Mean response times (RTs) and Congruency Effects (with
standard deviations in parentheses) for ‘naïve’ synaesthetes as a function of colour condition (congruent, incongruent, opponent and ‘no colour’) in the Visual Task in Experiment 5a
257
6.6b Error rates (ERs) for synaesthetes as a function of colour condition (congruent, incongruent, opponent and ‘no colour’) in the Visual Task in Experiment 5a
Page 6.7a Mean response times (RTs) and Congruency Effects (with
standard deviations in parentheses) for synaesthetes as a function of colour condition (congruent, incongruent, opponent and ‘no colour’) in the modified Object Task in Experiment 5b
267
6.7b Error rates (ERs) for synaesthetes as a function of colour condition (congruent, incongruent, opponent and ‘no colour’) in the modified Object Task in Experiment 5b
268
6.8a Mean response times (RTs) and Congruency Effects (with standard deviations in parentheses) for synaesthetes as a function of colour condition (congruent, incongruent, opponent and ‘no colour’) in the modified Resolution Task in Experiment 5b
269
6.8b Error rates (ERs) for synaesthetes as a function of colour condition (congruent, incongruent, opponent and ‘no colour’) in the modified Resolution Task in Experiment 5b
269
6.9a Mean response times (RTs) and Congruency Effects (with standard deviations in parentheses) for synaesthetes as a function of colour condition (congruent, incongruent, opponent and ‘no colour’) in the modified Transformation Task in
Experiment 5b
270
6.9b Error rates (ERs) for synaesthetes as a function of colour condition (congruent, incongruent, opponent and ‘no colour’) in the modified Transformation Task in Experiment 5b
Page
FIGURES
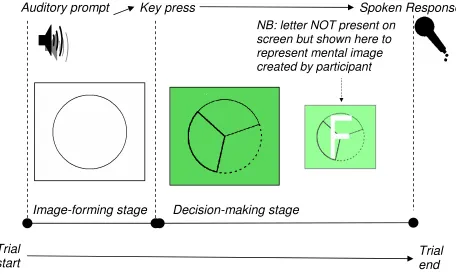
2.1 Example display of the Image-Forming Stage and Decision-Making Stage in the trial procedure of Experiment 1
87
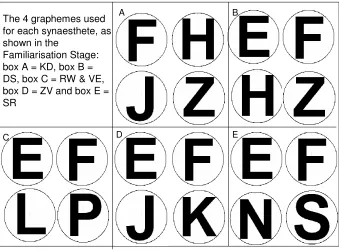
2.2 Visual displays of the four graphemes each synaesthete (and matched control group) was presented with in the Familiarisation Stage of Experiment 1
96
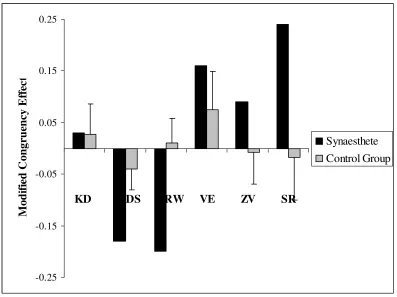
2.3 Comparison of modified congruency effect for synaesthetes and each synaesthete’s corresponding group of matched controls in Experiment 1. Note: error bars show two standard errors
104
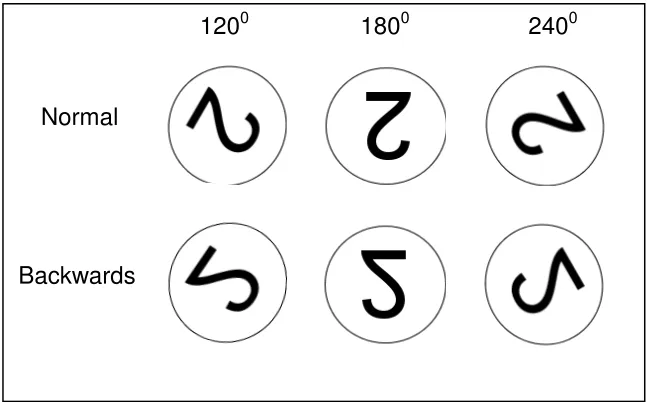
3.1 Target stimuli for Task 1 (Experiment 2) presented in ‘normal’ and ‘backwards’ format
123
3.2 Example of Task 2 (Experiment 2) target stimuli, presented in ‘normal’ and ‘backwards’ format, rotated 1200, 1800, and 2400 from the upright position
124
3.3 Interaction between colour condition (congruent, incongruent and no colour) and grapheme format (normal and backwards) for KD in Task 1 of Experiment 2 (with error bars showing 1 standard error)
136
3.4 Interaction between colour condition (congruent, incongruent and no colour) and grapheme format (normal and backwards) for VE in Task 1 of Experiment 2 (with error bars showing 1 standard error).
138
Page 3.5 Interaction between colour condition (congruent, incongruent and
no colour) and grapheme format (normal and backwards) for KD in Task 2 in Experiment 2 (with error bars showing 1 standard error)
142
4.1 Interaction between colour condition (congruent, incongruent and no colour) and grapheme format (normal and backwards) for RW in Experiment 3 (with error bars showing 1 standard error)
167
4.2 Interaction between colour condition (congruent, incongruent and no colour) and angle of rotation (‘00’, ‘1200’, ‘1800’ and ‘2400’) for VE in Experiment 3 (with error bars showing 1 standard error)
168
4.3 Modified congruency effect for each synaesthete in imagery tasks presented in Experiments 1, 2 and 3 (note * = p < .05 for standard congruency effect)
169
5.1 Trial procedure for Object Task and Resolution Task in Experiment 4
182
5.2 Trial procedure for Transformation Task in Experiment 4 184 5.3 Trial procedure for Spatial Task in Experiment 4 186 5.4 Trial procedure for Visual Task in Experiment 4 187 5.5 Sequence of events in Object Task from original Visual Cognition
Battery
190
Page 5.7 Sequence of events in Spatial Task from original Visual Cognition
Battery (including original versions of familiarisation boxes to mentally scan during subsequent trials)
192
5.8 Sequence of events in Spatial Task as used in Experiment 4 (including new versions of familiarisation boxes to mentally scan during subsequent trials)
192
5.9 Example of procedure used in the Familiarisation Task in Experiment 4 to practice forming an image of a grapheme
194
5.10 Examples of the four different locations of the ‘mark’ on the circle circumference indicating angle to rotate prompted grapheme in Experiment 4’s Transformation Task. Note: an equal number of trials had the mark located in the top and bottom half of the circle, and positions of thick/dashed sections of divided circle were not restricted to the examples shown.
197
5.11 Mean RTs for RW showing Task x Colour interaction in Experiment 4
234
5.12 Mean RTs for DS showing Task x Colour interaction in Experiment 4
236
5.13 Mean RTs for ZV showing Task x Colour interaction in Experiment 4
237
6.1 Modified trial procedure for Object and Resolution Task in Experiment 5b
265
6.2 Modified trial procedure for Transformation Task in Experiment 5b
Acknowledgements
I would like to thank my Director of Studies, Dr Ashok Jansari, and supervisors Dr Andy Burton and Dr Matthew Jones Chester, for their continued support, encouragement and advice throughout the process of conducting the research
and writing this thesis.
I would like to thank the synaesthetes, for sharing their experiences with me, and for taking the time to participate in the experiments within this thesis.
I would also like to thank Richard for his love, patience and understanding.
ABSTRACT
Chapter 1 – Literature Review
1.1 – Overview of thesis
The human sensory system works in such a way that for the vast majority of the population, a sensory stimulus presented in one modality will generate the perception of that stimulus within the same sensory modality. For example, a particular auditory stimulus will be perceived as a specific sound, such as the sound of a baby crying. However, for some individuals it is not as straightforward as this; in addition to the typical sensory sensations being elicited from certain stimuli, additional sensations are reported. The auditory stimulus, in addition to being perceived as a baby crying, may also generate the perception of visual shape or colour. The term ‘synaesthesia’ has been used to describe this perceptual phenomenon, wherein the attributes of certain sensory stimuli elicit additional sensory experiences (Galton, 1880). Synaesthesia can be either ‘acquired’ (for example through brain-damage (Armel & Ramachandran, 1999), the consumption of hallucinogenic drugs (Shanon, 2002), or through meditation (Walsh, 2005)), or it can be a ‘developmental’ condition being present since early childhood in otherwise typical individuals.
2003). Intra-modal synaesthesia usually involves the visual modality. With the example of grapheme-colour synaesthesia (the focus for this thesis), individuals experience additional colours in response to letters and numbers (graphemes), with the grapheme being referred to as the ‘inducer’ and the colour as the ‘concurrent’ (Grossenbacher & Lovelace, 2001). For example, the letter ‘A’ presented in a black font may generate a red concurrent, or the digit ‘7’ may elicit a green concurrent. It has been estimated that approximately 1-2% of the general population experience grapheme-colour synaesthesia (Simner et al., 2006) which is thought to be one of the more common variants of the many reported types (Day, 2005). Accordingly, it has become one of the most thoroughly studied forms.
started to address the issue of whether the inducer needs to be visually processed to elicit the synaesthetic concurrent. Some research suggests that the external presentation of the inducer is not a necessity, and that the mere concept of the inducer may be sufficient.
1.2 - Research concerning the concurrent (the synaesthetic colour)
subjective reports (Edquist, Rich, Brinkman, & Mattingley, 2006), and whether there are distinct behavioural patterns on certain perceptual tasks (Dixon, Smilek, & Merikle, 2004; Ward, Li, Salih, & Sagiv, 2006), these contrasting subjective reports of the concurrent immediately highlight the heterogeneous nature of the synaesthesia population.
The actual inducer-concurrent pairings are often reported to vary a great deal between individual synaesthetes, so while the letter “F” might be green for one synaesthete, it may be bright pink for another. Importantly however, many studies have found that within the same synaesthete the pairings are relatively stable over time. This internal reliability of the inducer-concurrent pairings was initially presented as objective evidence of the genuineness of the phenomenon (Baron-Cohen, Harrison, Goldstein, & Wyke, 1993; Baron-Cohen, Wyke, & Binnie, 1987). In what has essentially become referred to as the gold standard “Test of Genuineness” (ToG), synaesthetes are presented with a list of graphemes, words, and non-words, and are asked to report the synaesthetic concurrents for each. Their consistency in choice is then re-tested some time later, without prior warning (usually after three to six months). Synaesthetes typically have almost-identical pairings over the two tests, with the consistency averaging around 92%, whereas non-synaesthetes with the same colour-choice paradigm, but with prior warning of a re-test only one to two weeks later, have an average of 35-38% consistency (Baron-Cohen, Harrison, Goldstein, & Wyke, 1993; Simner et al., 2005).
ignore, even when this is at the detriment of task performance. A variant of the Stroop paradigm has been used to illustrate this (Elias, Saucier, Hardie, & Sarty, 2003; Mattingley, Rich, Yelland, & Bradshaw, 2001; Mills, Boteler, & Oliver, 1999; Odgaard, Flowers, & Bradman, 1999; Palmeri, Blake, Marois, Flanery, & Whetsell, 2002; Wollen & Ruggiero, 1983). In these studies synaesthetes have been visually presented with coloured graphemes, and asked to name the visual colour of each grapheme. When the grapheme colour does not match the colour of the concurrent experienced with that particular grapheme, synaesthetes are inhibited in their colour naming response time. In comparison, non-synaesthetes show no such difference. This has been interpreted as showing the interference caused to the synaesthetes’ ability to name the visual colour of a grapheme when it is presented in a colour that is incongruent with the synaesthetic colour elicited by that grapheme (in comparison to when the colour is congruent, or in baseline non-graphemic conditions).
stimuli. Synaesthesia researchers have adapted perceptual paradigms used within the field of visual perception research to assess the ‘perceptual reality’ of the internally generated colour experience of the concurrent, which occurs without the usual external stimulation of the sensory receptors.
to detect the shape formed by the target graphemes at a faster rate than non-synaesthetes, who simply perceived the stimuli as achromatic.
Another paradigm used to explore the perceptual qualities of the concurrent was a variation of the crowding task (Hubbard, Arman, Ramachandran, & Boynton, 2005) in which participants were required to identify an achromatic target grapheme presented in the periphery of their vision that was flanked by distractor graphemes. Typically, non-synaesthetes find accurate target identification difficult, due to the presence of the distractor graphemes. However, when individual synaesthetes were compared to their matched controls, three of the six synaesthetes tested showed more accurate achromatic target grapheme identification. Ramachandran and Hubbard (2001a) again suggested that the synaesthetes were using the colour of the concurrent elicited by the target grapheme to distinguish it from the distractor graphemes (which had a different coloured concurrent). This colour-facilitation has also previously been shown with some non-synaesthetes when differently coloured target and distractor graphemes were used (Kooi, Toet, Tripathy, & Levi, 1994).
rating of the brightness of a concurrent elicited from an achromatic grapheme embedded in a ‘shadow’ part of a lightness constancy illusion would be rated as less bright than a concurrent elicited from the same achromatic grapheme in the ‘light’ part of the illusion. To this end, they used the “Checkershadow Illusion” (Adelson, 2000) in which a picture is shown of the target stimuli placed on a checkerboard, either in the shadow of a large object or not in the shadow. Their single-case study found that the synaesthete’s perceived brightness of the concurrent was significantly affected by the grapheme’s apparent illumination. The authors suggested that this supports the idea that the concurrent was processed at an early stage of the visual processing stream, prior to the processing of lightness constancy. The results suggest that the brightness of the concurrent colour was adjusted by the same constancy mechanisms as “real” colour, and consequently that the concurrent was processed as a part of the visual scene.
positions, participants perceive the smooth movement of these stimuli from their first position in Frame 1 to their second position in Frame 2, rather than perceiving the two static frames they were shown (Wertheimer, 1912, cited in Kim et al, 2006). The direction of the movement of the stimuli is found to be ambiguous when the stimuli are an equal distance apart, but by adding a feature such as colour to the stimuli, this ambiguity disappears (Green, 1989, cited in Kim et al, 2006). Kim et al adapted this paradigm, so that in Frame 1 participants were shown achromatic graphemes. In Frame 2, when the stimuli were in different locations, rather than using achromatic graphemes, the stimuli were inducer coloured stimuli. By manipulating the colours of the non-inducer stimuli in Frame 2 to be congruent or incongruent with the concurrents elicited from the achromatic graphemes in Frame 1, the perceived direction of the apparent motion could be biased for the synaesthetes. These results therefore illustrate how synaesthetic concurrents interact with the ‘real’ colour, as if they were ‘real’ colours.
Papathomas, Yang, & Feher, 1996). Importantly colour, as a visual feature, has been shown to promote perceptual grouping over space in binocular rivalry (Kim & Blake, 2004). Consequently, by manipulating the ‘real’ and synaesthetically induced colours in pairs of rival images, Kim et al (2006) were able to show that there was a strong tendency to group ‘real’ and synaesthetic colours together, in the same way as there was to group two identical ‘real’ colours together.
were congruent or incongruent with the synaesthetic concurrent, but importantly there were two different incongruent conditions. The first involved an incongruent colour that was ‘opponent’ to the synaesthetic colour, with the idea that it would use the same colour channel as the synaesthetic colour. For example, if red was the congruent colour, then green would be the opponent colour. The second was ‘non-opponent’, so that the colour was processed by a different channel to the synaesthetic colour, for example yellow. The usual congruent-incongruent interference was found, but in support of their hypothesis, the difference between the two different incongruent conditions was also significant, with greater interference shown in the incongruent-opponent condition. The authors used this interference, which was found for all six synaesthetes tested, to argue that synaesthetic colour and ‘real’ colour were processed in the same colour channel, resulting in the observed pattern of interference.
grapheme-colour Stroop test. The authors suggested that this difference between the grapheme Stroop and object Stroop tasks supports the idea that semantic shape-colour associations use different mechanisms to synaesthetic grapheme-colour associations. Furthermore, the difference between the opponent and non-opponent naming times for the synaesthetes with the grapheme Stroop suggests that these grapheme-colour associations are likely to make use of neurons at an early stage of visual processing, where colours are processed by opponent colour channels.
boundaries on candidate structures involved in grapheme-colour synaesthesia, Hong and Blake (2008) tested how susceptible the concurrent is to these contextual influences on colour perception. They conducted experiments to see whether the concurrent could be affected by surrounding colours (spatial context), and whether prior exposure to the concurrent would affect the subsequent processing of ‘real’ colours (temporal context). Although manipulation of the brightness of surround-light levels (i.e. background colour) was found to influence the perceived appearance of ‘real’ colour, these manipulations were not found to affect the induced brightness of the concurrent colour. Additionally, previous and simultaneous exposure to synaesthetic colours was shown to not have an effect on the subsequent perception of real colours. Taken together these findings suggest that neural events at the very early stages of the colour processing stream do not contribute to the synaesthetic concurrent, and the authors concluded that the earliest possible area would be in the extrastriate visual areas. Therefore, unlike ‘real’ colour processing, which can be shown to feedback to the LGN, the processing of the concurrent seemingly did not result in this type of feedback, highlighting a difference between ‘real’ colour and concurrent colour processing.
colour-related cognitive tasks (the posterior fusiform gyrus or V4) and during tasks that require colour knowledge (medial ventral occipital regions) (Zeki & Marini, 1998). With regards to synaesthesia, researchers were therefore interested in finding out whether there would be increased activation of these early colour-selective regions when synaesthetes were either presented with spoken or visually displayed achromatic inducers. One of the first studies to explore the neural correlates of spoken word-colour synaesthesia used positron emission tomography (PET) to measure changes to regional cerebral blood flow (rCBF) when synaesthetes (N=6) and matched controls heard either spoken words or pure tones (Paulesu et al., 1995). As expected, when compared to the pure tone condition, the word condition showed greater activation for both groups in the language areas of the brain. Importantly there were also differences between the synaesthetes and non-synaesthetes, with the synaesthetes showing activation of visual associative areas, such as posterior temporal cortex and parieto-occipital junctions. However the study did not show any differences in activation in any of the early colour-selective visual areas. Therefore, although synaesthetes showed some atypical neural activity when presented with words that was associated with visual feature integration, there was no evidence of activity in the early colour processing regions that would support the perceptual reality of these colour experiences.
were presented with spoken words, compared to activation when listening to pure tones (no difference was found for matched controls). Importantly, further studies have since replicated this finding. Hubbard et al (2005) found increased activation in the colour-selective areas, when synaesthetes were presented with achromatic graphemes, compared to non-synaesthete controls. Sperling et al (2006) also found support for the hypothesis that the synaesthetic concurrent is accompanied by increased activation in the colour selective regions of the early visual areas, by comparing activation when synaesthetes viewed achromatic graphemes (inducers) compared to activation when viewing non-graphemic symbols (non-inducers). Greater activation in the colour-selective regions was found with the inducer condition for two of the four synaesthetes tested, again highlighting the heterogeneity of the synaesthete population.
words. Furthermore, with non-synaesthete participants Howard et al (1998) compared the neural activation during a colour imagery task (comparing colours of imaged objects) to a non-colour imagery task (judging difference between angles of clock hands), and did not find activation of the colour regions during the colour imagery task. Taken together these studies suggest an important difference between synaesthetic colour and imagined colours, and their approximation to veridical visual colour perception.
the colour-imagery task activated the colour selective area (V4) for both synaesthetes and non-synaesthetes, supporting the idea that colour imagery activates early visual areas involved in colour perception. In the synaesthetic-colour task participants were shown displays of four inducer graphemes (congruent or greyscale), and the task to was detect a brief disappearance of one of the four stimuli. In contrast with the colour-imagery task, although the synaesthetes showed increased activation in an area associated with colour knowledge (left medial lingual gyrus) with the greyscale displays in the synaesthetic-colour task, significant activation of the early colour selective area (V4) was absent. These results therefore did not support the findings of Nunn et al, and suggest potential differences in brain areas used for different types of internally generated colour experiences.
areas is related to the perceptual quality of the concurrent, and the subsequent impact this has on perceptual tasks. Additionally, Sperling et al (2006) found significant activation in the colour sensitive area for only two of the four synaesthetes scanned. They suggested that a possible explanation for this inconsistency between synaesthetes could be a phenomenological difference in the way these synaesthetes described their colour experiences. The two synaesthetes showing significant activation described their synaesthetic experience as seeing “a screen in their mind’s eye which gets completely coloured whenever seeing a letter inducing synaesthesia” (p.300). In contrast, the synaesthetes with no significant activation described their concurrents as “a transparent screen with a small and blurry but coloured version of the letter” (p.300). These distinct phenomenological reports therefore highlight a subjective difference in the experience of the concurrent, and importantly this difference is seemingly apparent in comparisons of the related brain activation. A potential explanation for conflicting results of the Rich et al (2006) study could therefore be that the concurrents for the synaesthetes tested were not strong enough to show activation in the early colour-selective areas, or that the synaesthetes had a type of synaesthesia more closely matching those reported by Sperling et al (2006) who did not show significant activation of the colour selective areas.
Zilles, & Fink, 2005). Interestingly, this comparison showed that viewing incongruently coloured graphemes increased activation in an area of the brain thought to be involved in cognitive control processes (left dorsolateral prefrontal cortex). It was proposed that these cognitive control processes were activated to help resolve the perceptual conflict of looking at an inducer eliciting a synaesthetic colour that does not match the ‘real’ colour being visually perceived. The authors argued that support for this interpretation comes from other studies showing activation of this brain region to help resolve perceptual conflict. For example, activation of the dorsolateral prefrontal cortex has been found when non-synaesthetes are presented with an incongruently coloured object, such as a purple banana (Zeki & Marini, 1998), and other situations when there is a conflict of the senses (Fink et al., 1999). It therefore seems that the processing of the concurrent is again similar to the processing of ‘real’ colours, to the extent that when a synaesthete is presented with a grapheme in the ‘wrong’ colour there is a similar neural response, as well as a subjective response, as when presented with familiar objects that are incongruently coloured.
1.3 – Research concerning the inducer (the presentation of the grapheme)
Overall, from the research findings outlined in Section 1.2, when some synaesthetes are visually presented with a grapheme, a concurrent is elicited which is not only subjectively similar to perceiving ‘real’ colour but is seemingly processed in a very comparable way, in terms of its ‘perceptual’ qualities, and also at a neuronal level. A further question considered in the synaesthesia literature relates to the processing of the inducer, and at what stage in the processing of the inducer the concurrent is generated. An issue that arises is whether the processes involved in the generation of the concurrent from the inducer, are in any way different to the processes involved in typical visual perception; for example, are there differences in the processes involved in the perception of a green object to the generation of a green concurrent when a synaesthete sees the letter ‘F’. As an initial step in exploring these issues, it is important to consider the sequence of events that occur when a non-synaesthete visually perceives a grapheme, so that comparisons can then be made to the sequence of processes thought to occur when a synaesthete is visually presented with a grapheme which elicits a concurrent.
processed as separate features in the ventral system, and then combined in perception with spatial attention integrating the features, so that they are perceived as one object (Treisman & Gelade, 1980). The role of the parietal lobes in typical feature binding has been further supported with studies in the non-synaesthete population that have applied Transcranial Magnetic Stimulation (TMS) to the parietal lobes (creating a ‘virtual lesion’), which document the subsequent deficit in target location in visual search tasks that require the conjoining of visual features (Ashbridge, Walsh, & Cowey, 1997). There is therefore a body of research which supports the premise that both the dorsal and the ventral system are involved in accurate visual feature-binding.
synaesthetes were better able to detect a target grapheme, placed amongst distractor graphemes, than non-synaesthetes. Often the synaesthetes subjectively reported that they became aware of the concurrent before seeing the grapheme; implying that the concurrent was elicited prior to recognition of the form. The behavioural findings from these visual search tasks were interpreted as evidence that the usual spatially selective attentional mechanisms were not required for the binding of the concurrent to the grapheme form, as the concurrent was seemingly able to guide focal attention.
supported with the findings of a study that used non-graphemic distractors (Sagiv, Heer, & Robertson, 2006). If concurrents were elicited pre-attentively then one would expect faster search times for the synaesthetes, regardless of whether the distractors were graphemic or non-graphemic. However, the two synaesthetes tested showed no such advantage in target detection when compared to the non-synaesthetes, adding support to the premise that spatial attention is required for the binding of the concurrent to the grapheme form.
magnitude of this interference to be affected by the relative location of the distractor digits (i.e. inside or outside the attention window). In support of this, the results showed that the interference was greater when the inducers were inside the window of visual attention, than when they were outside. From the results of this experiment, and those mentioned previously, Sagiv et al proposed that “attention plays a central role in integrating colour and shape in synaesthesia” (2006, p. 241), and so grapheme-colour binding can be seen to use similar mechanisms to those used in typical perception.
(Johnson, Jepma, & de Jong, 2007). Studies have suggested that unconscious colour priming with externally presented ‘real’ colour with the non-synaesthete population involves neural activity in the primary visual cortex (Breitmeyer, Ro, & Singhal, 2004), and so occurs in an early stage of the visual processing stream. Consequently, as synaesthetic concurrents are elicited by the grapheme at a later stage of the visual processing stream, Johnson et al (2007) argued that synaesthetic concurrents are very unlikely to be available at the early processing level required for unconscious colour priming. They therefore suggest that Mattingley et al’s conclusion could be premature, as their findings may simply be a result of the method used.
results add support to the idea that, for at least some synaesthetes, complete conscious recognition of an inducer is not essential for the synaesthetic colour to be elicited. The results suggest that although the level of processing of the grapheme was not enough to reach conscious awareness, there was enough processing for the subsequent synaesthetic concurrent to be induced. It therefore seems that Mattingley et al’s (2001) findings may have been due to the method used, rather than the need for the synaesthete to be consciously aware of the grapheme-form. Importantly however, Johnson et al (2007) do not suggest that the binding of the concurrent to the grapheme happens pre-attentively, but rather that explicit recognition of the inducer is not always a requirement.
concurrent elicited from the attended inducer would have greater interference with the ‘real’ colour than the concurrent elicited from the ignored inducer (Rich & Mattingley, 2003). In this study, synaesthetes and non-synaesthetes took part in a speeded visual colour-naming task, in which the visual colour was either congruent or incongruent with the attended grapheme. The results showed that a greater congruency effect was found when the visual colour was incongruent with the attended grapheme than when it was incongruent with the non-attended grapheme, thereby supporting the idea when there was stimulus competition, mechanisms of selective attention played an important role in the subsequent concurrent elicited. Therefore although the inducer is thought to elicit the concurrent without any voluntary effort (as described in Section 1.2 with the impact of the concurrent on cognitive and perceptual tasks) the focus of attention can be seen to be important.
irrelevant stimuli would be the synaesthetic concurrents induced by the graphemes. Therefore, when the task had a low attentional load there was enough processing capacity available to allow perceptual processing of the inducer and concurrent. However, in the high-load condition the attentional resources were used up by the task demands, and so the irrelevant items could not be fully processed. These results again show the importance of attentional mechanisms to the generation of a synaesthetic concurrent, since if the concurrent was elicited prior to the allocation of focused attention, there would have been no difference in the congruency effect found with the different attentional-load conditions. Mattingley et al also suggested that these results could explain why research that uses an attention-demanding task can report little or no effect of the synaesthetic concurrent on task performance.
hemisphere because grapheme processing is thought to be a left hemisphere function (Stephan et al., 2003). However, it should be noted that there is conflicting evidence about the question of laterality with synaesthesia. For example, Paulesu et al (1995) found that presenting synaesthetes with spoken words resulted in significant activation bilaterally in the superior parietal lobe, whereas Nunn et al (2002) found significant activation in the left angular gyrus, and Rich et al (2003) found activation in the right posterior parietal cortex. However, in support of the role of the left parietal lobe, a study using diffusion tensor imaging (DTI) to measure structural connectivity in synaesthetes’ and non-synaesthetes’ brains found that synaesthetes had increased connectivity not only around the location of the VWFA, but also around the left IPS and frontal lobe (Rouw & Scholte, 2007). This greater level of structural connectivity within the regions of the brain involved in colour-form binding can be used as support for the argument that this region is critical for synaesthetic binding.
area V1. The authors concluded that this provided support for the functional role of this region in the spatial binding of the concurrent to the grapheme form. They also commented that the difference in hemispheres was consistent with research evidence from the non-synaesthete population which has suggested that the right parietal cortex is more important than the left in typical colour-form binding (Ashbridge, Walsh, & Cowey, 1997).
it is externally located on the actual visual form of the grapheme) than when it is bound to an internal representation of the grapheme (i.e. associator synaesthetes). However, Muggleton et al found that applying TMS to the right parieto-occipital site disrupted the binding mechanisms for all of the synaesthetes, and so concluded that the region is important for binding the concurrent to inducers represented within both external and internal spatial reference frames.
in upper and lower case. When presented in Times the saturation was found to be higher than Sands, and when they were in uppercase the saturation was higher then when in lowercase. An interaction was also found, so that the highest saturation was in Times and uppercase. The authors suggested that this may be because the graphemes appeared more prototypical in this format. A limitation of this study is that it is only a single-case study, but it does provide a clear example of how the visual format of the grapheme can be important for the subsequent synaesthetic concurrent.
embedded figures task was affected by contrast, although with the crowding task the contrast effect was not as strong. The authors used these findings to argue that the visual form of the inducer can be critical for the synaesthetic experience, and posited that for this particular synaesthete at least, the concurrent was elicited at contrast-dependent stages of visual processing. Hubbard et al proposed that the likely area was the grapheme-processing area within the fusiform gyrus, the VWFA. Importantly, the neural response of this area to graphemes has also been shown to be contrast-dependent in the non-synaesthete population (Mechelli et al, 2000; Avidan et al, 2002, both cited in Hubbard et al, 2006), suggesting that the changes in strength of the concurrent could be due to these similar changes in the neural response in the VWFA.
grapheme was interpreted as a number (‘2’) but coloured as a letter (brown) synaesthetes were slower to name the visual colour of the grapheme, reflecting the expected congruency (and vice versa when interpreted as a letter but coloured as a number). The results therefore provide some support for the idea that an ambiguous grapheme can elicit different concurrents depending on the context. However, this difference was only found for two of the three ambiguous graphemes used. Dixon et al (2006) have been able to replicate these findings, but with a different synaesthete, and using five ambiguous graphemes. Although they used the same Stroop-based colour naming paradigm, instead of creating the context by using separate letter and digit trial blocks, Dixon et al used a random presentation of letter and digit context, and created the sense of context by placing the ambiguous symbol within a string of letters or digits. For example, an ambiguous grapheme that could be interpreted as either a ‘5’ or an ‘S’ was placed within the digit string ‘34567’ or the letter string ‘MUSIC’. Dixon et al argued that this modification of the method made the context more salient. Both of these studies show how presenting the same visual form, but with different contextual meanings, a different concurrent can be elicited. Dixon and colleagues have therefore argued that it is the concept of the inducer (i.e. the concept of ‘5’ or ‘S’) that determines the generation of the specific concurrent, rather than the visual form.
Merikle, 2002a). In these studies synaesthetes were presented with a mathematical sum and then a coloured block, and their task was to name the visual colour of the block and then give the answer to the sum. For the synaesthetes, but not the matched controls, the naming time was slower for trials in which the colour patch was incongruent with the sum, and was faster when it was congruent. This congruency effect was found despite the fact there was no external presentation of the answer to the sum. The results have therefore been taken to imply that simply thinking of a concept of an inducer is enough to elicit the concurrent, as the congruency effect observed was similar to that previously found with synaesthetic Stroop studies in which the inducer was visually presented (for example Wollen & Ruggiero, 1983). As there was no external visual presentation of the inducer with the mathematical Stroop studies, but yet the concurrent was still seemingly elicited, further support is provided for the idea that it is not the visual percept of the grapheme that elicits the concurrent. Instead, simply thinking about the concept of the inducer can be shown to elicit the synaesthetic concurrent.
1.4: Models of synaesthesia
is due to a difference in inhibition processes in typically existing neuronal pathways, (the 'Disinhibition-Unmasking Hypothesis'; Cohen Kadosh & Henik, 2007; Cohen Kadosh & Walsh, 2006; Grossenbacher & Lovelace, 2001). However, the current thesis will more specifically focus on two models of grapheme-colour synaesthesia that attempt to describe the precise processes involved in the generation of a concurrent from the presentation of a grapheme; the cross-activation theory (Ramachandran & Hubbard, 2001a, 2001b) and the re-entrant feedback model (Smilek & Dixon, 2002; Smilek, Dixon, Cudahy, & Merikle, 2001). Importantly, these models do not dispute the perceptual nature of the concurrent, but rather they disagree about the representational level at which the concurrent is elicited; whether it is at a perceptual level early in the visual processing stream, or later with higher level conceptual representations. This question of whether the concurrent is elicited through the processing of the visual form or the conceptual meaning of the inducer has important implications for the neural architecture potentially involved in synaesthesia. Although neuroimaging studies have provided some information about the neural correlates of the concurrent, information about the sequence of processes involved is sparse. Consequently, the models, as described below, have mainly been developed with behavioural evidence concerning the key processes thought to be involved when a concurrent is elicited from a grapheme.
stronger with prototypical examples, resulting in greater activation in the adjacent colour-processing area.
eliciting the concurrent evoked by the concept of a “2” (e.g. ‘red’). The continual cycle of feedforward and feedback signals then continues until “the perception that gradually accrues over successive iterations will be that of a synaesthetically red 2” (Smilek & Dixon, 2002, p. 10). Consequently, grapheme-form is linked to meaning, and importantly, the re-entrant feedback model proposes that it is this concept of the grapheme which feeds back colour-information to the colour processing area, and the concurrent therefore arises from top-down mechanisms.
possibility. They suggest that more recent developments with EEG or MEG should be able to explore this possibility as they have better temporal resolution.
As an alternative explanation of the findings from the mathematical Stroop paradigm, Hubbard et al (2006) suggest that the synaesthetes potentially created a spontaneous mental image of the digit as the answer to the sum. Consequently, the VWFA may have been activated by the top-down processes involved in mental imagery. Interestingly, an explanation put forward for studies with the non-synaesthete population showing activation of the VWFA during spoken-word tasks also suggests that this could be due to top-down activation of either orthographic or object-knowledge in visual cortex (Dehaene, Le Clec, Poline, Le Bihan, & Cohen, 2002). Hubbard et al (2006) propose that a mental image of a grapheme could activate the category selective regions of the fusiform gyrus, which has previously been shown to be activated by mental imagery (O'Craven & Kanwisher, 2000). However, to date, this is an aspect of synaesthesia that very little is known about, as objective data to show that a mental image of a grapheme can elicit a synaesthetic concurrent has not yet been provided.
1.5 – Focus of thesis (mental imagery and synaesthesia)
the inducer (Dixon, Smilek, Cudahy, & Merikle, 2000; Jansari, Spiller, & Redfern, 2006; Smilek, Dixon, Cudahy, & Merikle, 2002a). However, it has been suggested that with this apparently ‘concept-driven synaesthesia’ the concurrent may actually have been elicited by a mental image of the inducer that was spontaneously created by the concept (Hubbard, Manohar, & Ramachandran, 2006). It is therefore important to establish whether a mental image of an inducer can elicit a concurrent. There is some anecdotal evidence that this is the case. For example, the two synaesthetes tested in Ramachandran and Hubbard’s psychophysical study of synaesthesia reported that “if they ‘imaged’ the corresponding Arabic numeral then the corresponding colour was evoked, but more faintly than when looking at the actual numerals” (2001a, p. 979). In contrast, other synaesthetes have reported that imagining a grapheme can evoke a stronger colour than evoked from visually perceiving that grapheme (Ramachandran & Hubbard, 2003a). However, none of these studies have explicitly required the formation of a mental image of a grapheme and used experimental methodology to document the possible subsequent generation of a concurrent. This therefore remains an unanswered question within the synaesthesia literature.
Consequently, the external presentation of the inducer would not be a requirement for the concurrent to be evoked, as found with the mathematical Stroop paradigm studies (Smilek, Dixon, Cudahy, & Merikle, 2002a). The important aspect is the concept of the inducer, and as long as a mental image elicited the concept of an inducer, this model would predict that the concurrent would be generated. In their study of concept-driven synaesthesia Smilek et al commented that there are some synaesthetes “who can trigger photisms merely by thinking of, or imagining, the inducing stimulus” (2002a, p. 573), although as outlined already, their interpretation focused on the higher level semantic processes rather than perceptual processes. Similarly, the cross-activation theory can also be used to predict that a mental image of a grapheme would elicit a concurrent. However, as this model stresses the importance of the grapheme-form in the generation of the concurrent, the model would make a more specific prediction; the concurrent could only be elicited, if the top-down processing involved in the mental image generation propagated back to the areas where the grapheme-form is initially processed, which purportedly is the VWFA. This is because this model proposes that the concurrent is a result of cross-activation between the grapheme-form and colour processing areas. Consequently, an exploration of the determinants of the generation of a concurrent from a mental image of an inducer seems a useful method for testing these predictions, and adding to our understanding of the processes involved in grapheme-colour synaesthesia.
concurrent would be elicited regardless of whether these early visual areas were activated. Accordingly, by exploring the role different imagery processes play in the generation of a synaesthetic concurrent it is possible to directly test predictions made from the two main models of grapheme-colour synaesthesia.
whether the image generated was of a face or internal/external scene) by looking at fMRI data (O'Craven & Kanwisher, 2000). The authors argued that these similar activations most likely reflect a perceptual representation of the stimulus within the mental image, as the same region was found to be selectively activated in both imagery and perception. Additionally a study comparing activation when seeing or visualising faces, chairs and houses, found content-dependent activation during the imagery condition in small subsets of regions that had shown category-related activation when visually presented with the same stimuli (Ishai, Ungerleider, & Haxby, 2000). Importantly therefore, there is support for the idea that imagery and perception share many specific specialised functions.
Despite this, the relative size of an object in the visual field is seemingly still represented, so that a large object will activate a larger area of cortical cells (Fox et al., 1986). Neuroimaging studies have found activation of this area during mental imagery tasks (Klein et al., 2004; Slotnick, Thompson, & Kosslyn, 2005), and consequently it has been proposed that this activation supports the idea that it is possible for mental images to be ‘percept-like’ in quality. In what is referred to as the “Reality Simulation Principle” (Kosslyn, 2008), and also “Perceptual Anticipation Theory” (Kosslyn, 1994), it has been proposed that a function of such percept-like mental imagery is the generation of internal representations that mimic corresponding events or objects in the world. According to this theory images “arise when one anticipates perceiving an object or scene so strongly that a depictive representation of the stimulus is created in early visual cortex” (Kosslyn & Thompson, 2003, p. 724). In other words imagery can be seen as a form of hyper-priming, in which the top-down processes involved in perception, send ‘messages’ along the connections that run back from the areas in the temporal lobe to the retinotopically organised areas of primary visual cortex (referred to as the ‘visual buffer’).
actually perceived. If the image was then processed in the same way as an externally presented visual percept of a grapheme would be, it could be predicted that this image of an inducer would result in a synaesthetic concurrent. In order to provide support for the cross-activation theory, and argue that a synaesthetic concurrent elicited by a mental image of a grapheme shows the importance of visual processing in synaesthesia, the actual mental image of the grapheme therefore needs to have percept-like qualities in order for the grapheme-form to be processed in the early visual areas. However, if the mental image results from activity only in the ‘higher-order’ or association areas then a synaesthetic concurrent elicited from that mental image would not occur as a result of visual processing (as suggested by the re-entrant feedback model).
imagery processes’ (including details such as location and position), which potentially have differing underlying neural mechanisms. Furthermore, neuroimaging studies provide support for the idea that these purportedly distinct imagery processes make use of different neural pathways; whereas generating a detailed image of an object can activate the early visual areas (Klein, Paradis, Poline, Kosslyn, & Le Bihan, 2000; Kosslyn et al., 1999; Kosslyn & Thompson, 2003; Sparing et al., 2002), a spatial imagery process such as mental rotation of images activates areas within the parietal cortex (Alivisatos & Petrides, 1997; M. S. Cohen et al., 1996; Harris & Miniussi, 2003; Jordan, Heinze, Lutz, Kanowski, & Jancke, 2001). Accordingly, a general consensus has been developed within the imagery literature that there are two broad types of imagery processes; those using object processes and those using spatial processes (Mellet, Petit, Mazoyer, Denis, & Tzourio, 1998).
predicts that the type of imagery process would have an effect on the subsequent likelihood of the generation of the synaesthetic concurrent. Tasks that require object imagery processes, especially those that are thought to activate the early visual areas, would arguably be likely to generate a concurrent according to the cross-activation model, as the mental image of the grapheme would be processed in a very similar way to a visual percept of that grapheme. Conversely, the cross-activation theory would predict that a task requiring spatial imagery processes would be unlikely to generate a synaesthetic concurrent, as the spatial processes would not require a visual representation of the grapheme. Therefore, at a neuroanatomical level, spatial imagery processes would not be expected to activate the early visual form areas that the cross-activation theory proposes to be necessary for the generation of a synaesthetic concurrent.
Outline of thesis
phenomenon. As there is a great deal of research that suggests mental images not only share perceptual qualities with visual percepts, but that mental imagery shares many neural pathways with visual perception, it can be hypothesised that “synaesthesia can occur with incomplete activation of the entire cascade of sensory signalling normally propagated during perception” (Grossenbacher & Lovelace, 2001, p. 38).
Chapter 2 – Generating a synaesthetic concurrent from a mental image of a grapheme: the role of object imagery processes (Experiment 1)
2.1 – Experiment 1 Introduction
Object imagery processes
condition. The authors suggested therefore that they had found strong support for the idea that mental images of letters can use depictive representations, and for the idea that mental images share a similar format as visual percepts.
be found with a visually perceived grapheme. Furthermore, these findings have since been re-analysed to explore whether the amount of blood flow measured by PET in these areas was related to the time taken to complete the ‘grapheme characteristic’ judgement task (Kosslyn, Thompson, Kim, Rauch, & Alpert, 1996). The idea was that if primary visual cortex activation played a functional role in image generation then the amount of activity in that area should be related to the ‘quality’ or vividness of the mental image (i.e. a better quality image should result in a faster response time in the imagery task). Importantly, the re-analysis found that the time taken to evaluate the mental image of each letter was negatively correlated with rCBF in primary visual cortex; the slower times suggested that poorer quality images were associated with less activity in the area of interest. The authors therefore argued that the amount of activation was systematically related to the quality or vividness of the image being visualised, in addition to its spatial properties as indicated by their earlier study.
about the properties of the image. Comparing activation in the imagery task to activation found with audiovisual stimuli presentation showed that, although the imagery task activated a subsection of the neural network activated by the audiovisual stimuli, activation of early visual areas was only found in one of the ten participants. Similarly, a PET study comparing rCBF when visualising letters and text to internally listing the letters / text found no significant activation of the primary visual cortical areas (Gulyas, 2001).
instructed to ‘carefully inspect the straight and curved lines in each letter” (Gulyas, 2001, p. 320), but there was no behavioural measurement taken of the level of detail in the images. As a result, the lack of activation in early visual areas could again be due to the task requirements, as the task did not require a high level of image resolution.
Task requirements to measure synaesthetic concurrent
synaesthetes have been shown to have a physiological reaction, such as pupil dilation, which is controlled by the autonomic nervous system (Paulsen & Laeng, 2006). A recent study also suggested an emotional reaction to viewing incongruently coloured inducers (Callejas, Acosta, & Lupianez, 2007). Furthermore, neuroimaging evidence suggests that being visually presented with an incongruent grapheme is associated with activation in areas of the brain associated with cognitive control mechanisms (Weiss, Zilles, & Fink, 2005). Overall, it appears that the colour conflict paradigm is a well-established method for measuring the synaesthetic concurrent, by looking at the effect the conflict has on task performance.