International Journal of Emerging Technology and Advanced Engineering
Website: www.ijetae.com (ISSN 2250-2459, Volume 2, Issue 4, April 2012)216
Study and Comparison of Various Modulation Classification
Techniques under Noisy Channel Conditions
Jaspal Bagga
1, Dr Neeta Tripathi
21 Asso. Proff,Deptt of E&TC SSGI,Bhilai(C.G.)India 2 Principal SSITM Bhilai (C.G.)India
2
Abstract—Automatic Modulation Classification is a
procedure performed at the receiver based on the received signal before demodulation when the modulation format is not known to the receiver. : Automatic Modulation Classification is also believed to play an important role in the implementation of Software Defined Radio (SDR) of the 4th-Generation (4G) communication system. The ability to automatically select the correct modulation scheme used in an unknown received signal is a major advantage in a wireless network.
The automatic recognition of the modulation format of a detected signal, the intermediate step between signal detection and demodulation, is a major task of an intelligent receiver. The work aims in devising low complexity blind algorithm under noisy and frequency selective channel conditions Database has been generated for various modulated signals such as 2ASK, 4ASK, 2FSK,4FSK, BPSK and QPSK and QAM signals. Additive White Gaussian Noise (AWGN) noise is added and signals are analyzed for varying Signal To Noise (SNR) ranging from 30db to a lower-bound channel SNR of 0db.
Keywords— Additive White Gaussian Noise, Automatic
Modulation Classification, digital modulation, Statistical parameters, Wavelet transform,
I. INTRODUCTION
Over the past two decades, a major transition has occurred from analog modulation to digital modulation techniques in communication systems. Moreover, while communication systems were initially established as voice networks, they now have to accommodate computer data as well as multimedia content. And, as more and more users join the communication network the need for efficient use of available bandwidth in the RF spectrum becomes even more important. Digital modulation techniques provide more information carrying capacity, better quality communication, data security and RF spectrum sharing to accommodate more services when compared to analog modulation.
Automatic Modulation Classification (AMC) is a problem of current and future significance for both commercial and military communication systems. In an adaptive communication system, the modulation format can be changed according to the channel state to achieve high efficiency communication.
International Journal of Emerging Technology and Advanced Engineering
Website: www.ijetae.com (ISSN 2250-2459, Volume 2, Issue 4, April 2012)217
The developed scheme based on wavelet transform and statistical parameters have been used to identify M-ary PSK, M-ary QAM, and M-ary FSK modulations. The channel conditions considered include only AWGN channel, and the receiver is assumed to have a prior knowledge of carrier frequency and symbol rate[16]
The second technique adopted was to design digital modulation identifier using wavelet transform for ASK, QAM, PSK and FSK signals. It computes the magnitude of HAAR wavelet of an input signal with and without amplitude normalization, for pre-processing uses median filters to remove the peaks in the HWT, calculates the variances of the median filter outputs, and makes the decision of the input modulation type by comparing the variances with thresholds. Simulations showed that the percentage of correct identification is higher, when SNR is greater than 7Db . The limitation is that the difference in the threshold values is very small .The channel conditions considered include only AWGN channel [17].
The third technique adopted is a simple, effective and robust method based on the stochastic features derived from instantaneous features to classify digital modulation signals.. This method is capable of differentiating ASK2, ASK4, FSK2, FSK4, PSK2 and PSK4 signals at the output of a typical high frequency channel with white Gaussian noise, Unlike most other existing methods, this method assumes no prior information of the incoming signal (symbol rate, carrier frequency, amplitude etc.). Simulation results demonstrate that this approach is robust in various practical situations in identifying the modulated signals. When SNR is less than 5 dB, the percentage of correct identification is about 90% which increases for higher SNR [18].
II. MODULATION IDENTIFICATION TECHNIQUES
Two general classes of AMC algorithms can be crystallized. Likelihood-Based (LB) and Feature-Based methods (FB). The former is based on the likelihood function of the received signal and the decision is made comparing the likelihood ratio against a threshold. A solution offered by the LB algorithms is optimal in the Bayesian sense, viz., it minimizes the probability of false classification. The optimal solution suffers from computational complexity. In the FB approach, on the other hand, several features are usually employed and a decision is made based on their observed values. Once the modulation format is correctly identified, other operations, such as signal demodulation and information extraction,
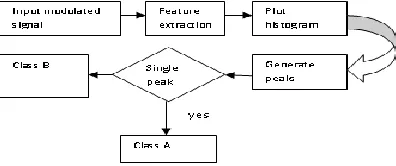
[image:2.612.362.509.170.291.2]can be subsequently performed. The Modulation Classification model in shown in Fig. 1
Fig 1 Modulation classification model
The work of the pre-processor is to increase the performance of the classifier. The pre-processor removes disturbances from the signal such as interfering signals and increasing the (SNR) and also filtering the received signal, down converting, equalizing, it then compensates for fading on the channel. This is only a preparation for the feature processor which extracts discrimination features of the signal before the classifier makes the decision about the modulation type of the given available data.
A. Technique 1
This technique of modulation identification scheme for recognition of digitally modulated signals is based on transient behavior of digitally modulated signals . In ideal case, the Haar WT magnitude (jHWTj) of a PSK signal is a constant and that of a FSK signal is a multistep function. Hence the variance of jHWTj of an input signal is used as a feature to classify the two signals. Compared to PSK and FSK signals, one distinction in QAM signal is that it does not have constant amplitude. The jHWTj of a QAM signal is a multi-step function similar to that of a FSK signal because of the change in amplitude as symbol changes. Histogram peak count technique is used to distinguish the modulated signals for varying SNR’s. The modulation identification scheme is shown in Fig.2
[image:2.612.350.548.611.694.2]International Journal of Emerging Technology and Advanced Engineering
Website: www.ijetae.com (ISSN 2250-2459, Volume 2, Issue 4, April 2012)218
B. Technique 2
In Technique 2 Wavelet Transform modulation identifier for ASK QAM, PSK and FSK signals is used. The identifier as in Fig.3 consists of two branches .One branch is without amplitude normalization and the other is with amplitude normalization. The identifier first finds the wavelet transform an input signal. After removing the peaks of by a median filter, the identifier computes the variance of the median filter outputs. V1 is the variance obtained without normalization and V2 is variance with normalization.
Fig. 3 Identification algorithm for technique 2
C. Technique 3
This technique of modulation classification is based on the stochastic features derived from instantaneous features to classify digital modulation signals.. This method is capable of differentiating ASK2, ASK4, FSK2, FSK4, PSK2 and PSK4 ,16 QAM signals at the output of a typical high frequency channel with white Gaussian noise, Unlike most other existing methods, this method assumes no prior information of the incoming signal (symbol rate, carrier frequency, amplitude etc.).The identification algorithm is shown in Fig.4.
Fig .4 Identification algorithm for Technique 3
III. RESULTS AND DISCUSSION
In technique 1 the identification has been done using statistical parameters. Digitally modulated signal corrupted by noise is used as input signal .Code is developed to extract features such as mean and variance for the signal .Histogram is plotted for various input signals and and then peaks are generated. Based on the peaks, decision is taken .Since the transient characteristics of ary QAM and M-ary PSK signal are constant it will have single peak in its histogram but the M-ary FSK signals have more than single peak because these signals have multistep frequency component .
Signals are further classified as that belonging to Class A and Class B , based on threshold values decided based on number of signals .Signals falling in class A and class B has been shown in Table 1.
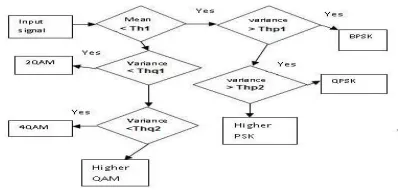
Further classification of signals belonging to class A based on comparison of statistical values with threshold values (Th1) and variance (thp1, thp2,thq1,thq2)as calculated using wavelet transform, is shown in Fig 3. Verification of signals is also done by finding the transient values by applying 1D wavelet transform to various modulated signals. The wavelet selected is Haar Wavelet.
In this technique 5-class problem was considered, channel conditions considered were AWGN channel, this technique using decision tree classifier has 85 %success rate in classification for SNR limit of 15 db.
TABLEI
CLASSDISTINCTIONOFMODULATEDSIGNALS
[image:3.612.343.542.475.573.2]Further classification of signals belonging to class A based on comparison of statistical values with threshold values (Th1) and variance (Thp1, Thp2, Thq1, Thq2)as calculated using wavelet transform, is shown in Fig. 5
Fig. 5 Classification of Class A type Signals
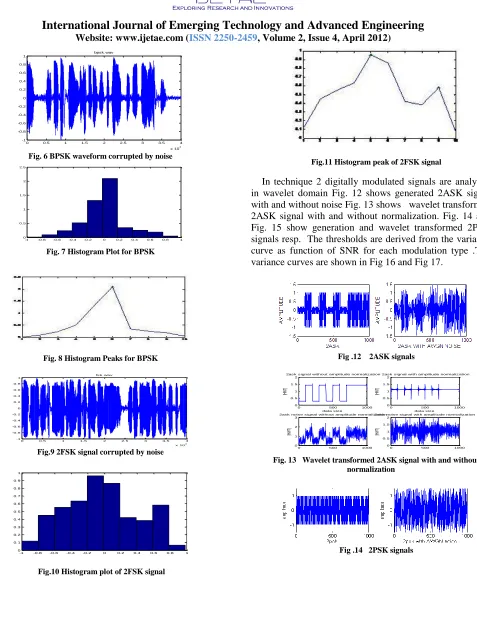
Noisy BPSK Signal is generated as shown in Fig.6 The histogram plot and histogram peak of BPSK is shown in Figs. 7 and 8, respectively. These figures show as M-ary PSK signal has constant transient characteristics; it has a single peak in its histogram. Fig. 9 shows a M-ary FSK signal, its histogram plot is shown in Fig 10 . Fig 11 shows multiple peaks as signal have multistep frequency component .which distinguishes the two signal.
Class A Class B
M-ary PSK M-ary FSK
International Journal of Emerging Technology and Advanced Engineering
Website: www.ijetae.com (ISSN 2250-2459, Volume 2, Issue 4, April 2012)219
0 0.5 1 1.5 2 2.5 3 3.5 4
x 104
-1 -0.8 -0.6 -0.4 -0.2 0 0.2 0.4 0.6 0.8 1
[image:4.612.73.550.87.704.2]bpsk.wav
Fig. 6 BPSK waveform corrupted by noise
-1 -0.8 -0.6 -0.4 -0.2 0 0.2 0.4 0.6 0.8 1 0
[image:4.612.334.528.105.252.2]0.5 1 1.5 2 2.5
Fig. 7 Histogram Plot for BPSK
Fig. 8 Histogram Peaks for BPSK
0 0.5 1 1.5 2 2.5 3 3.5 4
x 104 -1
-0.8 -0.6 -0.4 -0.2 0 0.2 0.4 0.6 0.8 1
fsk.wav
Fig.9 2FSK signal corrupted by noise
-1 -0.8 -0.6 -0.4 -0.2 0 0.2 0.4 0.6 0.8 1 0
0.1 0.2 0.3 0.4 0.5 0.6 0.7 0.8 0.9 1
Fig.10 Histogram plot of 2FSK signal
Fig.11 Histogram peak of 2FSK signal
[image:4.612.84.263.126.656.2]In technique 2 digitally modulated signals are analyzed in wavelet domain Fig. 12 shows generated 2ASK signal with and without noise Fig. 13 shows wavelet transformed 2ASK signal with and without normalization. Fig. 14 and Fig. 15 show generation and wavelet transformed 2PSK signals resp. The thresholds are derived from the variance curve as function of SNR for each modulation type .The variance curves are shown in Fig 16 and Fig 17.
Fig .12 2ASK signals
0 500 1000
0 0.5 1 1.5 2
data size
|H
W
T|
2ask signal without amplitude normalization
0 500 1000
0 1 2 3
|H
W
T|
2ask noise signal without amplitude normalization
0 500 1000
0 0.5 1 1.5 2
data size
|H
W
T|
2ask signal with amplitude normalization
0 500 1000
0 0.5 1 1.5 2
|H
W
T|
2ask noise signal with amplitude normalization
Fig. 13 Wavelet transformed 2ASK signal with and without normalization
[image:4.612.351.548.367.542.2]International Journal of Emerging Technology and Advanced Engineering
Website: www.ijetae.com (ISSN 2250-2459, Volume 2, Issue 4, April 2012)220
0 500 1000
0 0.5 1 1.5 2 data size |H W T|
2psk signal without amplitude normalization
0 500 1000
0 1 2 3 |H W T|
2psk noise signal without amplitude normalization
0 500 1000
0 0.5 1 1.5 2 data size |H W T|
2psk signal with amplitude normalization
0 500 1000
0 0.5 1 1.5 2 |H W T|
[image:5.612.75.274.134.217.2]2psk noise signal with amplitude normalization
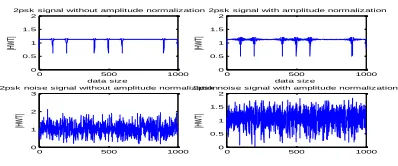
[image:5.612.73.274.263.357.2]Fig. 15 Wavelet transformed 2PSK signal with and without normalization
Fig 16 Variance curve 1(without normalization)
Fig .17 Variance curve 1(with normalization)
Decision of the input modulation type is done by comparing the variances with thresholds. Simulations showed that the percentage of correct identification is higher, when SNR is greater than 7Db . The limitation is that the difference in the threshold values is very small. Percentage of classification falls below 5Db
In technique 3 various digitally modulated signals such as 2ASK, 4ASK, 2PSK, 4PSK, 2FSK, 4FSK, 16QAM are first generated and analyzed with and without noise. The carrier frequency and the sampling frequency has been taken as 10kHz and 200kHz respectively. The symbol rate taken is 600 symbols per second. .Signals are then passed through AWGN channel. The binary data stream for modulation has been obtained from random number generator. Fig 18 and Fig. 19. show the generation of signals 2ASK and 2FSK respectfully as an example.
Stochastic features such as amplitude mean, amplitude mean-square, phase mean ,frequency mean square are calculated and derived from instantaneous features for all set of signal 2ASK, 4ASK, 2PSK, 4PSK 2FSK, 4FSK and 16 QAM. Fig.20 shows instantaneous amplitude, phase and frequency for 2ASK signal. The feature vectors derived for all modulated signals and are plotted for SNR varying from 0db to 20 db. These instantaneous features are first derived for all modulated signals as the stochastic features derived are based on them. Five class of feature vectors are used to classify the signals Threshold values are thus derived based on these features .Decision tree classifier is developed to classify the modulated signals.
0 500 1000
-1.5 -1 -0.5 0 0.5 1 1.5 2ASK signal
0 500 1000
-1.5 -1 -0.5 0 0.5 1 1.5
2ASK signal snr=20db
0 500 1000
-3 -2 -1 0 1 2 3
[image:5.612.376.523.299.368.2]2ASK signal snr=10db
Fig .18 2ASK signal with and without AWGN noise
0 500 1000
-1.5 -1 -0.5 0 0.5 1 1.5 2fsk signal
0 500 1000
-1.5 -1 -0.5 0 0.5 1 1.5
2fsk signal snr=20db
0 500 1000
-3 -2 -1 0 1 2 3
2fsk signal snr=10db
Fig. 19 2FSK signal with and without AWGN noise
100 200 300 400 500 600 700 800 900 1000 0
0.5 1 1.5
amplitude
0 50 100 150 200 250 300 350 400 450 500
-1 0 1
phase
0 50 100 150 200 250 300 350 400 450 500
-1 0 1
frequency
F ig .20 Amplitude, Phase and Frequency plot for 2ask signal
IV. CONCLUSION
[image:5.612.73.274.396.496.2] [image:5.612.361.540.498.578.2]International Journal of Emerging Technology and Advanced Engineering
Website: www.ijetae.com (ISSN 2250-2459, Volume 2, Issue 4, April 2012)221
The developed algorithm for classification is suited for number of modulation schemes employed in SDR, the algorithm developed is used to test for various modulated corrupted signals. Experimental results indicates that the proposed method can be effectively used to classify M-ary ASK, M-ary PSK and M-ary FSK, 16-QAM in this 7 class problem. Simulated results show that correct modulation identification is possible for varying SNR under AWGN and multipath Raleigh fading channel conditions. Carrier frequency estimation and channel equalization work especially for higher order QAM class will be included in future work .
REFERENCES
[1] S. Z. Hsue and S. S. Soliman,1989 “Automatic modulation recognition of digitally modulated signals,” in Proc. IEEE MILCOM, , pp. 645-649.
[2] S.-Z. Hsue and S.S. Soliman, 1990. “Automatic modulation classification using zero crossing,” in IEEE Proceeding (Radar and Signal Processing), vol. 137, no. 6, pp. 459-464,
[3] Polydoros and K. Kim, 1990. “On the detection and classification of quadrature digital modulations in broad-band noise,” in IEEE Transactions on Communications, vol. 38, no. 8, pp. 1199-1211
[4] B.F. Beidas and C.L.Weber, 1995. “Higher-order correlation based approach to modulation classification of digitally modulated signals,” in IEEE Journal on Selected Areain Communications, vol. 13, no.1, pp. 89-101,
[5] Y. T. Chan, 1995. Wavelet Basics, Kluwer Academic Publishers
[6] K.C. Ho,W. Prokopiwand Y.T. Chan,1995 “Identification of M-ary PSK and FSK signals by the wavelet transform,”in Proceedings IEEE Military Communications Conf., pp. 886-890, California,
[7] E. E. Azzouz and A. K. Nandi, 1996. “Automatic Modulation Recognition of Communication Signals”, Kluwer Academic Publishers,
[8] Alfred O. Hero III and Hafez Hadinejad-Mahram, 1998 “Digital modulation classification using power moment matrices,” in Proceedings IEEE ICASSP-.
[9] Xiaoming Huo and David Donoho, 1998. “A simple and robust modulation classification method,” in Proceedings IEEE ICASSP,
[10]Y.C. Lin and C.-C. Jay Kuo,1998 “Modulation classification using wavelet transform,” in Proceedings SPIE, vol.2303, pp. 260-271.
[11]K. Kim and A. Polydoros, 1998“Digital modulation classification: the BPSK versus QPSK case,” in Proc. IEEE MILCOM, , pp. 431-436.
[12]J. A. Sills, 1999 “Maximum-likelihood modulation classification for PSK/QAM,” in Proc. IEEE MILCOM, , pp. 57-61.
[13]W. Wei and J. M. Mendel, 2000. “Maximum-likelihood classification for digital amplitude-phase modulations,”IEEE Trans.Commun., vol. 48, pp. 189-193,
[14]P. Prakasam and M. Madheswaran,2008 “Digital Modulation Identification Model Using Wavelet Transform and Statistical Parameters” Research Article
[15]Fatima K. Faek 2010 “Digital Modulation Classification Using Wavelet Transform and Artificial Neural Network “(JZS) Journal of Zankoy Sulaimani
[16]Jaspal Bagga and Dr. Neeta Tripathi Recognition of Digitally Modulated Signals Using Statistical Parameters,i-managers journal on Electrical Engineering Vol 4.no.1.july-sep 2010
[17]Jaspal Bagga and Dr. Neeta Tripathi ,”modulation type classification for amplitude, frequency and phase shift keyed signals in the wavelet domain, proceedings of International Symposium FRSM/CMMR, March 09-11 2011 pp.203-206