Journal of Chemical and Pharmaceutical Research, 2014, 6(4):450-456
Research Article
CODEN(USA) : JCPRC5
ISSN : 0975-7384
Optimal mixed strains fermentation process for douchi
Fumin Yang*, Min Yang, Lidan Feng, Ruojun Ding and Yun Peng
College of Food Science and Engineering, Gansu Agricultural University, Lanzhou, China
_____________________________________________________________________________________________
ABSTRACT
In order to standardize the production of traditional douchi, dominant strain QY2b screened from traditional fermented douchi of Qingyang, Gansu and Bacillus subtilis, Rhizopus oryzae and Aspergillus oryzae preserved by CICC was selected as strain. Through four factors and three levels quadratic regression orthogonal rotated combination design and single factor experiment and orthogonal experiment, proportion of mixed strain and fermentation technology were optimized. Also, physiochemical indexes of final product and compounds and relative content of volatile flavor was tested. Results show that under the condition that QY2b: Bacillus subtilis: Rhizopus oryzae: Aspergillus oryzae=1:0.8: 2: 1.3, overall inoculation 1.5%, fermentation temperature 37℃, fermentation time 72h, the dosage of salt 15% and after fermentation 20d, compared with QY2b pure breed fermented douchi, reducing sugar and amino acid nitrogen of mixed strains raised by 22.18% and 82.61% respectively. What is more, total detectable amount of volatile components of douchi increased by 1.76%, chemical compounds raised by four categories of 21 species. All above indicates that mixed strains were superior to QY2b pure breed fermented douchi.
Key words:Douchi; Fermentation conditions; Optimization; Flavor
_____________________________________________________________________________________________
INTRODUCTION
Douchi, one of the four traditional fermented soybean products, is a perfect food and drug resource. It contains antioxidant, antibacterial, disease-preventable components and so that it has good development prospects[1,2]. Traditional home making douchi mainly uses of natural fermentation, microorganism comes from natural environment so that species are complex and fermentation conditions are greatly affected by climate. Product quality and flavor are hard to control. Currently douchi production process mostly are: Soybean soaking, cooking, cooling, inoculating and stater, after fermentation, drying or frying[3]. Domestic and foreign douchi researches mainly focused on strain breeding of traditional fermented douchi selection and optimization of fermentation conditions of mixed bacteria strain and so on. Peng Yun, etc. conducted separation and purification of traditional douchi production fermentation microorganisms from Qingyang, Gansu, screened out one advantage fermenting strain QY2b through producing protease, amylase, cellulase activity test[4]. According to morphological and 16S rDNA identification, QY2b belongs toBacillus subtilis; Qu Zhi, etc. separated, purified and screened douchi from Yangfan Plant, Jiangyang and got an advantage strain[5]. According to morphological and 18S rDNA identification, it belongs toAspergillus oryzae; Mouguang Qing researched and showed that starter-making ofBacillus subtilismixed withAspergillus oryzaeat temperature of 33.5℃, time 51.6h, inoculum of 0.9% can get fine fermentation quality[6].
EXPERIMENTAL SECTION
1.1 Materials
Soybeans: purchased from market and were required full and shine, without mould rot.
QY2b strain: screened by Peng from the dominant fermentation strains in traditional douchi (Qingyang Gansu province).
Bacillus subtilis, Rhizopus oryzaeandAspergillus oryzaewere donated by CICC.
1.2 Methods
1.2.1 The Rate of Mixed Strains
According to the method of Wang(wang 2006), the load of mixed strains was 1.5%,under the condition of 35℃
starter-making for 72h and secondary fermentation for 20d.With factors for the inoculum size of QY2b(X1),Bacillus
subtilis(X2), Rhizopus oryzae(X3) and Aspergillus oryzae(X3), under the foundation of signal strain fermentation,
four factors three levels quadratic regression orthogonal rotation combination test was used to optimize the dose rate.
1.2.2 Fermentation Condition of Mixed Strains 1.2.2.1 Single Factor Experiment
Under the condition of 35℃,1.5% inoculum dose, starter-making for 72h, 15% salt and secondary fermentation for 20d. Fixed other conditions to carried out single factor experiment and set temperatures for 28℃, 30℃, 35℃, 37℃, 40℃respectively; inoculum dose for 0.5%,1%,1.5%,2%, 2.5%, 3%, 3.5% respectively; starter-making for 24h, 36h, 48h, 60h, 72h, 84h, 96h respectively; secondary fermentation for 5d, 10d, 15d, 20d, 25d respectively, meanwhile detect the concentration of amino acid nitrogen in the final product to confirm the factors and levels of orthogonal experiment. All treatments were performed in triplicate.
1.2.2.2 The Orthogonal Experiment
On the foundation of single factor experiment, L9(34) orthogonal experiment was used.
1.2.3 The Detection of the Final Product
The total acid, reducing sugar, amino acid nitrogen, aflatoxin B1was detected by the related national standard.
Volatile compounds analysis: A 75 μm CAR/PDMS fiber was used for aroma extraction. Afterwards, samples were analyzed by SPME-GC-MS on a OV-1701 column(50m×0.2mm×0.33μm film thickness). The volume of injection was at 240℃. The temperature of ion source was 260℃. The range of masses was 35-450 U. Volatile compounds were identified by JCMC Browser Spectral library and quantified by peak area normalization method.
RESULTS AND DISCUSSION
2.1 Determine the proportion of mixed bacteria Response surface test results (see Table 1)
Regression equation:
Y=1.07-0.077X1-0.10X2-0.026X3-0.089X4+0.029X1X2+0.025X1X3-0.057X1X4-0.016X2X3+0.14X2X4
-0.064X3X4-0.26X12-0.18X22-0.23X32-0.17X42
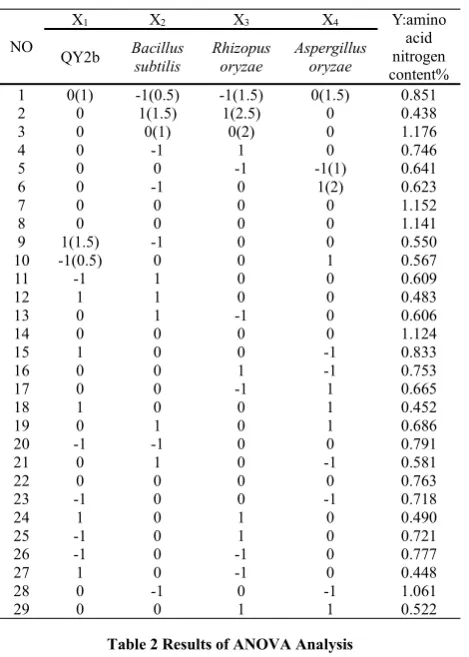
Table 1 Results of response surface
NO
X1 X2 X3 X4 Y:amino
acid nitrogen content% QY2b Bacillussubtilis Rhizopusoryzae Aspergillusoryzae
1 0(1) -1(0.5) -1(1.5) 0(1.5) 0.851 2 0 1(1.5) 1(2.5) 0 0.438
3 0 0(1) 0(2) 0 1.176
4 0 -1 1 0 0.746
5 0 0 -1 -1(1) 0.641
6 0 -1 0 1(2) 0.623
7 0 0 0 0 1.152
8 0 0 0 0 1.141
9 1(1.5) -1 0 0 0.550
10 -1(0.5) 0 0 1 0.567
11 -1 1 0 0 0.609
12 1 1 0 0 0.483
13 0 1 -1 0 0.606
14 0 0 0 0 1.124
15 1 0 0 -1 0.833
16 0 0 1 -1 0.753
17 0 0 -1 1 0.665
18 1 0 0 1 0.452
19 0 1 0 1 0.686
20 -1 -1 0 0 0.791
21 0 1 0 -1 0.581
22 0 0 0 0 0.763
23 -1 0 0 -1 0.718
24 1 0 1 0 0.490
25 -1 0 1 0 0.721
26 -1 0 -1 0 0.777
27 1 0 -1 0 0.448
28 0 -1 0 -1 1.061
[image:3.595.191.426.86.415.2]29 0 0 1 1 0.522
Table 2 Results of ANOVA Analysis
Resource SS Df MS F-value P-value Model 1.18 14 0.084 5.75 0.0012 ** X1 0.072 1 0.072 4.89 0.0441 *
X2 0.12 1 8.003E-004 8.46 0.0114 *
X3 8.427E-003 1 9.720E-004 0.58 0.4605
X4 0.096 1 3.201E-003 0.55 0.0227 *
X1X2 3.306E-003 1 2.550E-003 0.23 0.6419
X1X3 2.401E-004 1 0.082 0.16 0.6915 *
X1X4 0.013 1 0.030 0.90 0.3579
X2X3 9.922E-004 1 4.830E-003 0.068 0.7983
X2X4 0.074 1 0.013 5.04 0.0415 *
X3X4 0.016 1 9.025E-003 1.11 0.3097
X12 0.43 1 0.51 29.10 <0.0001 **
X22 0.22 1 0.33 14.84 0.0018 **
X32 0.34 1 0.29 23.22 0.0003 **
X42 0.19 1 0.57 13.32 0.0026 **
Residual 0.20 14 0.012
Lack of fit 0.085 10 0.016 0.28 0.9525 ns pure error 0.12 4 2.677E-0032
Total variation 1.38 28
[image:3.595.225.388.642.691.2]**very significant level(p<0.01);*significant level(p<0.05);ns non-significant
Table 3 Analysis of variance Std.
Dev. 0.12 R-Squared 0.8519 Mean 0.72 Adj R-Squared 0.7038 C.V.% 16.73 Pred R-Squared 0.5117 PRESS 0.68 Adeq Precision 7.5140
Predicted value of amino acid ammonia content regression equation is 1.11675%, and the test result is 1.115% and it is roughly the same as the predicted value, indicates that through response surface optimization, the best inoculation proportion is that QY2b: Bacillus subtilis: Rhizopus oryzae: Aspergillus oryzae=1:0.8: 2: 1.3.
[image:4.595.196.410.153.349.2]2.2 Optimal mixed strains fermentation process 2.2.1 Single factor test results
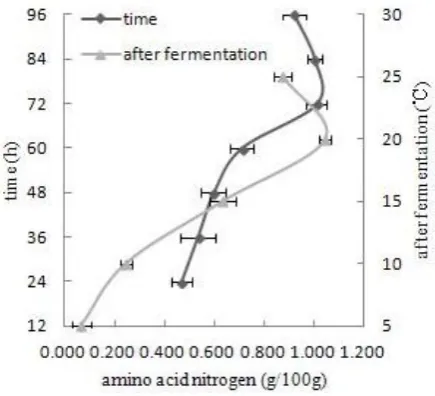
[image:4.595.200.418.389.587.2]Fig.1 The effect of different inoculum concentration and temperature on fermentation
Fig.2 The effect of the time on fermentation
Figure 1 illustrates that finished products of amino acid nitrogen content increased with the raising of inoculum size. Amino acid nitrogen content reaches a maximum when inoculum size is 1.5%, but since then it reduces with the increasing of inoculum size; besides, finished products of amino acid nitrogen content is maximum when the fermentation temperature is 35℃, it also decreases with increasing temperature. Figure 2 shows that amino acid nitrogen content is in a lower value and has no significant variation when the starter making time is 24-48h; it increases significantly when the starter making time is 48-72h, and it is maximum when the starter making time is 72h; no significant variation was observed of amino acid nitrogen content when the stater making time is 72-96h and it slightly decreases.
Synthesizing figure2 and figure 3, fermentation temperature 35℃, starter making time 72h and inoculum size 1.5% should be selected for orthogonal test.
2.2.2 Orthogonal Test Results
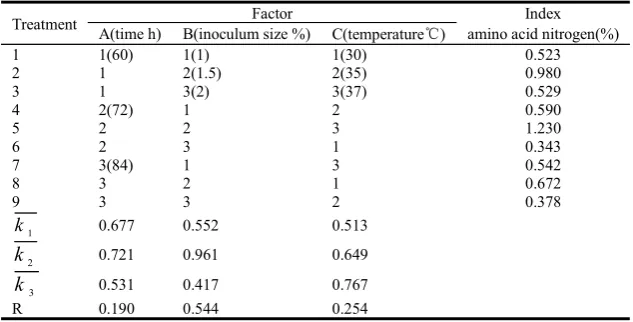
Table 4 Results of L9(34) orthogonal test and range analysis
Treatment A(time h) B(inoculum size %)Factor Index C(temperature℃) amino acid nitrogen(%)
1 1(60) 1(1) 1(30) 0.523
2 1 2(1.5) 2(35) 0.980
3 1 3(2) 3(37) 0.529
4 2(72) 1 2 0.590
5 2 2 3 1.230
6 2 3 1 0.343
7 3(84) 1 3 0.542
8 3 2 1 0.672
9 3 3 2 0.378
1
k 0.677 0.552 0.513
2
k 0.721 0.961 0.649
3
k 0.531 0.417 0.767
R 0.190 0.544 0.254
Table 4 indicates that the order of affecting factors was B>C>A, means inoculum size> temperature> starter making time. Direct analysis shows the optimal combination is A2B2C, which is inoculum size 1.5%, fermentation
temperature 35℃, and starter making time 72h.
Table 5 Analysis of variance
Factors Type III Sum of Squares df Mean Square F Sig. Starter making
time
0.060 2 0.030 2.798 0.263
Inoculum size 0.481 2 0.241 22.587 0.042 Temperature 0.097 2 0.049 4.561 0.180
Table 5 ANOVA shows that inoculum size has significant effect on amino acid nitrogen content, while starter making time and fermentation have non-significant on it.
Through validating optimal combination of orthogonal test, amino acid nitrogen content of finished product has averaged 1.271g/100g, which exceeds amino acid nitrogen content got according to the orthogonal experimental conditions. Therefore, the best fermentation condition of mixed bacteria is inoculum size of mixed bacteria 1.5%(QY2b: Bacillus subtilis: Rhizopus oryzae: Aspergillus oryzae=1:0.8:2:1.3), fermentation temperature 37℃, starter making time 72h and the dosage of salt 15%.
2.3 Determination of Products
Products were fermented in the optimum condition of QY2b and multi-strains. During 20d’s after-fermentation, the testing result of physical and chemical indicators and volatile flavor compounds shows in Tab.6 and Tab.7.
As Tab.6 shows that the content of reducing sugar and amino acid nitrogen in multi-strains fermented product are 22.18% and 82.61% higher than those in QY2b fermented product. The content of total acid, salt and aflatoxin B1
[image:5.595.124.490.603.672.2]measure up to the hygienic standard of fermented soybean products.
Table 6 The determination results of physical and chemical indicators
Items Testing results
QY2b fermented product Multi-strains fermented products Acid(according to lactic acid, g/100g) 0.87 0.85
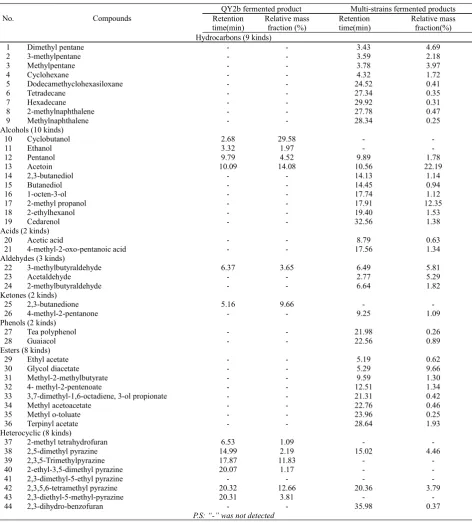
Table 7 Comparison of volatile components
No. Compounds
QY2b fermented product Multi-strains fermented products Retention time(min) Relative mass fraction (%) Retention time(min) Relative mass fraction(%) Hydrocarbons (9 kinds)
1 Dimethyl pentane - - 3.43 4.69
2 3-methylpentane - - 3.59 2.18
3 Methylpentane - - 3.78 3.97
4 Cyclohexane - - 4.32 1.72
5 Dodecamethyclohexasiloxane - - 24.52 0.41
6 Tetradecane - - 27.34 0.35
7 Hexadecane - - 29.92 0.31
8 2-methylnaphthalene - - 27.78 0.47
9 Methylnaphthalene - - 28.34 0.25
Alcohols (10 kinds)
10 Cyclobutanol 2.68 29.58 -
-11 Ethanol 3.32 1.97 -
-12 Pentanol 9.79 4.52 9.89 1.78
13 Acetoin 10.09 14.08 10.56 22.19
14 2,3-butanediol - - 14.13 1.14
15 Butanediol - - 14.45 0.94
16 1-octen-3-ol - - 17.74 1.12
17 2-methyl propanol - - 17.91 12.35
18 2-ethylhexanol - - 19.40 1.53
19 Cedarenol - - 32.56 1.38
Acids (2 kinds)
20 Acetic acid - - 8.79 0.63
21 4-methyl-2-oxo-pentanoic acid - - 17.56 1.34
Aldehydes (3 kinds)
22 3-methylbutyraldehyde 6.37 3.65 6.49 5.81
23 Acetaldehyde - - 2.77 5.29
24 2-methylbutyraldehyde - - 6.64 1.82
Ketones (2 kinds)
25 2,3-butanedione 5.16 9.66 -
-26 4-methyl-2-pentanone - - 9.25 1.09
Phenols (2 kinds)
27 Tea polyphenol - - 21.98 0.26
28 Guaiacol - - 22.56 0.89
Esters (8 kinds)
29 Ethyl acetate - - 5.19 0.62
30 Glycol diacetate - - 5.29 9.66
31 Methyl-2-methylbutyrate - - 9.59 1.30
32 4- methyl-2-pentenoate - - 12.51 1.34
33 3,7-dimethyl-1,6-octadiene, 3-ol propionate - - 21.31 0.42
34 Methyl acetoacetate - - 22.76 0.46
35 Methyl o-toluate - - 23.96 0.25
36 Terpinyl acetate - - 28.64 1.93
Heterocyclic (8 kinds)
37 2-methyl tetrahydrofuran 6.53 1.09 -
-38 2,5-dimethyl pyrazine 14.99 2.19 15.02 4.46
39 2,3,5-Trimethylpyrazine 17.87 11.83 -
-40 2-ethyl-3,5-dimethyl pyrazine 20.07 1.17 -
-41 2,3-dimethyl-5-ethyl pyrazine - - -
-42 2,3,5,6-tetramethyl pyrazine 20.32 12.66 20.36 3.79
43 2,3-diethyl-5-methyl-pyrazine 20.31 3.81 -
-44 2,3-dihydro-benzofuran - - 35.98 0.37
P.S: “-” was not detected
As Table.7 shows that 4 alcohols, an aldehyde, a ketone and 6 heterocyclic were tested in QY2b fermented product. 9 hydrocarbons, 8 alcohols, 2 acids, 3 aldehydes, a ketone, 2 phenols, 8 esters and 3 heterocyclic were tested in multi-strains fermented product.
CONCLUSION
3.1 Temperature of 37℃, time of 72h, mold ratio (QY2b to Bacillus subtilis to Rhizopus oryzae to Aspergillus oryzae) of 1:0.8:2:1.3, mold additive rate of 1.5%, after fermentation of 20d are the optimum conditions of multi-strains fermented douchi.
3.2 The content of reducing sugar and amino acid nitrogen in multi-strains fermented product are 22.18% and 82.61% higher than those in QY2b fermented product. The total amount of volatile components detected in mixed douchi is 98.49%, of which relative contents of alcohols, esters, hydrocarbons, aldehydes, heterocyclic compounds, acids, phenols, ketones were 42.43%, 15.97%, 14.34%, 12.93%, 8.62%, 1.96%, 1.14% and 1.09%, respectively. Total detectable amount of QY2b pure fermentation was 96.73%, including alcohols, heterocyclic hydrocarbons, ketones, aldehydes and the contents were 50.15%, 32.75%, 9.66% and 3.65%, respectively. Compared with QY2b pure fermentation compounds, volatile flavor compounds in mixed bacteria fermentation increased four categories 21 kinds.
REFERENCES
[1] Dai Li-jiao, Song Jun-mei, Qu Jing-ran.Food science and technology,2007,(6):54-56. [2] Fujita H, Yamagami T, Ohshima K.Journal of Nutrition Biochemistry,2001; 12(6):351-356. [3] Wang Yan-jie, Su Qing-hui, Li Zhi-jiang, et al.Food and machinery,2006,(6):130-132.
[4] Peng Yun, Yang Fu-min, Kang Hong-xia. [J].Food and fermentation industries,2013,(4):58-63. [5] Qu Zhi, Jiang Ai-min, Wu Lan-fang, et al.Food and machinery,2012, 28(5):22-25.
[6] Mu Guangqing, Li Hui, Li Xia, et al. Journal of Chinese institute of food science and technology, 2009,(6):90-95.
[7] Chen Qing-chan, Xu Yong-xia, Wu Peng, et al.Food science,2009, 30(20):327-330. [8] Perez, Marlen.Alimentaria,2003,40(6): 129-132.
[9] Sarkar PK, Hasenack B, Nout MJR.Int J Food Microbiol,2002,77(3):175-186.