International Journal of Emerging Technology and Advanced Engineering
Website: www.ijetae.com (ISSN 2250-2459, Volume 2, Issue 11, November 2012)640
Fatigue Analysis of High Performance Cement Concrete for
Pavements using the Probabilistic Approach
Suresh Kumar K.S.
1, Kamalakara G.K.
2, Sagar Kamble
3, Amarnath M.S.
4 1Research Scholar, Department of Civil Engineering, Bangalore University, Bangalore, India.2M.E.Student, Department of Civil Engineering, Bangalore University, India
3Assistant Professor,Govt.Engineering College Karwar,Karnataka,India 4Professor Highway Engineering, Bangalore University, India
Abstract— Cement concrete pavements are designed for
flexural fatigue loading due to traffic. Due to its numerous advantages high performance cement concrete is finding it’s way in pavement construction. This paper investigates the fatigue strength of High Performance Cement Concretes subjected to flexural loading. Fatigue studies are conducted on these concretes to obtain the fatigue lives at various stress levels. Static flexural strength tests are conducted to determine the static failure loads on prism specimen. From the experimental studies carried out, the number of load repetitions to failure on the concretes under study is determined for three stress ratios. From the data obtained S-N curves are developed using linear regression models considering log normal distribution as is being presently adopted. Recent literature shows that weibull distribution is found to have more convincing physical features than the lognormal distribution to describe the fatigue behavior of concrete. To incorporate the probability of failure, weibull distribution is considered and Pf-S-N diagram are developed.
It is observed that addition of fly ash and silica fume improves the fatigue performance of concrete by48% and 83% at a stress level of 0.75.
Keywords— Fatigue, Flexure, High Performance Cement
Concrete, Rigid Pavement, Statistical Distributions
I. INTRODUCTION
Fatigue is the failure of a component as a result of cyclic stress. The failure occurs in three phases: crack initiation, crack propagation, and failure. The duration of each of these three phases depends on many factors including fundamental raw material characteristics, magnitude and orientation of applied stresses, processing history, etc.[1] Fatigue failures often result from the magnitude of applied stress significantly below those necessary to cause static failure. In recent years high performance cement concrete is being used in the construction of rigid pavements. As rigid pavements are designed for fatigue, considerable interest is shown in the fatigue strength of pavements. Hence, the study of the effects of repeated loads on high performance concrete pavements are to be studied in particular.
ACI 215R-74 [2] defines Fatigue as ―a process of progressive permanent internal structural change in a material subjected to repetitive stresses‖. These changes may be damaging and result in progressive growth of cracks due to repeated application of traffic loads, progressive fatigue damage takes place in the cement concrete slab in the form of gradual development of micro cracks and complete fracture if the stress repetitions are sufficiently large.
A. Research Significance
Very little literature has been reported on research which addresses the behavior of high performance cement concrete under flexural fatigue loading. The present investigations are conducted on High Volume Fly Ash Concrete (HVFAC), Silica Fume Concrete (SFC) and Pavement Quality Concrete (PQC).
Log normal distribution is generally considered for developing S-N curves to determine the number of repetitions to failure under fatigue loading. Since most of the fatigue studies on concrete have mainly focused on simple S-N relationships, little attention has been paid to probabilistic reliability analysis for concrete fatigue. In this study Weibull distribution is considered to impart probabilistic reliability against fatigue failure. An effort is made to develop relationships between stress level, fatigue life and probability of failure.
II. MIX PROPORTIONS AND STRENGTHS OF HPC
International Journal of Emerging Technology and Advanced Engineering
Website: www.ijetae.com (ISSN 2250-2459, Volume 2, Issue 11, November 2012)641 Prisms of size 100 mm x 100 mm x 500 mm are cast and static flexural strength tests conducted to determine the static failure loads on the specimen. Compressive and Flexural strengths obtained are shown in Table 1.
TABLEI
MIXPROPORTIONSANDSTRENGTHOFHPCS
Mix PQC HVFAC SFC
Water / binder ratio 0.39 0.39 0.46
Cement kg/m3 405 208.5 370
Fly ash kg/m3 0 208.5 0
Silica fume 0 0 32.17
Super Plasticiser % 0 1.25 0.3 Fine aggregate kg/m3 750 565 814.35 Coarse aggregate type-I kg/m3 720 786 676.36 Coarse aggregate type-II
kg/m3 355 387.00 332.64
Water kg/m3 150 162.53 170.2
Compressive Strength (MPa) 48.23 48.82 49.48 Static Flexural Strength (MPa) 4.76 4.93 5.75
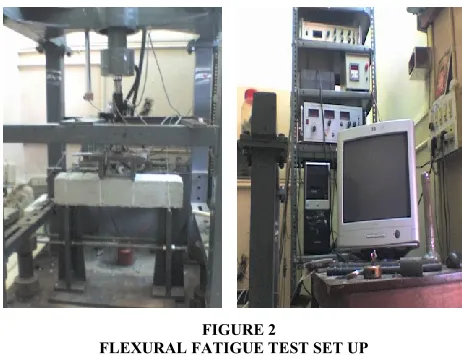
[image:2.612.327.558.189.367.2]Prism specimen are loaded and tested in accordance with ASTM Test Method C 78. The third point loading method with forces applied perpendicular to the beam without eccentricity is adopted. Accelerated cyclic fatigue testing equipment is used to conduct flexural fatigue test. The schematic diagram of the test arrangement is showed in Figure 1 and a snap shot of the test set up is shown in Figure 2. To simulate realistic traffic loading half sine wave form loading with a frequency of two cycles per second is applied repetitively on the specimen.
FIGURE 1
FLEXURAL FATIGUE TEST ARRANGEMENT
From the experimental studies carried out, the number of repetitions to failure is determined for three stress levels 0.65, 0.70 and 0.75 for PQC and HVFAC and 0.65, 0.75 and 0.85 for SFC.
FIGURE 2
FLEXURAL FATIGUE TEST SET UP
III. ANALYSIS OF FATIGUE TEST DATA
[image:2.612.43.297.208.378.2]From the fatigue test data obtained for the three concretes under investigation S-N curves are developed using linear regression models, considering log normal distribution. The linear regression model is of the form (y = ax + c) in which stress ratio (S) is taken on Y-axis and Log (N) values are taken on the X-axis. The scatter diagram of the test results for PQC, HVFAC and SFC are shown in Figure 3. The linear relationship obtained from the trend lines for PQC, HVFAC and SFC along with the R2 values are shown in equations 1, 2 &3.
[image:2.612.56.275.507.661.2] [image:2.612.333.567.513.677.2]International Journal of Emerging Technology and Advanced Engineering
Website: www.ijetae.com (ISSN 2250-2459, Volume 2, Issue 11, November 2012)642
PQC ....1
R
2 = 0.638HVFAC ….2
R2 = 0.718SFC ....3 R2 = 0.317
A Comparison of Fatigue Life Values
The developed linear regression models are compared with the fatigue model given in IRC: 58- 2011 [3]. The model suggested by IRC 58 – 2011 is shown in equation 4. IRC – 58 2011 - Guidelines for the design of plain jointed rigid pavements for highways is the procedure that is presently being used in India for the design of rigid pavements.
IRC 58 ….4
The values of fatigue life at different stress ratios from the developed fatigue models are compared with those given in IRC 58: 2011 and shown in Table 2. Figure 4 shows the S-N curves developed using results from the present investigations. The percentage increase in fatigue life in PQC, HVFAC and SFC are compared with the IRC values and are shown in Table 3
It is observed that at 65% stress level, increase in number of repetition to failure is 27% in HVFAC, 38% in PQC and 42% in SFC when compared to IRC values. The number of load repetitions to failure in SFC is the highest. It is also observed that the percentage increase in fatigue life is higher at higher stress ratios in SFC and HVFAC..
TABLE 2
COMPARISON OF FATIGUE LIVES
Stress Ratio ‘SR’
Number of repetitions to failure ‘N’ I R C 58 HVFAC PQC SFC 0.55 1.24x10⁵ 2.38x10⁵ 8.39x10⁵ 1.23x10⁷
0.6 3.09x10⁴ 4.48x10⁵ 1.39x10⁶ 2.02x10⁶ 0.65 7.7x10³ 8.47x10³ 2.31x10⁵ 3.32x10⁵ 0.7 1.97x10³ 1.6x10⁴ 3.8x10⁴ 5.45x10⁴ 0.75 477 3.0x10³ 6.4x10³ 8.93x10³
0.8 119 568 1054 1466
0.85 30 107 174 240
FIGURE 4
COMPARISON OF S – N CURVES
TABLE 3
Stress Ratio
Percentage increase in fatigue life compared to IRC 58
HVFAC PQC SFC
0.55 25 36 39
0.65 27 38 42
0.75 29 42 48
0.85 37 52 61
B Probability Analysis
International Journal of Emerging Technology and Advanced Engineering
Website: www.ijetae.com (ISSN 2250-2459, Volume 2, Issue 11, November 2012)643 The verification of this distribution is attempted and the parameters of the distribution are determined from the experimental data at different fatigue stress levels. The methods, generally adopted to estimate the distribution parameters are graphical method, method of moments and method of maximum likelihood. In this study the graphical method is used and the values of the two parameters ‗α‘ and ‗u‘ from weibull distribution are calculated.
Where ‗α‘ = Shape parameter and ‗u‘ = characteristic extreme value
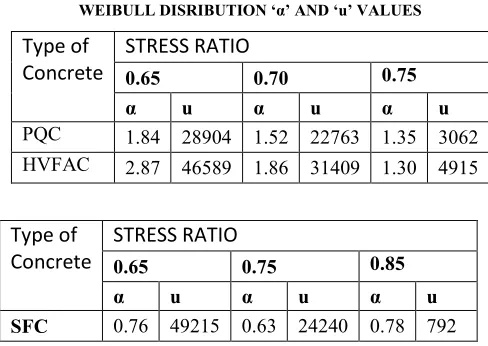
[image:4.612.43.287.297.470.2]The two parameters of weibull distribution is shown in Table 4
TABLE 4.
WEIBULL DISRIBUTION ‘α’ AND ‘u’ VALUES
Type of
Concrete
STRESS RATIO
0.65 0.70 0.75
α u α u α u
PQC 1.84 28904 1.52 22763 1.35 3062 HVFAC 2.87 46589 1.86 31409 1.30 4915
Type of
Concrete
STRESS RATIO
0.65 0.75 0.85
α u α u α u
SFC 0.76 49215 0.63 24240 0.78 792
The number of repetitions to failure as obtained by weibull distribution is shown in Table 5
TABLE 5
N VALUES FROM WEIBULL DISTRIBUTION
Stress ratio Number of repetitions to failure
HVFAC PQC SFC
0.85 426 214 1000
0.75 5660 3205 12915
0.65 75232 48123 166810 0.55 1000000 722476 2154435
The Weibull distribution has been employed here to incorporate the failure probability into the S-N relationships of PQC, HVFAC and SFC. As the fatigue-life data of PQC, HVFAC and SFC has been shown to follow the two parameter Weibull distribution, it can be used to calculate the fatigue lives corresponding to different failure probabilities.
Using the values of Weibull distribution parameters α and u, equation 5 can be used to calculate fatigue lives of PQC, HVFAC and SFC corresponding to different failure probabilities (i.e., Pf = 0.05, 0.10, 0.20, 0.30, 0.40, 0.50). The fatigue lives thus obtained are listed in Tables 6 to 8.
...5 Where,
α = Shape parameter
u = characteristic extreme value Pf=failure probability
N=fatigue lives
TABLE 6
FATIGUE LIVES AT DIFFERENT PROBABILITIES OF FAILURE
Probability of failure
PQC
S=0.65 S=0.70 S=0.75
0.05 5753 3225 339
0.10 8508 5179 578
0.20 12792 8485 1008 0.30 16505 11552 1427 0.40 20064 14632 1862 0.50 23684 17886 2334
TABLE 7
FATIGUE LIVES AT DIFFERENT PROBABILITIES OF FAILURE
Probability of failure
HVFAC S=0.65 S=0.70 S=0.75
0.05 16551 6361 500
0.10 21269 9367 870
International Journal of Emerging Technology and Advanced Engineering
Website: www.ijetae.com (ISSN 2250-2459, Volume 2, Issue 11, November 2012)644 TABLE 8
FATIGUE LIVES AT DIFFERENT PROBABILITIES OF FAILURE
Probability of failure
SFC
S=0.65 S=0.75 S=0.85
0.05 16316 3174 18
0.10 24917 5195 45
0.20 38745 8683 116 0.30 51054 11970 212 0.40 63066 15306 335 0.50 75468 18862 496 From linear regression model developed it is observed that number of repetitions to failure for SFC is higher than PQC and HVFAC values. By incorporating the probabilistic failure models the number of repetitions to failure for a desired reliability can be obtained.
IV. CONCLUSIONS
1.The model developed in this study can be used for estimating the cumulative fatigue life while designing high performance cement concrete pavements.
2.As the number of repetitions to failure in SFC is more when compared to PQC and HVFAC, it can be advantageously in the construction of high traffic corridors.
3. The Pf -S-N diagrams can be used to obtain the flexural fatigue strength of PQC, HVFAC and SFC for the desired reliability levels.
4. Adopting reliability analysis in the design of pavement for arriving at probability of fatigue failure is a better option as it is more conservative when compared to linear regression model.
REFERENCES
[1] Payman Ameen & Mikael Szymanski, 2006. ―Fatigue in Plain Concrete, Phenomenon and Methods of Analysis‖, Chalmers University, Goteborg, Sweden,
[2] ACI 215R 74, 1997 Considerations for Design of Concrete Structures Subjected to Fatigue Loading.
[3] IRC 58 2011, Guidelines for the design of plain jointed rigid pavements for highways.