MECHANICAL PROPERTIES OF CERAMICS TILES BY REPLACEMENT OF QUARTZ BY RHA AND POFA
HASSAN USMAN JAMO
A thesis submitted in partial
fulfilment of the requirements for the award of the Doctor of Philosophy in Science
Faculty of Science, Technology and Human Development Universiti Tun Hussein Onn Malaysia
ix
ABSTRACT
ABSTRAK
xi
AK
BLE OF CONTENT
TABLE OF CONTENT
SUPERVISOR’S DECLARATION ii
TITLE iii
STUDENT’S DECLARATION iv
DEDICATION v
ACKONOWLEDGEMENT vi
ABSTRACT viii
ABSRAK ix
TABLE OF CONTENT x
LIST OF FIGURES xvi
LIST OF TABLES xxvii
LIST OFABBREVIATIONS xxix
CHAPTER 1 INTRODUCTION 1
1.1 Background of the study 1
1.2 Problem statement 3
1.3 Objectives of the study 5
1.4 Scope of the study 5
CHAPTER 2 LITERATURE REVIEW 7
2.1 Introduction on porcelain ceramic tile 7
2.1.1 Raw materials of porcelain 7
2.1.2 Strength consideration 9
2.1.3 Sinteing of porcelain 10
2.1.4 Sintering stages 12
2.2 Characterisation 27
2.2.1 X-ray diffraction 27
2.2.2 Microstructure observation 32
2.3.1 Shrinkage 37
2.3.2 Percentage of porosity 42
2.3.3 Bulk density 45
2.4 Mechanical properties 50
2.4.1 Bending strength 50
2.4.2 Vickers hardness 55
2.4.3 Compressive strength 57
2.5 Rice husk ash (RHA) 59
2.5.1 High silica content with amorphous
characteristics 59
2.5.2 Disposal problems 60
2.6 Origin of palm oil 61
2.6.1 Palm oil fuel ash (POFA) 62
2.6.2 Environmental issues 64
2.6.3 Summary 65
CHAPTER 3 RESEARCH METHODOLOGY 66
3.1 Introduction 66
3.2 Research Design 68
3.2.1 Effects of substitution of quartz by RHA 68 3.2.2 Effects of substitution of quartz by POFA 68 3.2.3 Effects of substitution of quartz by the
combination of RHA and POFA 69
3.3 Experimental design variables 69
3.3.1 Experimental parameters 69
3.4 Preparation of raw materials 78
3.4.1 RHA 78
3.4.2 POFA 79
3.5 Sample preparation 79
3.5.1 Sample composition 79
3.5.2 Mixing 80
3.5.3 Dry pressing 80
3.5.4 Drying 81
xiii
3.6 Physical measurement 81
3.6.1 Volume shrinkage 81
3.6.2 Porosity and bulk density 82
3.7 X-ray Fluorescence characterisation measurement 83 3.7.1 X-ray diffraction (XRD) measurement 83
3.8 Scanning electron microscopy (SEM) 84
3.9 Mechanical measurement 84
3.9.1 Vickers hardness 84
3.9.2 Bending strength 85
3.9.3 Compressive strength 86
3.10 Particle size analysis 87
The powder was diluted using water, the solution was plced into the machine, the machine stirred the solution for 5
to 7 minutes in a chamber having two lasers. With the help of a formula built in the machine the sizes of the
particles were analysed 87
3.11 Etching 87
CHAPTER 4 RESULTS AND DISCUSSIONS 88
4.1 Introduction 88
4.2 Analysis of raw materials 88
4.2.1 X-ray fluorescence (XRF) measurement 88 4.2.2 X- ray diffraction (XRD) analysis 89
4.2.3 Particle size analysis 91
4.2.3.1 Porcelain raw material 91
4.2.3.2 RHA 91
4.2.3.3 POFA 91
4.2.4 Scanning electron microscopy (SEM) 95
4.3 Phase I: Study of RHA 96
4.3.1 Effects of sintering temperature, mould
pressure and soaking on volume shrinkage 96 4.3.2 Effects of sintering temperature, mould
pressure and soaking time on percentage
4.3.3 Effects of sintering temperature, mould
pressure and soaking time on bulk density 103 4.3.4 Effects of RHA, sintering temperature, mould
pressure and soaking time on Vickers hardness 106 4.3.5 Effects of sintering temperature, mould
pressure and soaking time on bending strength 109 4.3.6 Effects of sintering temperature, mould
pressure and soaking time on compressive
strength 112
4.3.7 Effects of sintering temperature, mould
pressure and soaking time on XRD 116 4.3.8 Effects of sintering temperature, mould
pressure and soaking time on microstructure 119
4.3.9 Summary 122
4.4 Phase II Study of POFA, sintering temperature, mould
pressure and soaking 123
4.4.1 Effects of sintering temperature, mould pressure and soaking time on volume
shrinkage 123
4.4.2 Effects of sintering temperature, mould pressure and soaking time on percentage of
porosity 125
4.4.3 Effects of sintering temperature and soaking
time on bulk density 128
4.4.4 Effects of sintering temperature and soaking
time on Vickers hardness 132
4.4.5 Effects of sintering temperature and soaking
time on bending strength 135
4.4.6 Effects of sintering temperature and soaking
time on compressive strength 139
4.4.7 Effects of sintering temperature and soaking
time on XRD 142
4.4.8 Effects of sintering temperature and soaking
xv
4.4.9 Summary 148
4.5 Phase III: Study of RHA and POFA 150
4.5.1 Effects of sintering temperature and soaking
time on volume shrinkage 150
4.5.2 Effects of sintering temperature and soaking
time on percentage of porosity 152
4.5.3 Effects of sintering temperature and soaking
time on bulk density 155
4.5.4 Effects of sintering temperature and soaking
time on Vickers hardness 158
4.5.5 Effects of sintering temperature and soaking
time on bending strength 161
4.5.6 Effects of sintering temperature and soaking
time on compressive strength 164
4.5.7 Effects of sintering temperature and soaking
time on XRD 167
4.5.8 Effects of sintering temperature and soaking
time on microstructure 171
4.5.9 Summary 173
4.5.10 Relationship between percentage of porosity
and compressive strength 174
4.5.11 Discussion on comparison between samples containing RHA, POFA and the combination
of RHA and POFA 177
CHAPTER 5 CONCLUSION AND RECOMMENDATIONS 181
5.1 Conclusion 181
5.2 Recommendation 183
FRES
LIST OF FIGURES
Figure 2.1: Stages of sintering (a) free particles, (b) necking between particles, (c) formation of grain boundary, and (d) densification process and pores elimination (Randal, 1991) 13 Figure 2.2: XRD curves of fired body mixes (Prasad et al., 2001) 28 Figure 2.3: XRD results of porcelains, sintered at 1350 οC and 1400 οC.
(Karamanov et al., 2006) 29
Figure 2.4: X-ray diffraction patterns of POFA20 tile and sintered at
different temperatures (Tonnayopas et al., 2009) 30 Figure 2.5: X-ray diffraction patterns: (a) 20G, 1150 οC; (b) 15G, 1200 οC;
(c) 20F10G, 1200 οC; and (d) 25 F5G, 1220 οC (Luz and
Ribeiro, 2007) 31
Figure 2.6: X-ray diffractogram of the fired porcelain body at different
mould pressure (MP) (Pérez et al., 2012) 32
Figure:. 2.7 SEM images of the pellets after (a) 1000°C, (b) 1100°C, (c)
1200°C, (d)1300°C, (e) 1400°C 33
Figure 2.8: Backscatered image of the fractured surfaces of POFA-GFQW
tiles (Tonnayopas et al., 2009) 34
Figure 2.9: SEM of light weight porcelain stoneware Garcia-Ten et al.,
(2012) 35
Figure 2.10: SEM observations on polished surfaces of the porcelain
stoneware (Martín-Márquez et al., 2010a) 36
Figure 2.11: SEM micrographs on polished surfaces of the porcelain stoneware at different mould pressures: 10 MPa (b) 20 MPa,
xvii Figure 2.12: Effect of RHA+SF on the fired shrinkage of body mixes fired at
different test temperature (Prasad et al., 2003) 38 Figure 2.13: Linear shrinkage % of the understudied compositions as
function of maximum firing temperature (Leonelli et al., 2001) 39 Figure 2.14: Linear shrinkage as function of temperature (Martín-Márquez
et al., 2008) 40
Figure 2.15: Linear shrinkage as a function of the firing temperatures for
the tested samples (Tucci et al., 2007) 40
Figure 2.16: Firing shrinkage as function of firing temperature (de‘Gennaro
et al., 2003) 41
Figure 2.17: Dilatometric sintering curves of C0 (standard sample) and C1 (sample with cathode ray TV) compositions (de‘Gennaro et al.,
2003) 42
Figure 2.18: Influence of firing temperature on porosity and irreversible
stain retention (evaluated as E) for samples obtained from the
as-received industrial powder (Sanchez et al. 2001). 43 Figure 2.19: Total porosity (PT), closed porosity (PC), and open porosity
(PO) porosities behaviour vs. temperature for laboratory fired
standard sample (C0). (Andreola et al. 2008) 43 Figure 2.20: The variations of total porosity as function of soaking time for
STD milled at 8 h and sintered at three different temperatures.
(Salem et al., 2010) 44
Figure 2.21: Apparent porosity as a function of temperature (Dana et al.,
2004). 45
Figure 2.22: Bulk densities of porcelain compositions (Kamseu et al., 2007) 46 Figure 2.23: Bulk density versus oil palm fuel ash POFA content
(Tonnayopas et al., 2009) 46
Figure 2.24: Absolute and bulk densities of green tiles at different MP
(Pérez et al., 2011) 47
Figure 2.25: Variation in bulk density of C1 and C2 bodies with heating
temperature (Das and Dana, 2003) 48
Figure 2.26: Bulk density versus the sintering temperature. NC: Samples without calcinations, C: calcined samples (Kitouni and Harabi,
Figure 2.27: Effect of MP and firing temperature on the maximum density
(Youssef and Ghazal, 2011) 49
Figure 2.28: Bending strength of porcelain compositions (Kamseu et al.,
2007) 50
Figure 2.29: Effect of RHA on the fired M.O.R. of body mixes fired at
different test temperatures. (Prasad et al., 2001) 51 Figure 2.30: Bending strength of porcelain compositions (Kamseu et al.,
2007) 52
Figure 2.31: Bending strength versus oil palm fuel ash (OPFA) content
(Tonnayopas et al., 2009) 53
Figure 2.32: Flexural strength and tensile and versus sintering temperature
for calcined porcelain samples (Kitouni and Harabi, 2011) 54 Figure 2.33: Effect of temperature and soaking time on the MOR of
samples (Youssef and Ghazal, 2011) 54
Figure 2.34: Vickers hardness versus POFA content (Tonnayopas et al.,
2009) 55
Figure 2.35: Effect of MP and soaking time on Rockwell Hardness for
samples fired at 1250 οC (Youssef and Ghazal, 2011) 56 Figure 2.36: Variation of Vickers hardness with Weight % RHA (Prasad
and Krishna, 2011) 56
Figure 2.37: Vickers hardness versus RHA content (Fadzil et al., 2008) 57 Figure 2.38: Effect of firing temperature and soaking time on the cold
crushing strength of samples (Youssef and Ghazal, 2011) 58 Figure 2.39: Dry compressive strength of fired briquettes as a function of
OBM content as well as firing temperatures (El-mahllawy and
Osman, 2010) 58
Figure 2.40: Map of the largest palm oil producing countries in the world
(Zuur, 2004) 61
Figure 33.1: Overall flow Chart for the experiment 67 Figure 4.1: The XRD patterns of raw materials (where c = cristobalite, cc =
calcite, k = kaolin, m = mullite, mu = muscovite, p =
portlandite, q = quartz) 90
xix Figure 4.4: Result of particle size analysis of POFA 94 Figure 4.5: Surface morphology of (a) RHA (b) POFA (c) ceramic
(porcelain) raw material. Phase 1: Substitution of quartz by
RHA 95
Figure 4.6: Effect of temperature on shrinkage of the samples with different percentage of RHA (mould pressure =91 MPa,
soaking time =2 hours) 99
Figure 4.7: Effect of mould pressure on shrinkage of the samples with different percentage of RHA (temperature =1200 οC, soaking
time =2 hours) 99
Figure 4.8: Effect of soaking time shrinkage of the samples with different percentage of RHA (temperature =1200 οC, mould pressure =
91 MPa) 99
Figure 4.9: Effect of temperature on percentage of porosity of the samples with different percentage of RHA (mould pressure =91 MPa,
soaking time =2 hours) 101
Figure 4.10: Effect of mould pressure on percentage of porosity the samples of sample with different percentage of RHA (temperature
=1200 οC, soaking time =2 hours) 101
Figure 4.11: Effect of soaking time on percentage of porosity of the samples with different percentage of RHA (temperature =1200 οC,
mould pressure = 91 MPa) 101
Figure 4.12: Effect of temperature on bulk density of the samples with different percentage of RHA (mould pressure =91 MPa,
soaking time =2 hours) 104
Figure 4.13: Effect of mould pressure on bulk density of the samples with different percentage of RHA (temperature =1200 οC, soaking
time =2 hours) 104
Figure 4.14: Effect of soaking time on bulk density of body mixes with different percentage of RHA (temperature =1200 οC, mould
pressure = 91 MPa) 104
Figure 4.15: Effect of temperature on Vickers micro-hardness of sample with different percentage of RHA (mould pressure =91 MPa,
Figure 4.16: Effect of mould pressure on hardness of the samples with different percentage of RHA (temperature =1200 οC, soaking
time =2 hours) 108
Figure 4.17: Effect of soaking time on Vickers hardness of the samples with percentage of RHA (temperature =1200 οC, mould pressure =
91 MPa) 108
Figure 4.18: Effect of temperature on bending strength of the samples with different percentage of RHA (mould pressure =91 MPa,
soaking time =2 hours) 111
Figure 4.19: Effect of mould pressure on bending strength of the samples with different percentage of RHA (temperature =1200 οC,
soaking time =2 hours) 111
Figure 4.20: Effect of soaking time on bending strength of the samples with different percentage of RHA (temperature =1200 οC, mould
pressure = 91 MPa) 111
Figure 4.21: Effect of temperature on compressive strength of the samples with different percentage of RHA (mould pressure =91 MPa,
soaking time =2 hours) 114
Figure 4.22: Effect of mould pressure on compressive strength of the samples with different percentage RHA (temperature =1200 ο
C, soaking time =2 hours) 114
Figure 4.23: Effect of soaking time compressive strength of the samples with different percentage of RHA (temperature =1200 οC,
mould pressure = 91 MPa) 114
Figure 4.24: The XRD curves of the samples containing 20 wt% of RHA sintered at different temperatures (mould pressure =91 MPa,
soaking time =2 hours) 116
Figure 4.25: The XRD curves of sintered sample containing 20 wt% RHA pressed at different mould pressure (temperature =1200 οC,
soaking time =2 hours) 117
Figure 4.26: The XRD curves of the samples containing 20 wt% RHA sintered at different soaking times (temperature =1200 οC,
xxi Figure 4.27: The SEM of the samples containing 20 wt% of RHA sintered
at different temperatures of (a) 1000 оC (b) 1100 оC (c) 1200 о
C (d) 1300 оC. All micrograph were taken with1000X magnification (mould pressure =91 MPa, soaking time =2
hours) 119
Figure 4.28: SEM of the samples sintered containing 20 wt% RHA pressed at mould pressure of (a) 31 MPa (b) 61 MPa (c) 91 MPa (d) 121MPa: All micrographs were taken with1000X
magnification 120
Figure 4.29: SEM of the samples sintered containing 20 wt% RHA sintered at a soaking time of (a) 1 Hour (b) 2 Hours (c) 3 Hours. All micrograph were taken with 1000X magnification (temperature
=1200 οC, mould pressure = 91 MPa) 121
Figure 4.30: Effect of temperature on shrinkage of the samples with different percentage of POFA (mould pressure =91 MPa,
soaking time =2 hours) 124
Figure 4.31: Effect of mould pressure on shrinkage of the samples with different percentage of POFA (temperature =1100 οC, soaking
time =2 hours) 124
Figure 4.32: Effect of soaking time of shrinkage of body mixes with different percentage of POFA (temperature =1100 οC, mould
pressure = 91 MPa) 124
Figure 4.33: Effect of temperature on percentage of porosity of the samples with different percentage of POFA wt% (mould pressure =91
MPa, soaking time =2 hours) 127
Figure 4.34: Effect of mould pressure on percentage of the samples of sample with different percentage of POFA (temperature =1100 ο
C, soaking time =2 hours) 127
Figure 4.35: Effect of soaking time of percentage of porosity of the samples with different percentage of POFA (temperature =1100 οC,
mould pressure = 91 MPa) 127
Figure 4.36: Effect of temperature on bulk density of the samples with different percentage of POFA (mould pressure =91 MPa,
Figure 4.37: Effect of mould pressure on bulk density of the samples with different percentage of POFA (temperature =1100 οC, soaking
time =2 hours) 130
Figure 4.38: Effect of soaking time on bulk density of the samples with different percentage of POFA (temperature =1100 οC, mould
pressure = 91 MPa) 130
Figure 4.39: Effect of temperature on Vickers hardness of the samples with different percentage of POFA (mould pressure =91 MPa,
soaking time =2 hours) 134
Figure 4.40: Effect of mould pressure on Vickers hardness of the samples with different percentage of RHA (temperature =1100 οC,
soaking time =2 hours) 134
Figure 4.41: Effect of soaking time on Vickers hardness of the the samples with different percentage of POFA (temperature =1100 οC,
mould pressure = 91 MPa) 134
Figure 4.42: Effect of temperature on bending strength of body the samples different percentage of POFA (mould pressure =91 MPa,
soaking time =2 hours) 137
Figure 4.43: Effect of mould pressure on bending strength of the samples with different percentage of POFA (temperature =1100 οC,
soaking time =2 hours) 137
Figure 4.44: Effect of soaking time on bending strength of the the samples with different percentage of POFA (temperature =1100 οC,
mould pressure = 91 MPa) 137
Figure 4.45: Effect of temperature on compressive strength of the samples with different percentage of POFA (mould pressure =91 MPa,
soaking time =2 hours) 140
Figure 4.46: Effect of mould pressure on compressive strength of the
samples with 140
Figure 4.47: Effect of soaking time on compressive strength of the samples with different percentage of POFA (temperature =1100 οC,
xxiii Figure 4.48: The XRD curves of the samples containing 15 wt% of POFA
sintered at different temperatures (mould pressure =91 MPa,
soaking time =2 hours) 143
Figure 4.49: The XRD curves of the samples containing 15 wt% POFA pressed at different mould pressure (temperature =1100 οC,
soaking time =2 hours) 144
Figure 4.50: The XRD curves of the samples containing 15 wt% POFA sintered at different soaking times ((temperature =1100 οC,
mould pressure = 91 MPa) 145
Figure 4.51: SEM of the sample containing 15 wt% POFA sintered at a temperature of (a) 1000 οC (b) 1100 οC (c) 1200 οC (c) 1280 ο
C. All micrograph were taken with 1000X magnification
(mould pressure =91 MPa, soaking time =2 hours) 146 Figure 4.52: SEM of the samples sintered containing 15 wt% POFA pressed
at pressed at mould pressure of (a) 31 MPa (b) 61 MPa (c) 91 MPa (d) 121 MPa. All micrograph were taken with 1000X
magnification (temperature =1100 οC, soaking time =2 hours) 147 Figure 4.53: SEM of the samples containing 15 wt% of POFA sintered at a
soaking time of (a) 1hour (b) 2hours (c) 3hours. 1000X magnification (temperature =1100 οC, mould pressure = 91
MPa) 148
Figure 4.54: Effect of temperature on shrinkage of the samples with different percentage of RHA and POFA (mould pressure =91
MPa, soaking time =2 hours) 151
Figure 4.55: Effect of mould pressure on shrinkage of the samples with different percentage of RHA and POFA (temperature =1200 ο
C, soaking time =2 hours) 151
Figure 4.56: Effect of soaking time on shrinkage of the samples with different percentage of RHA and POFA (temperature =1200 ο
C, mould pressure =91 MPa) 151
Figure 4.57: Effect of temperature on pecentage of porosity of the samples with different percentage of RHA and POFA (mould pressure
Figure 4.58: Effect of mould pressure on percentage of the samples of sample with different percentage of RHA and POFA wt%
(temperature =1200 οC, soaking time =2 hours) 154 Figure 4.59: Effect of soaking time on the porosity of of the samples with
different percentage of RHA and POFA (temperature =1200 ο
C, mould pressure =91 MPa) 154
Figure 4.60: Effect of temperature on bulk density of the samples with different percentage of RHA and POFA (mould pressure =91
MPa, soaking time =2 hours) 157
Figure 4.61: Effect of mould pressure on bulk density of the samples with different percentage of RHA and POFA (temperature =1200 ο
C, soaking time =2 hours) 157
Figure 4.62: Effect of soaking time on the bulk density of the samples with different percentage of RHA and POFA (temperature =1200 ο
C, mould pressure =91 MPa) 157
Figure 4.63: Effect of temperature on Vickers micro-hardness of sample with different percentage of RHA (mould pressure =91 MPa,
soaking time =2 hours) 159
Figure 4.64: Effect of mould pressure on Vickers hardness of the samples with different percentage of RHA and POFA (temperature
=1200 οC, soaking time =2 hours) 159
Figure 4.65: Effect of soaking time on Vickers hardness of the samples with different percentage of RHA and POFA (temperature
=1200 οC, mould pressure = 91 MPa) 159
Figure 4.66: Effect of temperature on bending strength of the samples with different percentage of RHA and POFA (mould pressure =91
MPa, soaking time =2 hours) 163
Figure 4.67: Effect of mould pressure bending strength of the samples with different percentage of RHA and POFA (temperature =1200 ο
C, soaking time =2 hours) 163
Figure 4.68: Effect of soaking time on bending strength of the samples with different percentage of RHA and POFA (temperature =1200 ο
xxv Figure 4.69: Effect of temperature on compressive strength of the samples
with different percentage of RHA and POFA (mould pressure
=91 MPa, soaking time =2 hours) 165
Figure 4.70: Effect of mould pressure on compressive strength of the samples with different percentage of RHA and POFA
(temperature =1200 οC, soaking time =2 hours) 165 Figure 4.71: Effect of soaking time on com pressive of the samples with
different percentage of RHA and POFA (temperature =1200 ο
C, mould pressure = 91 MPa) 165
Figure 4.72: The XRD curves of the samples containing 20wt% of RHA and POFA sintered at different temperatures (mould pressure
=91 MPa, soaking time =2 hours) 168
Figure 4.73: The XRD curves of the samples containing 20 wt% of RHA and POFA sintered at different mould pressure (temperature
=1200 οC, soaking time =2 hours) 169
Figure 4.74: The XRD curves of the samples containing 20 wt% of RHA and POFA sintered at different soaking time (temperature
=1200 οC, mould pressure =91 MPa) 170
Figure 4.75: SEM of the samples containing 20 wt% RHA and POFA sintered at a temperature of (a) 1000οC (b) 1200οC (c) 1300οC. All micrograph were taken with 1000X magnification (mould
pressure =91 MPa, soaking time =2 hours) 171
Figure 4.76: SEM of the samples containing 20 wt% RHA and POFA pressed at a mould pressure of (a) 31 MPa (b) 61 MPa (c) 91 MPa (d) 121 MPa. All micrograph were taken with 1000X
magnification (temperature =1200 οC, soaking time =2 hours) 172 Figure 4.77: SEM of the samples containing RHA and POFA sintered at a
soaking times (a) 1 hour (b) 2 hours (c) 3 hours. All
micrograph were taken with 1000X magnification (temperature
=1200 οC, mould pressure =91 MPa) 173
Figure 4.78: Relationship between the compressive strength and percentage
of porosity (RHA wt %) 175
Figure 4.79: Relationship between the compressive strength and percentage
Figure 4.80:0 Relationship between the compressive strength and percentage
xxvii
TABLES
LIST OF TABLES
Table 3.1: RHA wt% Vs temperature 70
Table 3.2: RHA wt% Vs mould pressure 71
Table 3.3: RHA wt% Vs soaking time 72
Table 3.4: POFA wt% Vs temperature 73
Table 3.5: POFA wt% Vs mould pressure 74
Table 3.6: POFA wt% Vs soaking time 75
Table 3.7: RHA and POFA wt% Vs temperature 76
Table 3.8: RHA and POFA wt% Vs mould pressure 77
Table 3.9: RHA and POFA wt% Vs soaking time 78
Table 3.10: The composition with the substitution of quartz by RHA (wt %) 79 Table 3.11: The composition with the substitution of quartz by POFA (wt %) 80 Table 3.12: The composition with the substitution of quartz by RHA and
POFA (wt %) 80
Table 4.1: X-Ray Fluorescence (XRF) Analysis 89
Table 4.2: XRD quantitative analysis of the samples containing 20 wt% RHA sintered at different temperatures (mould pressure =91
MPa, soaking time =2 hours) 116
Table 4.3: XRD quantitative analysis of the samples containing 20 wt% RHA pressed at different mould pressure (temperature =1200 ο
C, soaking time =2 hours) 117
Table 4.4: XRD quantitative analysis of the samples containing 20wt% RHA sintered at different soaking times (temperature =1200 ο
Table 4.5: XRD quantitative analysis of the samples containing 15 wt% of POFA sintered at different temperatures (mould pressure =91
MPa, soaking time =2 hours) 143
Table 4.6: XRD quantitative analysis of the samples containing 15 wt% POFA pressed at different mould pressure (temperature =1100 ο
C, soaking time =2 hours) 144
Table 4.7: XRD quantitative analysis of the samples containing 15 wt% POFA sintered at different soaking times (temperature =1100 ο
C, mould pressure = 91 MPa) 145
Table 4.8: XRD quantitative analysis of the samples containing 20 wt% of RHA and POFA sintered at different temperatures (mould
pressure =91 MPa, soaking time =2 hours) 168
Table 4.9: XRD quantitative analysis of the samples containing 20 wt% of RHA and POFA pressed at different mould pressure
(temperature =1200 οC, soaking time =2 hours) 169 Table 4.10: XRD quantitative analysis of the samples containing 20 wt%
RHA and POFA sintered at different soaking times
xxix
LIST OF ABBREVIATIONS
Al2O3 = Aluminium Oxide C2S = Dicalcium Silicate C3A = Tricalcium Aluminate C3S = Tricalcium Silicate CaCO3 = Calcium Carbonate
CaO = Calcium Oxide
Ca(OH)2 CaO
= =
Calcium Hydroxide Calcium Oxide F2O3 = Iron Oxides
SiO2 = Silica
MgO = Magnesium Oxide
MP = Mould Pressure
MPa = Mega Pascal
OPC = Odinary Portland Cement POFA = Palm Oil Fuel Ash
RH = Rice Husk
RHA = Rice Husk Ash
XRD = X-ray Diffraction XRF = X-ray fluorescence
Α = Alpha
Β = Beta
C-S-H = Calcium Silicate Hydrate Θ = Bragg‘s Angle
CHAPTER 1 In troduction
CHAPTER 1
INTRODUCTION
1.1 Background of the study
Ceramic tile is a product that stands out for its low water absorption and high mechanical strength. The properties of the product result from its low porosity due to the processing conditions (high degree milling of raw materials, high force compaction and sintering temperature), and the potential of the raw materials to form liquid phases during sintering (high desiccation). However, in the case of polished ceramic, the sealed pores remaining after the manufacturing process may impair some of its technical properties, such as its stain resistance. Porcelain tile is a type of the ceramic materials which have the vitreous characteristics. Vitrification indicates a high degree of melting on firing which confer how (often< 0.5%) porosity and high (> 40%) glass content on fired porcelain (Perez et al., 2013). As the of ceramic material, the porcelains have high hardness, low electrical and thermal conductivities, and brittle fracture (Callister, 2008). Porcelains consists of approximately 50% kaolin [Al2Si2O5 (OH)4] , 25% silica (SiO2), and 25% feldspar [(K,Na)2O. Al2O3. 6H2O]. The kaolin provides the plasticity during firing, the feldspar assists in the liquid formation and reduces the porosity, the quartz serves as a binder. This composition makes a material body plasticity and a wide firing temperature range at a relatively low cost (Buchanan 1991 and Olupot, 2006). Porcelain is a type of ceramic highly valued for it beauty and strength. Whiteness, a delicate appearance, and translucence characterize it. It is known primarily material as for high-quality vases, table ware, figures and decorative objects.
2 floor and wall tile, porcelain tile is the product which in recent years has shown the greatest rate of increase (on a percent basis) in the amount produced, amount sold, and obviously amount used (Abadir et al., 2002). The American National standard Specifictions for Ceramic Tile defines porcelain tiles as: dense, smooth, impervious (with water absorption of 0.5 percent or less), and stain resistant (Ece and Nakagawa, 2002). Their peculiar characteristics put them at the top of a class of available commercial products that can be used for both indoor and outdoor building applications. Since they achieve a very high level of combination between physicomechanical properties and decorative quality, they are expected to replace the traditional ceramic floor tiles completely in the next few years.
The physical and mechanical properties of porcelain bodies have been studied extensively for almost a century. During this period three theories have been presented to explain the strength of porcelains. These are the ‗‗Mullite hypothesis‘‘(Carty and Senapati, 1998), the ‗‗dispersion strengthening hypothesis‘‘ and the ‗‗Matrix reinforcement hypothesis‘‘. The mullite hypothesis suggests that the physical and mechanical properties of porcelain ceramic solely depends on the felt-like interlocking of fine mullite needles. Specifically, the higher the mullite content and the higher the interlocking of the mullite needles, the higher is the mechanical properties (Ece and Nakagawa, 2002). Hence, the mechanical properties of porcelain depends on the factors that affect the amount and size of mullite needles like the firing temperature (Branga and Bargmann, 2003).
On the other hand, the dispersion strengthening hypothesis states that dispersed particles in the vitreous phase of a porcelain body, such as quartz and mullite crystals, in the glassy phase of a porcelain body limit the size of Griffith flaws resulting in increased strength. The concept of the matrix reinforcement hypothesis concerns with the development of compressive stresses in the vitreous phase as a result of the different thermal expansion coefficients of dispersed particles or crystalline phases (usually quartz) and the surrounding vitreous phase. The larger these stresses are, the higher is the strength of the porcelain bodies. The phenomenon is known as the pre-stressing effect.
that support the mullite hypothesis or the dispersion strengthening hypothesis claim that the presence of residual quartz in fired bodies is harmful to the porcelain strength due to the α-β transformation of quartz crystals during cooling (Stathis, 2008). Additionally, higher strength can be obtained by the replacement of quartz by sillimanite sand, alumina (Das and Dana, 2003), kyanite or mullite, rice husk ash, sericitic pyrophyllite or low expansion porcelain powder. The use of combination of RHA and POFA to substitute quartz has not been reported. Using RHA and POFA for the fabrication of porcelain is expected to improve some of the mechanical properties of porcelain ceramic tiles and reduce some of the problems they cause to the environment. Moreover, the use of RHA and POFA to replace quartz is expected to have effects on sintering temperature, mould pressure and soaking time.
A simultaneous investigation of parameters such as optimum composition of RHA and POFA content, optimum sintering temperature, optimum mould pressure, and optimum soaking time would help in the direction of understanding the mechanisms controlling porcelain‘s strength and improving its mechanical properties.
1.2 Problem statement
Quartz grains embedded in the porcelain glassy matrix have a deleterious effect on the mechanical strength mainly because of its transformation during cooling (Maity and Sarkar, 1996) which results in the development of stresses which initiate fracture (Carty and Senapati, 1998). The thermo-mechanical properties of whiteware bodies change greatly during the reconstructive and the displacive transformation of free silica due to change in volume (Prasad et al., 2001).
4 (Kingery, 1986; Maity and Sarkar et al., 1996), through the reduction of the particle size of quartz and non-plastic materials. Tomizaki (1995) reported that dissolved quartz in the glassy phase and cristobalite phase precipitation has a deleterious effect on the mechanical properties of porcelain ceramic. The use of RHA and POFA simultaneously to replace quartz in porcelain ceramic has not been presented. Additionally, replacing quartz with RHA and POFA is expected to have impact on the parameters such sintering temperature, mould pressure and soaking time. Moreover, determining the parameters such as optimum composition of RHA and POFA content, optimum sintering temperature, optimum mould pressure, and optimum soaking time would help in the direction of understanding the mechanisms controlling porcelain‘s strength and improving its mechanical properties.
Rice Husk (RH) is an agricultural residue abundantly available in rice producing countries. Globally, approximately 690 million tons of RH is produced each year. Therefore, total global ash production could be as high as 134 million tons per year. In Malaysia, the RH produced annually amounts to more than 2.5 million tons. In Brazil, for example, 2.5 million tons of RH is generated each year. In Thailand more than 500 thousand tonnes per year of RH is produced. Rice husk ash (RHA) is produced as a result of burning of RH by plants to generate electricity. POFA is a by-product from biomass thermal power plants where palm oil residues are burned to generate electricity. Malaysia is one of the largest producer of palm oil with around 41% of the total world supply in years 2009– 2010. Since palm oil is one of the major raw materials used to produce bio-diesel, it is likely that the production of POFA will increase every year. an extensive search of the literature high-lighted many uses of RHA. Two main industrial uses were identified: as an insulator in the steel industry and as a pozzolanic material in the cement industry.
substitute quartz in the production of porcelain ceramic tiles. The porcelain industries make use of natural resources for their production. Increasing world population and life demand are continuously raising the price of raw materials and reducing the natural resources; for these reasons this study is concentrated to use agric-waste materials as potential alternative in the porcelain industry. An investigation into the parameters such as temperature, mould pressure and soaking time would help towards the understanding of mechanical properties of porcelain ceramic tile.
Therefore, the present study wishes to study the mechanical properties of ceramics tiles by replacement of quartz by RHA and POFA in order to help towards sustaining the natural resources, reduce the environmental hazards caused by the ashes and to possibly add value to some of the properties of porcelain ceramic tiles.
1.3 Objectives of the study
The aim of the research is to study the effects of the replacement of RHA and POFA on properties of porcelain ceramics. In order to achieve that, four objectives were designed which are as follows:
(i) To determine the effects of the replacement of quartz by RHA, POFA and the combination of RHA and POFA on the mechanical and physicaln properties of porcelain ceramics. Such as following:
(a) Mechanical properties which include, Vickers hardness, bending strength and compressive strength.
(b) Physical properties, which include volume shrinkage, percentage of porosity, bulk density and microstructure.
(ii) To determine the optimum paramaters such as sintering temperature, mould pressure, soaking time with respect to the physical and mmechanical properties.
1.4 Scope of the study
6 (i) Standard porcelain ceramic composition was adopted: Kaolin 50 wt%, feldspar 25 wt%, quartz 25 wt% (quartz was progressively replaced by RHA and POFA).
(ii) In order to determine the optimum temperature, the temperature was varied withing this range: 1000 οC, 1100 οC, 1200 οC and 1300 οC.
(iii) The samples were produced at different mould pressures: 31 MPa, 61 MPa, 91 MPa and 121 MPa.
(iv) The soaking time was varied from 1 hour, 2 hours and 3 hours in order to establish in order to determine the best soaking time.
(v) Conducting the experiment to investigate and evaluate the following responses;
a. Volume shrinkage using (Vanier Calliper)
b. Percentage of porosity using (Mettler Teldo) (XS-64) c. Bulk density using (Mettler Teldo) (XS-64)
d. Vickers hardness using (Shimadzu) (HVM-2TE)
CHAPTER 2 Li terature
Review
CHAPTER 2
LITERATURE REVIEW
2.1 Introduction on porcelain ceramic tile
Porcelain ceramic tile is a highly vitrified ceramic material produced from a body formulated by mixtures of kaolin, quartz and feldspar. The kaolin [Al2Si2O5 (OH)4], gives plasticity to the ceramic mixture; flint or quartz (SiO2), maintains the shape of the formed article during sintering; and feldspar [(K,Na)2O. Al2O3. 6H2O], serves as flux. These three constituents place porcelain in the phase system [(K, Na)2O-Al2O3 -SiO2)] in terms of oxide constituents, hence the term triaxial porcelain ceramic tiles (Buchanan 1991 and Olupot, 2006). The main phase composition of a porcelain body is constituted by a heterogeneous glassy matrix and needle shaped mullite crystals together with some quartz grains and closed irregular shaped pores. Mullite crystals, which are derived from the solid-state decomposition of the clay reacting with feldspar, are endowed with excellent mechanical, creep, thermal and chemical properties. Because of the complex interplay between raw materials, processing routes and the kinetics of the firing process, porcelains represent some of the most complicated ceramic systems (Lopez, 2011).
2.1.1 Raw materials of porcelain
8 (<10%). The quartz promotes thermal and dimensional stability (De Noni et al., 2010). These materials are also used in the production of various whiteware products. The distinguishing factor in the properties of different porcelain products are brought about by variations in the proportion of these materials, the processing and the firing schedule adopted. For porcelain, the quest over the period of time has been to increase mechanical strength, and to reduce the production costs. In most efforts to increase strength, emphasis has been placed on minimization of quartz in the porcelain formula because of the β to α phase inversion of quartz which occurs at 573 οC during cooling. The inversion results into decrease of quartz particle volume and may lead to cracks in the body. So far, there are reports of improvements in the mechanical properties by reducing the use of quartz. These include replacements of quartz with kyanite (Schroeder, 1978), Al2O3 (Kobayashi et al., 1987 and Das and Dana 2003), RHA (Prasad et al., 2001, Kurama 2008; Haslinawati et al., 2009), sillimanite sand (Maity and Sarkar, 1996), fly ash (Dana et al., 2004), partial replacement of feldspar and quartz by fly ash and blast furnace slag (Dana et al., 2005), silica fume (Prasad et al., 2002), with a mixture of RHA and silica fume (Prasad et al., 2003). In this context, it can also be mentioned that an attempt to substitute part of quartz with fired porcelain by Stathis et al., (2004) did not result in a positive effect on the bending strength.
at a temperature of 225 οC - 250 οC similar to the quartz inversion, but produces larger volumetric change of approximately 5% (Lundin, 1964). For small particle sizes, the dissolution is more rapid leaving less quartz crystals in the glass and hence yielding a low pre-stress and low strength of the material. For large particle sizes an interconnected matrix with favorable crack path is formed leading to low strength (Carty and Senapati, 1998). Hence, quartz grain size affects bending strength in two ways, that is, directly through the induction of compressive stresses to the vitreous phase and indirectly through the development of a favourable microstructure (Stathis et al., 2004).
2.1.2 Strength consideration
The great interest in strength of porcelain for application and the wide research on the porcelain system has resulted in three major hypotheses describing the strength properties of porcelain formulations. These were described by Carty and Senapati, (1998) as the mullite hypothesis, the matrix reinforcement hypothesis and the dispersion strengthening hypothesis, respectively. The mullite hypothesis suggests that porcelain strength depends on the interlocking of fine mullite needles. Specifically, the higher the mullite content and the higher the interlocking of the mullite needles, the higher is the strength. Hence, the strength of porcelain depends on the factors that affect the amount and size of mullite needles, like the firing temperature and composition of alumina and silica in the raw materials.
The matrix reinforcement hypothesis concerns the development of compressive stresses in the vitreous phase as a result of the different thermal expansion coefficients of dispersed particles, or crystalline phases, and the surrounding vitreous phase. The larger these stresses are, the higher is the strength of the porcelain. This phenomenon is known as the pre-stressing effect. The dispersion strengthening hypothesis, on the other hand, states that dispersed particles in the vitreous phase of a porcelain body, such as quartz and mullite crystals in the glassy phase, limit the size of Griffith flaws resulting in increased strength.
10 thermal coefficients of the phases, elastic properties of the phases, volume fraction of different phases, particle size of the crystalline phases and phase transformations. Islam et al. (2004) concludes that the best mechanical properties can be achieved by high mullite and quartz content with low amount of the glassy phase and in the absence of micro cracks. However, a high amount of SiO2 leads to a high amount of the glassy phase which is detrimental to the development of high mechanical strength.
2.1.3 Sinteing of porcelain
During firing process, sequence of intercrystalline (regarding a single crystalline/ amorphous phase) and extra crystalline (interaction of a crystalline/amorphous phase with one another) take place. Temperature, time, and atmosphere in the furnace affect chemical reactions and microstructural development in the porcelain ceramic tiles and, consequently, are important in the fired properties of porcelain. Fast firing of porcelain has gained wide recognition and application in the whiteware industry (Manfredini and Pennisi, 1995) reducing production costs by efficient use of energy in the firing process. The fast firing of porcelain requires the knowledge of chemical reactions occurring during the process and of microstructural development. Ignoring the removal of non chemically bound species, such as water and organics the basic reaction steps can be outlined as follows:
(i) The loss of weight when kaolin is fired to temperatures exceeding about 450 ο
C to 550 οC under normal atmospheric conditions is commonly ascribed to ―dehydration‖ and the water involved in the reaction is designated ―structural water.‖ Neither term is correct, as the crystal lattice loses hydroxyl groups. The process is better described as ―dehydroxylation‖ and it can be represented chemically by the equation.
2.1
kaolinite generally depend upon number of variables. For example, (a) origin of kaolinite and its nature of crystallinity, size distribution and its impurities content. (b) DTA equipment and its sample holder, thermocouple, sensitivity, furnace and its atmosphere. (c) Operating conditions heating rate, sample size, packing, etc (Tarvornpanich et al., 2008).
(ii) The α → β phase transformation of quartz crystals takes place at ∼573 ºC during the heating-cooling process and to the relaxation of micro-stresses originated between quartz grains and the surrounding glassy phase by the differences in their thermal expansion coefficients (α~23x10-6 ºC-1 for quartz and α~3x10⁻⁶
ºC-1 for the glassy phases) in the 20 ºC – 750 ºC temperature interval (Tarvornpanich et al., 2008).
(iii) Sanidine, the homogeneous, high-temperature, mixed-alkali feldspar, forms within 700 οC -1000 οC (Martín-Márquez et al., 2010a). The formation temperature apparently is dependent on the sodium: potassium ratio.
(iv) Metakaolin transforms to a spinel-type structure and amorphous free silica at -950 οC -1000 οC (Sonuparlak, 1987).
(v) The amorphous silica liberated during the metakaolin decomposition is highly reactive, possibly assisting eutectic melt formation at 990 οC, as suggested by Ece and Nakagawa (2002). Carty and Senapati (1998) suggests instead that amorphous silica transforms directly to cristoballite at 1050 οC, but the general lack of cristoballite in modem commercial porcelain ceramics suggests that the former scenario is more plausible.
(vi) Potassium feldspar melts at the temperature of 990 οC but sodium feldspar melts at 1050 οC. The lower liquid formation is beneficial to the reduction of the porcelain firing temperature. The presence of feldspar can reduce the liquid formation by as around 60 οC (Pérez et al., 2012).
(vii) Primary and secondary mullite formation takes place at a temperature of 1075 ο
C (Carty and Senapati 1998). Some studies however, indicates that the stable form of aluminosilicates is formed at a higher temperature (Carty and Senapati, 1998).
12 (ix) At 1230 ºC feldspar has totally decomposed and the body is just comprised
simply of mullite crystals, quartz grains and a glassy phase (Rincón, 1992). (x) Pyroplastic deformation begins to take place as the porcelain body begins to
cool, relaxation also starts within the glass phase to prevent the development of residual stresses until glass transition temperature is reached. As the body cools below the glass transition temperature, residual stresses are developed because of thermal expansion mismatch between the glass and the included crystalline phases (i.e., mullite and quartz, and in some cases, alumina and cristoballite).
(xi) On cooling, quartz inversion takes place at temperature of 573 οC these results in a decrease in volume of the body by about 2 % (Carty and Senapati, 1998).
(xii) cristoballite inversion occurs at a temperature of 225 οC -250 οC similar to the quartz inversion, but produces larger volumetric change of approximately 5 % (Carty and Senapati, 1998).
2.1.4 Sintering stages
Sintering is known as a process of creating objects from powders or particles. The basic mechanism is atomic diffusion. Atomic diffusion occurs much faster at higher temperature. Few parameters are known to affect sintering such as type of materials, particle sizes, sintering atmosphere, temperature, time and heating rate (Rahaman, 2003).
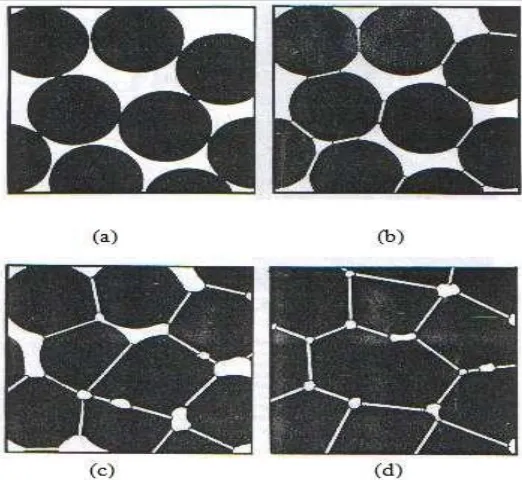
There are 3 stages during sintering; starting, intermediate and finish. Figure 2.1 shows the respective stages. During adhesion stage the particles comes into contact w i t h each other but do not form any bond. At starting stage, there is a rapid growth of the interparticle neck between the particles. At intermediate stage the pore structure becomes smooth (reach equilibrium shape) and develops interconnected particles. The intermediate stage usually covers the major part of the sintering process. Particles start to form grain boundaries. At the final stage, the densification process is stopped and the pores become spherical and separated.
area of higher chemical potential to an area of lower chemical potential. The different paths that the atoms take to get from one spot to another are known as the sintering mechanisms. The six common mechanisms are:
(i) Surface diffusion – diffusion of atoms along the surface of a particle
(ii) Vapor transport – evaporation of atoms which condense on a different surface (iii) Lattice diffusion from surface – atoms from surface diffuse through lattice (iv) Lattice diffusion from grain boundary – atom from grain boundary diffuses
through lattice
[image:35.595.206.467.319.559.2](v) Grain boundary diffusion – atoms diffuse along grain boundary (vi) Plastic deformation – dislocation motion causes flow of matter
Figure 2.1: Stages of sintering (a) free particles, (b) necking between particles, (c) formation of grain boundary, and (d) densification process and pores elimination
(Randal, 1991)
14 atmosphere, maximum temperature mould pressure and soaking time. All these parameters are related to quality and cost of the products.
The work of Mattyasovszky-Zsonay (1957) is very conclusive with respect to porcelain mechanical strength. Mattyasovszky-Zsonay has recommended a particle diameter of quartz of 10–30 µm and shown the influence of quartz. He disregarded the effect of mullite and explained the prestress theory. Schuller (1979) has made an analogy between quartz content and particle size explaining mechanical strength as a consequence of radial and tangential stress. Schuller found that a variation in strength occurred with a variation in quartz content. He also highlighted that the best diameter of quartz is between 15 and 30 µm. Carty and Senapati (1998) examined three hypothesis: (1) mullite, (2) matrix reinforcement and (3) dispersion strengthening mechanism. They concluded that these three factors have an influence but the principal factor depends on the microstructure. The intrinsic flaw can be either a simple pore in a sample containing a glassy phase, or a pre existing crack in a sample that does not contain a glassy phase. This is due to the presence of quartz and cristobalite. Kobayashi et al. (1992) found a high bending strength body containing a large amount of porosity. This body presented small pores distributed uniformly within the microstructure. The apparent porosity was zero although a high relative density was not obtained. Bradt as reported by Kobayashi et al., (1992) based his explanation of the effect of quartz on the strength on Linear Fracture Mechanics. He found a KIC value of 1.3 MPa m 1/2 for a body containing 10–30 µm quartz particle size.
composition. The composition of this local liquid was determined by the extent of mixing of the porcelain raw materials and the role of the flux is critical.
Braganca et al. (2004) investigated the mechanical properties of porcelain. They reported the optimum sintering temperature for the porcelain studied was 1340 ο
C using a heating rate of 150 C/h and a 30 min soaking time. At this temperature the modulus of rupture and bulk density were at a maximum. The authors recorded the technical parameters are summarized such as water absorption: 0.34%, apparent porosity: 0.84%, bulk density: 2.48 g/cm3 linear shrinkage: 12.2% modulus of rupture: 46 MPa. Their analysis of the technical data showed that the modulus of rupture and the bulk density were related. The authors added that the maximum strength is a result of decrease in porosity and internal flaws. Samples fired at temperatures below the ideal (1340 οC) showed open porosity. Above this, according to them, temperature an increasing in closed porosity occurred due to oxygen releasing and bloating. They further explained that two types of porosity caused a decrease in sample strength. For the ideal firing temperature (1340 οC) they found out that the fracture toughness is KIC=1.6 MPa m1/2, the fracture energy =16.4 J/m2 and crack length c=200 mm. These according the author parameters are good values for a fine ceramic. On the microstructural analysis Braganca et al. (2004) revealed that the ideal firing temperature occurs when the glassy phase covers the entire sample surface with sufficient time to react with crystalline phases. Higher temperatures were limited by the porosity increase. This porosity is a result of oxygen released from Fe2O3 decomposition and gas expansion in the pores.
16 The microstructure of the samples is very porous and characterized by large, irregular pores connected to each other. On the other hand, using finer quartz grains results in low bending strength due to limited pre-stressing effect. Controlling quartz grain size in the optimum range bending strength is increased by 20–30% compared to the reference porcelain. The results are consistent with the matrix reinforcement theory. He however, concludes that the beneficial influence of mullite content on bending strength is not confirmed. In addition, they concluded that replacing part of quartz content with fired porcelain did not result in a positive effect on bending strength.
In a study carried out by Tucci et al. (2004), investigated, the possibility of replacing a percentage of the sodium feldspar with soda-lime scrap-glass in a standard porcelain ceramic stoneware tile mix. According to them the replacement of 10 wt.% of the sodium feldspar with the same amount of soda-lime scrap-glass causes the following remarkable effects such as: decrease in firing temperature, an increase in mechanical resistance. The authors emphasized the importance of the possibility of improving the characteristics of a product, and at the same time finding a use for a waste material, the availability of which is increasing.
Romero et al. (2006) carried out a research on the crystallisation kinetic and growth mechanism of mullite crystals in a standard porcelain stoneware powder of composition 50% kaolinitic clay, 40% feldspar and 10% quartz for tiles production have been investigate by DTA method. From the experimental results, the authors were conclusive on the following. (1) The temperature of mullite crystallisation in the porcelain stoneware powder was around 985 °C. (2) The activation energies of mullite crystallisation in porcelain stoneware calculated by both isothermal (Ligero method) and non-isothermal (Kissinger method) treatments are 599 and 622 kJ mol−1, respectively. (3) The values of the growth morphology parameters n and m are found to be n = m ≈ 1.5 indicating that bulk nucleation is the dominant mechanism in mullite crystallisation and a three-dimensional growth of mullite crystals with polyhedron-like morphology controlled by diffusion from a constant number of nuclei.
toughening mechanisms, deflection of the crack path and crack stopping, influenced crack propagation. Besides, they observed that the presence of spodumene, due to its capability to develop a low viscosity liquid phase, improves the sintering performances of the modified products, reduces porosity and favours the crystallisation of rather elongated needle like mullite.
Kemseu et al. 2007 produces soft and hard porcelain with excellent technical characteristics from two different china clays from Cameroon and carried out an investigation into them. From the results obtained in their work, he concluded that the two China clays from Cameroon are suitable as clay for porcelain bodies. According to Kemseu et al. (2007), the properties of the final products show that: Soft porcelain with low clay content and higher proportion of fluxing agent can be produced in the range of temperature of 1200–1225 οC with average density of 2.4 g/cm3 , water absorption less than 0.1% and flexural strength of 149 MPa. Hard porcelain bodies with higher clay contain and relatively low proportion of fluxing agent can be produced in the range of temperature of 1325 οC –1350 οC and flexural strength of 167 MPa. He added therefore, that the use of China clays with TiO2 and FeO2 content permits a decrease of 25 οC in firing temperature. This should reduce production costs which makes its utilisation very attractive, especially for tiles where the white colour is not required.
Ece and Nakagawa (2002) have shown that a maximum bending strength for a 10–30 mm quartz grain size occurs after firing at 1300–1350 οC. They explained that fractures initiating from flaws were micro-cracks around quartz grains acting as links between closed pores.
Transmission Electron Microscope (TEM) and acoustic emission were used by Ohya and Takahashi (1999) in order to analyze the microstructure of a porcelain body. They presented TEM micrographs showing peripheral cracks around quartz. They pointed out that these cracks are a consequence of quartz and matrix expansion mismatch during cooling from temperatures below 1000 οC.
18 and the displacive transformation of free silica due to change in volume, which was reviewed in detail by Kingery (1960).
Several investigators (Maity and Sarkar, 1996; Prasad et al., 2001; Prasad et al., 2002; Derevyagina et al., 1980, Das and Dana, 2004; kalapathy 2007; Haslinawati 2009) tried to improve the mechanical properties of whiteware bodies by replacing quartz with other materials viz; sericitic pyrophyllite, kyanite, bauxite, sillimanite sand alumina, fly ash and RHA. Although the alumina in different forms has a favourable influence on the mechanical properties of whiteware due to the formation of primary mullite, it lowers the recystallisation of secondary mullite due to an increase in the viscosity of the glassy phase. On the other hand, only three researchers reported the use RHA to substitute quartz (Kalapathy 2000: Prasad et al., 2001; Kurama 2008; Haslinawati, 2009) in the porcelain ceramic tile.
Maity and Sarkar (1996) studied the effect of sillimanite sand as a replacement for quartz and alumina/cordierite glass-ceramic for feldspar was studied. Compositional variations were due to the gradual incorporation of alumina in place of cordierite ceramic was observed. Increased replacement of cordierite glass-ceramic by alumina (20%) increased the flexural strength by 100%, giving a value of 195 MPa was noted. The authors however, discovered that elastic modulus, micro hardness and fracture toughness also showed sharp increases compared with values for conventional triaxial whiteware compositions. They concluded that improvement in mechanical properties was attributed to the presence of sillimanite and alumina particles present as fracture-resistant dispersions in a viscous glassy matrix. Increased fracture behaviour is due to minimization of the glassy phase and limiting the size of Griffith's flaws.
The reduction in the vitrification temperature of the mixes also contribute significantly to the economical production of whitewares.
In a study carried out by Chen et al. (2000), demonstrates that mullite can be prepared by reaction sintering kaolinite and alumina. The advantage of their process is its economic feasibility. The disadvantage of it, was its relatively high sintering temperature, low density and consequently low strength. The authors observed the alumina particles are inert to kaolinite until 1200 °C. According to the study the reaction between alumina and the glass phase to form mullite starts from 1300°C. They stressed that the sintering temperature of the (kaolin+alumina) powder compacts has therefore to be higher than 1300 °C. Nevertheless, the authors pointed out that the disadvantage can be coped with by adding flux such as feldspar into kaolin. The reaction between kaolinite and alumina was accompanied with a shrinkage. The study also revealed the the presence of glassy phase facilitates the formation of large holes. Fully dense mullite specimens are thus difficult to prepare by using the process employed in the present study. The strength of the specimens was therefore low. However, the toughness of the specimen increases with the increase of alumina content.
Braganc et al. (2002) produced porcelain with excellent technical characteristic which had similar properties to a traditional porcelain by substituting quartz with glass powder. From the results they obtained they concluded that the use of recycled soda–lime glass powder as a fluxing agent to replace feldspar in porcelain was viable. The appropriate firing temperature for glass powder porcelain was 1240 °C and for traditional porcelain was 1340 °C. Therefore they asserted, that the use of glass powder permitted a decrease of 100 °C in firing temperature to be made. The authors added that it would mean a reduction in production costs which will make the utilisation of glass powder porcelain very attractive. They found out that the firing curve (water absorption and linear shrinkage and firing temperature) shows that glass powder porcelain has a behaviour typical of a strong flux.
20 discovered that the microstructural analysis revealed that the ideal firing temperature occurred when the glassy phase covered the entire sample surface and had a sufficient time to react with the crystalline phases. They however stresses that at higher temperatures were deleterious to the properties of porcelain due to an increase in porosity. The porosity according to them was due to the release of oxygen from the decomposition of Fe2O3 and gas expansion within the pores. The higher amount of closed porosity in glass powder porcelain porcelain explains why this porcelain did not attain a higher bulk density.
In a research conducted by Prasad et al. (2002), where they substituted quartz with silica fume found that the incorporation of silica fume in place of quartz in whiteware bodies lowers the vitrification temperature. They noticed a reduction in the maturing temperature of about 50–100 °C was noticed in the body mixes containing 5–25 wt.% of silica fume compare to that of the reference body. They also discovered that increase in the fired strength about 10% with 10 wt.% silica fume and decrease in the thermal expansion (5.95%) are attributed to the sharp decrease in the content of quartz and also to the increase in the content of the glassy phase. However, according to them the content of mullite appeared to be unaffected due to addition of silica fume in the compositions but with a change in the size of mullite crystals and its orientation as observed in the micrographs. They concluded that reduction in the vitrification temperature of the body mix containing 25 wt.% silica fume with a substantial decrease in percentage of thermal expansion (∼34%) was observed which would contribute significantly to the improvement of the economical production of whitewares.
composition achieved higher BD (2.43 gm/cm3), lower %WA (0.07%) and highest flexural strength (53.14 MPa) at 1200 °C compared to potash-feldspar-containing composition. The whiteness of potash-feldspar-containing body is poorer than soda-feldspar-containing body due to increased amount of Fe2O3 and TiO2 impurities present in it.
Olgun et al. (2005) demonstrated that it is possible to utilize fly ash and tincal waste as alternative raw material resources for the production of the wall tile. On the basis of their results the authors reported that the use of tincal waste and fly ash in the standard wall tile composition increases the firing shrinkage. Moreover, they asserts that the combination of fly ash and tincal waste helps in controling firing shrinkage of the tile. According to Olgun et al. (2005), regardless of the replacement level, introduction of fly ash and tincal waste into wall tile composition increases the firing strength compared to that of standard wall tile. The authors noted that the increases in the firing strength is more pronounced as the replacement level of tincal waste and fly ash content was increased. Firing strength of the tiles containing tincal waste is higher than that of the control tile and the tile containing fly ash. The result shows that the firing strength is directly related to the tincal waste content in the wall tile, which increases as the tincal waste content of the tile compositions is increased. Water absorption of tile decreases as the tincal waste content of the tile is increased. They concluded that tiles containing up to 10 wt.% of fly ash of and 5 wt.% of tincal waste into wall tile body show a good mineralogical and rheological compatibility with the pure wall tile product.
22 comparatively smaller sized mullite needles in the glassy matrix explain the high strength achieved.
Mukhopadhyay et al. (2006) discovered that the incorporation of pyrophyllite as a progressive replacement of quartz in a porcelain composition resulted in early vitrification. According this also resulted in substantial reduction in the thermal expansion due to development of interlocking mullite needles. In addition they expalined that pyrophyllite reduced fired shrinkage and improved the flexural strength compared to the standard body. This was primarily due to the elimination of stresses in the structure with decreasing quartz content as well as due to presence of the feltlike interlocking of fine mullite needless in higher proportions. Mukhopadhyay et al. (2006) stress that mullite was found even at 1150 °C and its amount increased up to 1250 °C before decreasing at higher temperature. Beyond some optimum proportion of pyrophyllite (in this study 15%) there occur a large volume of glass formation and large elongated pores non-uniformly distributed in the microstructure which resulted in deterioration of the mechanical properties. The amount of closed pores in the specimens with pyrophyllite content beyond 15% and fired at 1300 °C was found to increase very abruptly which in turn is expected to increase the mean free fracture path per unit volume resulting in the decrease in strength.
The addition of fly ash and blast furnace slag in a traditional triaxial porcelain composition in the proportion of 1:1 and 1:2 has been studied by Dana and Das (2005). It was found to be beneficial towards improvement in mechanical strength and early vitrification at 1175 °C. Presence of microcrystalline components of quartz and mullite in fly ash and alkaline earth oxides in blast furnace slag were responsible to develop anorthite and mullite phases which ultimately improved the mechanical strength. They stressed that such type of synergistic porcelain composition may find potential applications to manufacture high strength ceramic floor tiles for industrial as well as domestic buildings. Further, part substitution of natural minerals (quartz and feldspar) by overburden industrial by-products (fly ash and blast furnace slag) reduce the cost of raw materials, thermal energy without altering the requisite physico-mechanical properties.