International Journal of Emerging Technology and Advanced Engineering
Website: www.ijetae.com (ISSN 2250-2459,ISO 9001:2008 Certified Journal, Volume 3, Issue 1, January 2013)
170
Condition Monitoring of FD-FAN Using Vibration Analysis
N. Dileep
1, K. Anusha
2, C. Satyaprathik
3, B. Kartheek
4, K. Ravikumar
5(
ASST.PROFFESOR)
1, 2, 3, 4 B.Tech Graduate, Mechanical, V. R. Siddhartha Engineering College,Vijayawada, Krishna (Dt), Andhrapradesh, India.
Abstract-- Machines of some kind are used in nearly every aspect of our daily lives; from the vacuum cleaner and washing machine we use at home, to the industrial machinery used to manufacture nearly every product we use in our daily life. When a machine fails or break down, the consequences can range from annoyance to the financial disaster or personal injury and possible loose of life. For this reason early detection, identification and correction of machinery problems is paramount to anyone involved in the maintenance of industrial machinery to insure continued, safe and productive operation. In order to run the machines efficiently and to know the onset of impending defects condition and monitoring of machines is important. There are several indicating phenomenon like Vibration, noise, heat, debris in oil, sound beyond human abilities etc., which emanate from these inefficiently running machines. Monitoring of these indicators provide early warnings of impending failures.
This paper is primarily focused on the implementation of vibration based maintenance on critical rotating machines namely FORCED DRAFT FAN (FD FAN 6B) at DR.NTTPS which is one of the boilers auxiliary. FD fans for boilers force ambient air into the boiler, typically through a preheater to increase overall boiler efficiency. The required vibration readings were taken. The levels of vibration of the fan driving end (hub1) are beyond the safe limits of desired velocity and displacement limit values. These further may cause to failure of the fan. This paper also explains about the Spike energy readings which were calculated and explained. After reading are taken it was noticed that fan driving end bearing was failed due to long life time of bearing, which is one of the cause for the increase of vibrations. This problem was rectified by replacing the new bearing and again vibration readings are noted found to be in safe limits of velocity.
Keywords-- MDE, MNDE, FDE (HUB 1), FNDE (HUB 2), Spectrums, Spike energy, Displacement, Velocity, Condition Monitoring
I. INTRODUCTION TO MONITORING
Monitoring is the systematic collection and analysis and information as a project progresses. It is aimed at improving the efficiency and effectiveness of a project or organization. It is based on targets set and activities planned during the planning faces of work. It helps to keep the work on track and can let management know when things are going wrong. If done properly, it is an invaluable tool for good maintenance, and it provides a useful base for evaluation.
It enables you to determine whether the resources you have available are sufficient and are being well used, whether the capacity you have is sufficient and appropriate and whether you are doing what you planned to do.
1.1 Maintenance strategies are classified by three developmental stages:
1. Break down maintenance 2. Preventive maintenance 3. Predictive maintenance
1.1.1 Break Down Maintenance:
This provides the replacement of defective part or machine after the machine becomes incapable of further operation. Break down maintenance is the easiest method to follow and it avoids the initial costs and training personnel and other related upfront costs.
1.1.2 Draw backs of break down maintenance are:
1. Failures are untimely
2. Since machine is allowed to run till to failure repair is more expensive. Sometimes total replacement is required
3. Failures may be catastrophic. Hence loss will be more.
4. Production loss will be more, as it requires more time to restore normalcy.
5. It reduces the life span of the equipment
1.2.1 Preventive maintenance:
In preventive maintenance, maintenance is scheduled on calendar or hours to run and is performed irrespective of machine condition.
1.2.2 Advantages:
1. Down time of machine is reduced by 50-80% 2. Lower expenses of over pay may same as much as
30%
3. Increases the equipment life expectancy.
4. Reduces the maintenance cost by reducing the capital spending by 10-20%, labour cost by 10%, material cost by 30%
5. Improve the employee’s safety
6. Preventive maintenance results in a catastrophic failure and down time is required to complete all scheduled maintenance costs
International Journal of Emerging Technology and Advanced Engineering
Website: www.ijetae.com (ISSN 2250-2459,ISO 9001:2008 Certified Journal, Volume 3, Issue 1, January 2013)
171
1.2.2 Disadvantages:1. Periodically dismantling of each and every critical machine is expensive and time consuming. 2. It may lead to unnecessary inspections even on
healthy machine also which may further lead to more complications.
3. It is difficult to predict time interval between
inspections which ultimately may lead to break down maintenance.
4. Preventive maintenance alone cannot eliminate break down. The causes of equipment failure change with the passage of time. Fig 1 shows the failure rate curve which is also called as bath tub curve. Failure rate is taken on ordinate and time is taken on abscissa when the equipment is new there is high failure rate due to design and manufacturing errors. Failure rate increases once again since the equipment approaches the end of its failure.
FIG 1: BATH TUB CURVE
1.3.1 Predictive Maintenance:
Trending and analyzing machinery parameters we can detect the developing problems in early stages. Hence repair works can be carried out before failure of a machine.
1.3.2 Advantages:
1. Shut down can be done at convenient times
2. Work schedule can be prepared for mobilizing men , tools and replacement parts before shut down reducing machinery down time
3. Identifying problem, costly trial and error procedures to solve a problem can be avoided.
4. Machine in good running condition can run continuously as long as problem develops
1.3.3 Disadvantages:
1. Require skilled labour 2. It is costly affair.
For all machines common characteristic is vibrations and hence vibrations become a powerful tool in implementing predictive maintenance program
The vibration predictive maintenance program has four steps:
i. Detection ii. Analysis iii. Correction iv. Conformation
i. Detection:
First select all available critical machines in the plant. Prepare a schedule for all these machines for data collection identify bearing locations of the machine train motor non drive end, MND, FNDE, FDE, PNDE, PDE, etc…identify the directions where vibration data is collected like H, V, A etc. define which vibration parameters are to be collected via displacement, velocity, acceleration etc. after doing all these start collecting vibrating data and related data and record them. Collect the data for every fortnight or monthly or so by trending and interpreting the data, identify source of vibration.
ii. Analysis:
After identifying the source of vibrations analyze to pin point the root cause for vibrations. This can be achieved by eliminating process. Follow confirmative procedures in support of analysis.
iii. Correction:
Open and inspect he machine at a convenient time and make necessary corrections
iv. Confirmation:
After corrections put the machine in service and again collect vibration data and look for elimination of source.
II. CONDITION MONITORING
Condition monitoring is the process of monitoring a parameter of condition in machinery, such that a significant change is indicative of a developing failure. The most efficient way of doing predictive maintenance is by condition monitoring technique. Predictive maintenance by condition monitoring technique will boost up the availability of the equipment; will increase the efficiency and industrial safety.
The various steps involved in condition monitoring program are:
1. Plant survey feasibility report.
International Journal of Emerging Technology and Advanced Engineering
Website: www.ijetae.com (ISSN 2250-2459,ISO 9001:2008 Certified Journal, Volume 3, Issue 1, January 2013)
172
3. Select optimum monitoring techniques there is a large number of parameters that can be collected and analyzed in order to determine machine condition. No single parameter has given consistent results.
4. Establish a predictive maintenance programmed-inspection schedule, data handling, administration and training.
5. Set acceptable condition, data and lists based on machine severity charts, manufacturer’s specializations and experience.
6. Machine base line measurements are taken after many corrective actions.
7-10. Routine monitoring programmed – the object of this is to detect significant deterioration in machine condition through trend analyzed of the measured data.
11. Condition analysis – is in the death analysis of machine condition often involving the joint application of number of techniques. The object of this is to confirm the existing fault, location and the corrective action required.
12. Fault correction – having diagnosed the fault it is required to schedule the corrective action. The details of the identified faults should feedback to the diagnosis and improve the diagnostics capabilities of the program.
CONDITION MONITORING TECHNIQUES:
Vibration monitoring
Debris analysis lubes oil analysis
Corrosion monitoring
Thermography
Visual monitoring
Contaminant monitoring
Performance and behavior monitoring
This paper is mainly focused on vibration monitoring which is the most commonly used method for rotating machines
2.1. Vibration Monitoring:
Vibration monitoring is well established method for determining the physical movement of the machine or structure. Vibration is the best indicator of overall mechanical condition and the earliest indicator of the developing defects. There are other indicators like temperature, pressure and flow and oil analysis. If only one indicator is to be used to monitor machine health then vibration is usually the best choice.
All rotating and reciprocating machines vibrate either to a smaller or to a greater extent. Machines vibrate because of defects or in accuracies in the system. When the inaccuracies are more it results in increased vibration.
Each kind of defect produces vibration, characterized in a unique way. Therefore, recording vibration level of a machine indicates the condition of the machine.
2.1.1 Advantages of condition monitoring over planned maintenance:
Improved system reliability Decreased maintenance cost
Decreased number of maintenance operations causes decreasing of human error influence
2.1.2 Disadvantages:
High installation costs, for minor equipment items more than value of equipment
Unpredictable maintenance periods are causing costs to be divide un equally
Increased number of parts(CBM installation ) that need maintenance and checking
III. VIBRATION ANALYSIS
Vibration analysis is a non -destructive technique which helps early detection of machine problems by measuring vibration.
Vibration analysis has been proven to be the most successful predictive tool when used on rotating equipment, both in increasing equipment availability and reliability. In order to maximize the finite life associated with rolling element bearings and optimize equipment production life, excessive wear caused by misalignment, unbalance, and resonance must be minimized. The presence of trained vibration specialists with equipment to conduct analysis will form the basis of a strong vibration program.
3.1 Causes for vibrations:
1. Change in direction with time, such as a force generated by a rotating unbalance.
2. Change in amplitude with time, such as unbalanced magnetic forces generated in an induction motor due to unequal air gap between the motor armature and stator.
3. Result in friction between rotating and stationary machine components is much.
4. Cause impacts, such as gear tooth contact or the impacts generated by the rolling elements of a bearing passing over a flaw in the bearing raceways.
International Journal of Emerging Technology and Advanced Engineering
Website: www.ijetae.com (ISSN 2250-2459,ISO 9001:2008 Certified Journal, Volume 3, Issue 1, January 2013)
173
3.2 Machine vibration:A vibrating object moves to and fro, back and forth motion. We experience many
An example in our daily life like vehicles driven on rough terrain vibrates.
[image:4.612.98.240.248.329.2]There are various ways we can tell that something is vibrating. We can touch a vibrating object and feel the vibration. We may also see the back and forth movement of a vibrating objects.
Fig 2: Machine Vibrations
3.3 Sources of vibration:
1. Misalignment of couplings, bearings and gears. 2. Unbalance of rotating components.
3. Looseness
4. Deterioration of rolling element bearings 5. Gear wear
6. Eccentricity of rotating components such as "v "belt pulleys or gears.
3.4. Detection by Vibration Analysis:
1 Unbalance(Static, Couple, Quasi-Static), 2 Misalignment(Angular, Parallel, Combination) 3 Eccentric Rotor, Bent Shaft
4 Mechanical Looseness, Structural Weakness, Soft Foot
5 Resonance, Beat Vibration 6 Mechanical Rubbing
7 Problems Of Belt Driven Machines 8 Journal Bearing Defects
9 Antifriction Bearing Defects (Inner race, Outer race, Cage, Rolling Elements)
10Problems of Hydrodynamic & Aerodynamic Machines (Blade or Vane, Flow turbulence, Cavitations)
11Gear Problems (Tooth wear, Tooth load, Gear eccentricity, Backlash, Gear misalignment, Cracked or Broken Tooth)
12 Electrical Problems of AC & DC Motor (Variable Air Gap, Rotor bar Defect, Problems of SCRs) 3.5 Methods to detect causes of vibration:
There are literally hundreds of specific mechanical and operational problems that can result in excessive machinery vibration. However, since each type of problem generates vibration in a unique way, a thorough study of the resultant vibration characteristics can go a long way in reducing the number of possibilities hopefully to a single cause. A simple, logical and systematic approach that has been proven successfully in pinpointing the vast majority of the most common day-to-day machinery problems.
Interpreting the Data:
Obtain horizontal, vertical and axial spectrums at each bearing of the machine train in order to take the readings.
Once horizontal, vertical and axial FFTs have been obtained for each bearing of the machine train, the obvious next question is: "What is this data telling me?" Essentially, amplitude-versus-frequency spectrums serve two very important purposes in vibration analysis:
1.Identify the machine component (motor, pump, gear box, etc.) of the machine train that has the problem And 2.Reduce the number of possible problems from several hundred to only a limited few.
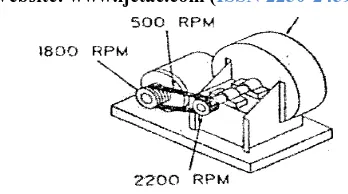
Identifying the Problem Component Based On Frequency:
Figure3 shows a fan operating at 2200 RPM, belt driven by an 1800 RPM motor. The rotating speed of the belts is 500 RPM. Assume that a vibration analysis was performed on this machine and the only significant vibration detected had a frequency of 2200 CPM or 1 x RPM of the fan. Since the vibration frequency is exactly related to fan speed, this clearly indicates that the fan is the component with the problem. This simple fact eliminates the drive motor, belts and possible background sources as possible causes.
International Journal of Emerging Technology and Advanced Engineering
Website: www.ijetae.com (ISSN 2250-2459,ISO 9001:2008 Certified Journal, Volume 3, Issue 1, January 2013)
[image:5.612.75.249.127.224.2]174
Fig 3: Components generate different vibration frequenciesIdentifying the Problem Component Based On Amplitude:
Identifying the fan as the source of vibration based on vibration frequency was quite easy in the above example because of the notable differences in the rotating speeds of the various machine components. The obvious question, of course is: What about direct-coupled machines that is operating at exactly the same speed?" In this case, the component with the problem is normally identified as the one with the highest amplitude. For example, consider a motor direct coupled to a pump. Examining the analysis data, it is noted that the highest vibration amplitude on the motor is 1.0 in/sec compared to 0.12 in/sec on the pump. In this case, the motor is clearly the problem component since its vibration amplitude is nearly 8 times higher than that measured on the pump.
In general, the machine component that has the problem is usually the one with the highest amplitude of vibration. The forces that cause vibration tend to dissipate in strength at increased distances from the source.
However, there are exceptions to this rule such as the example given earlier where a vertical pump was vibrating excessively due to a resonance problem with the discharge piping. In this case, the exciting force was actually generated by the motor/pump but was being amplified by the resonant condition of the piping.
Another exception to this rule involves misalignment of direct coupled machines. Sir Isaac Newton's third law of physics slates that "whenever one body exerts a force on another, the second always exerts on the first a force which is equal in magnitude but oppositely directed." In other words, "for every action, there is an equal but opposite reaction." In the case of coupling misalignment, the vibratory force (action) is generated at the coupling between the driver a driven components. As a result, the "reaction" forces on the driver and driven unit; will be essentially equal, resulting in reasonably comparable vibration amplitudes. The only reason one component may have a slightly higher or lower amplitude than the other is because of differences in the mass and stiffness characteristics of the two components.
International Journal of Emerging Technology and Advanced Engineering
Website: www.ijetae.com (ISSN 2250-2459,ISO 9001:2008 Certified Journal, Volume 3, Issue 1, January 2013)
175
TABLE 1Vibration Frequencies andthe Likely Causes
Comparing Horizontal and Vertical Readings:
When comparing the horizontal and vertical data, it is important to take note of how and where the machine is mounted and also, how the bearings are mounted to the machine. Basically, the vibration analyst needs to develop a "feel" for the relative stiffness between the horizontal and vertical directions in order to see whether the comparative horizontal and vertical readings indicate a normal or abnormal situation. Machines mounted on a solid or rigid base may be evaluated differently than machines mounted on elevated structures or resilient vibration isolators such as rubber pads or springs.
Comparing Radial (Horizontal & Vertical) Data to Axial Data:
The second important comparison that needs to be made to tri-axial analysis data is how the radial (horizontal and vertical) readings compare to the axial readings.
Relatively high amplitudes of axial vibration are normally the result of
1. Misalignment of couplings 2. Misalignment of bearings
3. Misalignment of pulleys or sheaves on belt drives 4. Bent shafts
Unbalance of "overhung" rotors.
IV. SPIKE ENERGY
When flaws or defects appear in a bearing, the resulting vibration will appear as a series of short duration spikes or pulses such .The duration or "period" of each pulse generated by an impact depends on the physical size of the flaw; the smaller the flaw, the shorter the pulse period will be. As the size of the defect increases, the period of the pulse becomes longer.
Frequency
in Terms Of RPM Most Likely causes Other possible causes & Remarks
lx RPM
Unbalance
I) Eccentric journals, gears or pulleys 2) Misalignment or bent shaft if high axial vibration
2 x RPM
Mechanical looseness
1) Misalignment if high axial vibration 2) Reciprocating force
3 x RPM
Misalignment
Usually a combination of misalignment and excessive
Axial clearance (looseness).
Less than lx RPM
Oil Whirl(Less than1/2 x RPM)
I) Bad drive belts 2) Background vibration 3) Sub-harmonic resonance 4) "Seat" Vibration
Synchronous (A.0 line frequency) Electrical Problems
Common electrical problems include broken rotor bars,
eccentric rotor, and unbalanced phases in poly-phase
Systems, unequal air gap.
2xSynch.Frequency Torque Pulses Rare as a problem unless resonance is excited
Many Times RPM (Harmonically Related Freq.)
Bad Gears, Aerodynamic Forces, Hydraulic forces, Mechanical Looseness, Reciprocating Forces
Gear teeth times RPM of bad gear Number of fan blade times RPM Number of impeller vane times RPM
May occur at 2, 3, 4 and sometimes higher harmonics High Frequency (Not Harmonically Related) Bad Anti-Friction bearing
1) Capitation, recirculation and flow turbulence causes
International Journal of Emerging Technology and Advanced Engineering
Website: www.ijetae.com (ISSN 2250-2459,ISO 9001:2008 Certified Journal, Volume 3, Issue 1, January 2013)
176
A short-term (40 millisecond sec) time waveform that was taken on a ball bearing with a small nick purposefully ground on the bearing inner race way. It can be seen that the pulse period lasts only a few microseconds (1 microsecond = 1 millionth of a second). Of course, if the period of a vibration signals is-known, the frequency of the vibration can be found by simply taking the inverse of the period. For example, if it takes 1/3600 minute to complete one cycle of a vibration, then the vibration frequency is 3600 cycles per minute (CPM) or the inverse of the period.
In the case of the pulses generated by the bearing defects, since the pulse periods are so short, the period inverses (frequencies) are typically very high. To illustrate, a MICRO-FLAW is generally defined as a defect that is so small that it is essentially invisible to the naked eye. The pulses generated by a micro-flaw are typically less than 10 micro-seconds (i.e. 10 millionths of a second). By taking the inverse of a 10 micro-second pulse, the fundamental frequency becomes 100,000 Hz (TOOK Hz) or 6,000,000 CPM. As bearing deterioration progresses, the flaw gets larger. The next stage is a MACRO-FLAW or one that is detectable with the naked eye. Since the macro-flaw is larger, the duration or period of the pulse generated is longer and, thus, the fundamental pulse frequency is lower. Typically, a macro-flaw will generate a pulse with a period exceeding 20 microseconds, resulting in a fundamental pulse frequency of 50K Hz (3,000,000 CPM) or less. Of course, as the bearing defects continue to increase in size, the resultant pulse periods become even longer resulting in a decrease in fundamental pulse frequency. Experimentation has revealed that by the time the fundamental pulse frequency has reduced to approximately 5k Hz (300,000 CPM), bearing deterioration has generally reached severe levels.
With the above facts in mind, the following outlines the basic features of the SPIKE ENERGY (abbreviated gSE). Since the frequencies of bearing vibration are very
high, utilize a vibration acceleration signal from an accelerometer transducer.
Incorporate a "band-pass" frequency filter that will electronically filter out frequencies above 50K Hz (3,000,000-GPM) -and below 5K Hz (300,000 CPM). By eliminating frequencies above 50K HI, micro-flaws, defects that are undetectable with the naked eye, will not affect the measurement. In other words, when the SPIKE ENERGY (gSE) measurements reveal a significant increase, a visual inspection of the bearing should provide confirmation with a visible flaw.
Since the spike-pulse signals generated by bearing defects have very low RMS values, incorporate a true peak-to-peak detecting circuit instead of an RMS detecting circuit.
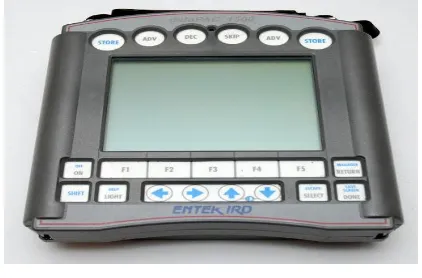
V. DATA PAC 1500
Instrument: Data Pac 1500
Company: ENTEK IRD
Feature: portable data collector / analyzer in a small lightweight package.
[image:7.612.339.550.315.454.2]Data PAC 1500 is part of Entek's complete range of monitoring products and services to all industry segments worldwide. The data PAC 1500 is a fully featured portable data collector.
Figure 4: DATA PAC 1500
Supported Measurements:
Acceleration
Velocity
Displacement
G Spike Energy (GSE)
Temperature
Thrust or axial position
DC voltageVI. BEARING FREQUENCIES
The bearing frequencies can be calculated based on 4 typical components of bearings.
1. BALL PASS FERQUENCY OUTER RACE (BPFO)
2. BALL PASS FREQUENCY INNER RACE(BPFI) 3. BALL SPINNING FREQUENCY(BSF)
International Journal of Emerging Technology and Advanced Engineering
Website: www.ijetae.com (ISSN 2250-2459,ISO 9001:2008 Certified Journal, Volume 3, Issue 1, January 2013)
177
6.1 FORMULAS FOR BEARING FREQUENCIES:BPFO: (nb/2 - 1.2) rpm
BPFI: (nb/2 + 1.2) rpm
BSF: 1/2(nb/2 -1.2/nb) rpm
FTF: (1/2 – 1.2/nb) rpm
Where nb = no. of balls
Fig5 Rolling bearing element components.
Understanding Bearing Vibration
Example 1:
If you have the defect multipliers at your disposal, the process of calculating the defect frequency is as follows:
1. Look up the bearing number that is exhibiting the suspect vibration frequency on a table like the one below:
BEARING ID
NO.OF ROLLING ELEMENTS
FTF
BSF
BPFO
BPFI
9436 19 0.434 3.648 8.247 10.753
9437 19 0.434 3.648 8.247 10.753
9442 22 0.443 4.191 9.740 12.260
2. Multiply this number by the shaft speed mated with this bearing and you have the defect frequency that would be generated by a defect on the element in question. See Figure 7.4 9.740 x 351 rpm shaft speed = 3419 cpm
Outer race bearing defect
If the frequency and harmonics (multiples) of it are present on the vibration spectra, you most probably have an outer race bearing defect. It could be a spall on the raceway, electrical fluting, false brinelling acquired during bearing storage or equipment transport, etc.
Be advised that there will be occasions when the calculated defect frequencies don’t exactly match the bearing defect frequencies that appear in the vibration spectra. Typically this is due to higher than normal thrust loads which cause the bearing to run at a different contact angle. These abnormal thrust loads can be caused by sources such as mis-alignment.
Also, not all bearing manufacturers use the same number of rolling elements in a particular bearing size. The most common bearing problem is the outer race defect in the load zone; inner race faults are the next most common. It is very rare to see a fault at the bearings ball spin frequency or BsF.
Action step: The presence of any of these four fundamental fault frequencies should result in the repair technician replacing the bearing and ensuring the housing fits and shaft journals are within tolerance. Finally, it’s worth discussing the presence of mechanical looseness, which manifests itself as harmonics of 1x running speed, on a new or re- built bearing housing or journal. This indication of looseness could be coming from poor base mounting or one of the following:
1. Loose housing-to-outer race fits 2. Loose journal-to-inner race fits 3. Excessive internal bearing clearance
Sleeve Bearing Defects:
International Journal of Emerging Technology and Advanced Engineering
Website: www.ijetae.com (ISSN 2250-2459,ISO 9001:2008 Certified Journal, Volume 3, Issue 1, January 2013)
178
Figure6: Bad bearing fits between housing &outer race.Looseness from wear nd clearence problem
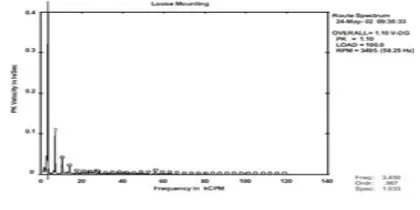
Clearance Problems In contrast, mechanical looseness caused by loose mounting bolts or cracks in the frame structure or bearing pedestal typically look like the spectrum in Figure 7
Fig7: Loose mounting (Structural Looseness)
Excessive looseness can also cause sub harmonic multiples at exactly 1/2 or 1/3 x rpm (.5x, 1.5x, 2.5x, etc.).
During bearing failure the harmonics are matched with taking higher resolution of the spectrum, if it is found to match with the spectrum it is said to be failure of bearing.
If the bearing failure occurs there will be little change in the velocity values, no changes may occur in displacement values but the spike energy value will be increasing. During normal cases the spike energy value should be less than one (gSE <1)
If the frequency (cpm) values are less than 600 displacement values are taken into criteria
If the frequency (cpm) values are in between 600-60000 velocity values are taken into criteria
If the frequency (cpm) values are >60000 spike energy values come into criteria.
VII. SPECIFICATION OF FDFAN
FD-MOTOR:
SPEED: 993 RPM
VOLTS: 3300V
CURRENT: 229amps
TYPE: induction motor.
FREQUENCY: 50HZ
PHASE: 3PHASE.
FD-FAN:
TYPE: axial reaction
MEDIUM HANDLED: fresh air
SPPED: 1480 rpm
NO.OF BLADES: 23
BEARING NO: NU226E
HUB DIA: 1100mm
OUTERDIA: 1800mm
[image:9.612.62.272.341.446.2]Displacement readings taken on 17 oct 2012.
Table 2
vibration data sheet of FD fan 6B before rectification
S.No Position
Velocity (mm/s)
Displacement (µm)
H V A H V A
1 MNDE 8.71 0.751 1.75 108 363 14.8
2 MDE 9.93 1.35 1.66 111 8.34 14.6
3 HUB1 8.83 1.8 5.14 108 20.5 14.5
4 HUB2 9.24 1.76 5.41 114 20.8 16.2
Where,
MNDE: motor non drive end MDE: motor drive end. Hub1: fan drive end Hub 2: fan non drive end H: horizontal
V: vertical A: axial
Limits as per ISO 10816 part2 (mm/sec peak) Good : 0 to 6.0 mm/sec Satisfactory: 6.0to 12.3mm/sec Alarm : 12.3 to 16.0 mm/sec
Not Permitted : >16.0mm/sec
VIII. THE FOLLOWING ARE THE SPECTRUMS TAKEN TO
OBSERVE THE CAUSE OF VIBRATIONS
8.1 Spectrums
International Journal of Emerging Technology and Advanced Engineering
Website: www.ijetae.com (ISSN 2250-2459,ISO 9001:2008 Certified Journal, Volume 3, Issue 1, January 2013)
179
Velocity spectrum MNDE vertical directionVelocity spectrum MNDE axial direction
Velocity spectrum MDE horizontal direction
Velocity spectrum MDE vertical direction
Velocity spectrum MDE axial direction
Velocity spectrum FDE (HUB 1) horizontal direction
Velocity spectrum FDE (HUB 1) vertical direction
Velocity spectrum FDE (HUB 1) axial direction
Velocity spectrum FNDE (HUB 2) horizontal direction
International Journal of Emerging Technology and Advanced Engineering
Website: www.ijetae.com (ISSN 2250-2459,ISO 9001:2008 Certified Journal, Volume 3, Issue 1, January 2013)
180
Velocity spectrum FNDE (HUB 2) axial direction8.2 Observations from the spectrums
1) Overall vibrations of all the bearings are in in satisfactory zone as per ISO 10816.
2) Horizontal direction vibration at MNDE, MDE.HUB1, and HUB2 are high side.
3) 1X Frequency is dominant in spectrums in all positions 4) Observed ½ Blade pass frequency and 1XBlade pass frequency and its side harmonics are present
in HUB1 and HUB2 in axial direction
5) High vibrations in Horizontal direction at MNDE, MDE, HUB1 and HUB2 due to any flow obstruction in fan blades or may be unbalance in fan rotor
Remarks:
-1) Check for partial close/open position of dampers in connected duct.
2) check for impeller
Suggestion:
1) Check for bearing vibration and temperatures regularly until correction.
IX. TABLE
Table3
Spike energy readings before rectification:
S.NO Date Position Direction Reading 1
17/10/12
MNDE HORIZONTAL 5.21
2 MDE HORIZONTAL 0.0339
3 HUB-1 HORIZANTAL 0.067 4 HUB-2 HORIZANTAL 0.033
RPM: 1487
Normal value: <0.8 at 1500 rpm SAFE LIMITS OF spike energy (gSE):
3600 rpm: 1.4 gSE
1900 rpm: 0.70 gSE
1200 rpm: 0.50 gSE
900 rpm: 0.35 gSE
600 rpm: 0.25 gSE
X. ACTION TAKEN BASED ON REPORT
1. Since each unit runs with 2 FD fans, FD fan-6B is stopped for one day and the failure bearing was removed.
2. Maintenance was taken up and the FD fan was replaced with new bearings.
3. After replacement again the vibrations data was collected.
XI. VIBRATION READINGS AFTER RECTIFICATION
STAGE VI Load: 210MW Freq: 49.98Hz
[image:11.612.83.253.133.238.2]11.1 vibration reading after changing of bearings:
Table 4
vibration data sheet of FD fan 6B after rectification
S. No Date Position Velocity (mm/sec) Displacement(µm)
19/10/2012
H V A H V A
1 MNDE 1.1 0.404 0.421 11.5 1.8 2.29
2 MDE 1.18 0.445 0.411 12.5 1.36 2.29
3 FDE(HUB1) 1.36 0.205 0.552 17.1 2.16 2.35
4 FNDE(HUB2) 1.37 0.228 1.19 17.6 2.67 2.94
11.2 Observations:
1. The values of velocity were reduced from the satisfactory zone to good zone.
2. The high side displacement values are reduced into desired limits.
Limits as per ISO 10816 part2 (mm/sec peak) Good : 0 to 6.0 mm/sec Satisfactory : 6.0to 12.3mm/sec
International Journal of Emerging Technology and Advanced Engineering
Website: www.ijetae.com (ISSN 2250-2459,ISO 9001:2008 Certified Journal, Volume 3, Issue 1, January 2013)
181
11.3 spectrums after rectification:Velocity spectrum of MNDE in horizontal direction
Velocity spectrum of MNDE in vertical direction
Velocity spectrum of MNDE in axial direction
Velocity spectrum of MDE in horizontal direction
Velocity spectrum of MDE in vertical direction
Velocity spectrum of MDE in axial direction
Velocity spectrum of MNDE in vertical direction
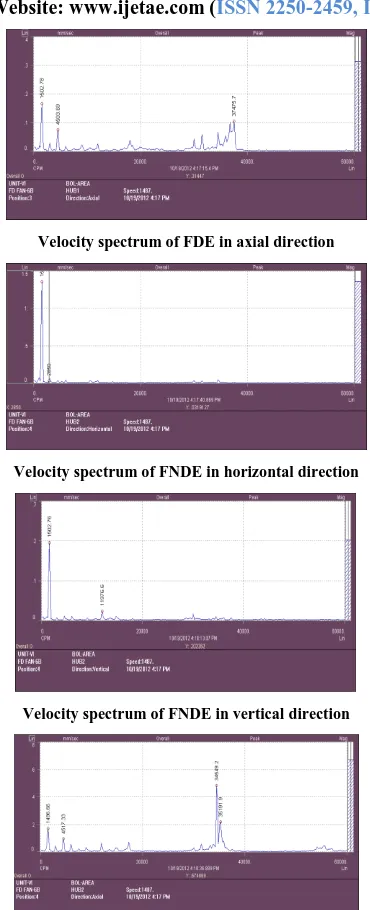
Velocity spectrum of FDE in horizontal direction
International Journal of Emerging Technology and Advanced Engineering
Website: www.ijetae.com (ISSN 2250-2459,ISO 9001:2008 Certified Journal, Volume 3, Issue 1, January 2013)
182
Velocity spectrum of FDE in axial directionVelocity spectrum of FNDE in horizontal direction
Velocity spectrum of FNDE in vertical direction
Velocity spectrum of FNDE (HUB 2) in axial direction
11.4 Spike energy readings:
[image:13.612.75.260.121.576.2]RPM: 1487
Table 5
spike energy readings after rectification.(19/10/12)
S.NO Position Direction Reading 1 MNDE HORIZONTAL 0.032 2 MDE HORIZONTAL 0.066 3 HUB-1 HORIZANTAL 0.0061 4 HUB-2 HORIZANTAL 0.011
Normal value: <0.8 at 1500 rpm
SAFE LIMITS OF spike energy (gSE): 3600 rpm: 1.4 gSE
1900 rpm: 0.70 gSE 1200 rpm: 0.50 gSE 900 rpm: 0.35 gSE 600 rpm: 0.25 gSE
11.5 Observations after rectification:
1. Vibration frequencies are in normal ranges.
2. Even after the rectification the peaks are obtained at MNDE, MDE, FDE, and FNDE in axial direction which indicate high axial vibrations are existed. 3. The vibrations caused in axial direction indicate bent
shaft or angular misalignment
4. The rectification of bent shaft or angular misalignment can be done only during overall shut down period of the unit.
International Journal of Emerging Technology and Advanced Engineering
Website: www.ijetae.com (ISSN 2250-2459,ISO 9001:2008 Certified Journal, Volume 3, Issue 1, January 2013)
183
XII. RESULTS
The results that were obtained after rectification of FD fan are as follows:
12.1 Velocity displacement data Data before Rectification:
S. No
Date Position Velocity (mm/sec) Displacement(µm)
17/10/2012
H V A H V A
1 MNDE 8.71 0.751 1.75 108 3.63 14.8
2 MDE 8.93 1.35 1.66 111 8.34 14.6
3 FDE(HUB1) 8.83 1.8 5.14 108 20.5 14.5
4 FNDE(HUB2) 9.24 1.76 5.41 114 20.8 16.2
Data After Rectification
S. No
Date Position Velocity (mm/sec) Displacement(µm)
19/10/2012
H V A H V A
1 MNDE 1.1 0.404 0.421 11.5 1.8 2.29
2 MDE 1.18 0.445 0.411 12.5 1.36 2.29
3 FDE(HUB1) 1.36 0.205 0.552 17.1 2.16 2.35
4 FNDE(HUB2) 1.37 0.228 1.19 17.6 2.67 2.94
Limits as per ISO 10816 part2 (mm/sec peak) Good : 0 to 6.0 mm/sec
Satisfactory : 6.0to 12.3mm/sec
Alarm : 12.3 to 16.0 mm/sec Not Permitted : >16.0mm/sec
By observing the above tabular forms higher values of velocity and displacement are obtained indicating a flaw in the machine, which were rectified based on several considerations which were further discussed.
12. 2 Spike energy data
Spike energy data collected before rectification:
S.N O
Date Position Direction Reading 1
17/10/12
MNDE HORIZONTAL 5.21
2 MDE HORIZONTAL 0.0339
3 HUB-1 HORIZANTAL 0.067
4 HUB-2 HORIZANTL 0.033
Spike energy data collected after rectification:
S.NO Date Position Direction Reading 1
19/10/12
MNDE HORIZONTAL 0.032
2 MDE HORIZONTAL 0.066
3 HUB-1 HORIZANTAL 0.0061 4 HUB-2 HORIZANTAL 0.011
RPM 1487.
SAFE LIMITS OF spike energy (gSE): 3600 rpm: 1.4 gSE
1900 rpm: 0.70 gSE 1200 rpm: 0.50 gSE 900 rpm: 0.35 gSE 600 rpm: 0.25 gSE
The spike energy data is taken into criteria because of frequency obtaining >600000 rpm. The equipment used in V.T.P.S is set only to horizontal direction, where the readings are obtained.
International Journal of Emerging Technology and Advanced Engineering
Website: www.ijetae.com (ISSN 2250-2459,ISO 9001:2008 Certified Journal, Volume 3, Issue 1, January 2013)
184
12.3 Spectrum data
In Vertical Direction at MNDEBefore Rectification
After Rectification
In vertical direction at MDE:
Before Rectification
After Rectification
Even after the replacement of the failed bearing with new bearing there are still some irregular harmonics observed in axial direction at MDE, FDE (HUB 1) and FNDE (HUB 2). The irregular harmonics in axial directions are shown in the following spectrums. In axial direction at MDE:
Before Rectification
After Rectification
In axial direction at FDE (HUB-1):
Before Rectification
International Journal of Emerging Technology and Advanced Engineering
Website: www.ijetae.com (ISSN 2250-2459,ISO 9001:2008 Certified Journal, Volume 3, Issue 1, January 2013)
185
In axial direction at FNDE (HUB-2)Before Rectification
After Rectification
Harmonics Observed In Axial Direction Indicates – Bending Of Shaft
XIII. CONCLUSION
From the above observed graphs the irregular harmonics are observed in the axial direction, which indicates that the bending of the shaft caused due to bearing failure. After replacement of bearing, the previously occurred irregular harmonics were vanished in horizontal and vertical direction.
The replacement of bearing requires a temporary pause of FD-FAN (about a day). But the replacement of the shaft requires the overall shut down of the unit. So instant replacement of shaft is not possible as of bearing. So due this factor the fan is allowed to run with irregular harmonics in axial direction which doesn’t affect majorly for a period of time, and can be rectified during overall maintenance.
REFERENCES
[1 ] ISSN:0975-5462 International Journal of Engineering Science and Technology
[2 ] http://electromotores.com/PDF/InfoT%C3%A9cnica/EASA/Underst anding%20Bearing%20Vibration%20Frequencies.pdf
[3 ] http://www.bsahome.org/Archive/html/escreports/VibrationAnalysis .pdf
[4 ] R.bandal,”state of art in monitoring and rotating machines”ISMA2002, International conference on noise & vibration engineering.
[5 ] R.k Biswas , December 2006 “vibration based condition monitoring on rotating machines”
[6 ] A.v Barkov, N.A.Barkov & Yu.Azovtsev, in 1997, “vibration based condition monitoring on rotating machines.
[7 ] DR.NTTPS vibration analysis material [8 ] http://www.vibrotek.com/ref.htm [9 ] Mechanical vibrations-G.K.Groover
[10 ] Tanver(ref8), P.J.School of engineering, Durham university, gave areview on CMBS on rotating electrical machines
[11 ] Jones.N.B Yu-HuaLI (ref 1). Department of engineering, university of Leicester, Leisister, UK had presented a paper on reciprocating compressor condition monitoring.
International Journal of Emerging Technology and Advanced Engineering
Website: www.ijetae.com (ISSN 2250-2459,ISO 9001:2008 Certified Journal, Volume 3, Issue 1, January 2013)
186
AUTHORBIOGRAPHY:
N. DILEEP is pursuing 4/4 B.Tech in Department of Mechanical Engineering at V.R.Siddhartha Engineering College, vijayawada , India. Participated in various technical paper presentations and secured 2nd prize for “Green Buildings” paper presentation.
K. ANUSHA is pursuing 4/4 B.Tech in Department of Mechanical Engineering at V.R.Siddhartha Engineering College, vijayawada , India. Participated in various technical paper presentations and secured 1st prize for “OTEC” paper presentation.
C.SATYA PRATHIK is pursuing 4/4 B.Tech in Department of Mechanical Engineering at V.R.Siddhartha Engineering College, vijayawada , India.
B.KARTHEEK is pursuing 4/4 B.Tech in Department of Mechanical Engineering at V.R.Siddhartha Engineering College, vijayawada, India.