Quality of School Exam Tests Based on Item
Response Theory
Siti Asiah Tjabolo1,*, Lian Gafar Otaya2
1Department of Islamic Education Management, Postgraduate Program, IAIN Sultan Amai Gorontalo, Indonesia
2Department of Islamic Education Management, Faculty of Tarbiyah and Teaching Training, IAIN Sultan Amai Gorontalo, Indonesia
Received July 22, 2019; Revised August 29, 2019; Accepted September 15, 2019
Copyright©2019 by authors, all rights reserved. Authors agree that this article remains permanently open access under the terms of the Creative Commons Attribution License 4.0 International License
Abstract
The purpose of this study was to describe the quality of school exam questions based on the 1-parameter model, 2-parameters model, and 3-parameters model of the elementary school examination in Bontomarannu District, Gowa Regency. This type of research is quantitative descriptive research. The sample of this study was 237 sheets of elementary school participants' answer sheets. The data of this study were collected using documentation collection techniques. Based on the 1-parameter model, in the aspect of difficulty level, as much as 80% of elementary school exam items are in the good category, and 20% are in the bad category. Then on the 2-parameter model, on the aspect of item discrimination, as much as 55% of elementary school exam items are in the good category, and 45% are in the bad category. Finally, in the 3-parameter model, in the aspect of the guessing factor as much as 25% the items of the elementary school exam are in the good category, and 75% are in the bad category.Keywords
School Exam, Item Response Theory1. Introduction
School exams are activities that are routinely held every year at school. Examination is one of the important parts of the education system [1]. Exams are activities that cannot be separated from measurements. The measurement results will be the basis or reference in making the assessment. School examinations are held as an effort to evaluate whether students have reached the standards of learning competency and academic knowledge. This is very important because it is considered as a basis for followers to a higher class. In addition, examinations can maintain motivation for students to learn better and base predictions about the future education and talents of students [2,3]. Examination is carried ou t to measure the successes and
weaknesses of students obtained during the education process. The accuracy of the results of the examination can be influenced by various things such as: instrument quality, scoring accuracy, good supervision, and other factors.
School exams are very closely related to assessment activities. Assessment is a very important activity in the implementation of education [4]. In order to make a good assessment and measurement, a good instrument is needed. Quality test instruments will provide accurate measurement results about student success. If the instrument used is not good, it will produce a measurement error [5]. Tests as a tool to measure the ability of students to become very important. The test is a way of assessment that is designed and carried out to students at a certain time and place and in conditions that meet certain conditions. The test is usually given to students after participating in educational activities during a certain time interval. Assessment must be supported by good measuring instruments. The measuring instrument commonly used in assessment activities in schools is a test. Therefore, a test instrument must be of quality to support the implementation of a quality assessment.
Item response theory is one approach used to determine the quality of a measuring instrument. The main advantages of Item response theories are having rich statistical tools to analyze the quality of educational tests and psychological measurement scales [6]. Item response theory (IRT) is a probability model that correctly answers certain abilities in an item parameter [7]. The item response theory is based on two postulates, first is the ability of a test participant in a question can be predicted (explained) by factors called traits, and second is the relationship between the ability of a test participant and the underlying traits in an item can explained through a function called the item characteristics function or item characteristic curve [8,9,10].
shape the characteristics of items that do not depend on the characteristics of the test group, test scores that can describe the ability of the test participants who are not dependent on the characteristics of the test. In addition, item response theory is stated based on items rather than based on tests and provides a measure of accuracy in each ability score [12]. The models used in item response theory are logistical models. There are three logistic models, namely 1-parameter model, 2-parameters model, and model 3-parameters model. The difference between the three models is in the number of parameters used in describing the characteristics of the item.
1.1. Statement of the Problem
School exam questions are a very urgent instrument to analyze. This is due to the fact that the school exam is an important activity and gives influence to the graduation of students. School exams are large-scale activities and are the obligation of each school. Because of the importance of the role of the school exam, the quality of the instruments used in the activity must be clear. This is the reason for the selection of school examinations to be analyzed in the implementation of this research.
Although several studies have been conducted related to the analysis of items in Bontomarannu Subdistrict, Gowa Regency, but based on observations so far it has been shown that until now there has not been an analysis of items using item response theory approaches, especially in elementary school exam questions. During this time, the analysis of the questions carried out using only the classical test theory, and even this is rarely done. The lack of teacher understanding regarding the analysis of questions with the modern approach has become an obstacle that has been felt so far. The lack of understanding is caused by several things, among others, the lack of socialization reaching teachers related to item response theory based analysis techniques, in addition to the practices carried out so far in schools dominated by classical test theory. Therefore the results of this study are considered very important to be a reference in applying the theory response items in identifying test quality. The purpose of this study was to describe the quality of school exam questions based on the 1-parameter model, 2-parameters model, 3-parameters model and describe the test information funtion of the elementary school examination in Bontomarannu District, Gowa Regency.
2. Research Method
2.1. Type of Research
This type of research is quantitative descriptive research, namely the type of research that aims to describe the condition, symptoms, or certain groups based on
numerical data obtained from the test results. In this study the symptoms will be described as the quality of social science questions used in the primary school examination in Bontomarannu Subdistrict, Gowa Regency in the 2017/2018 Academic Year.
2.2. Research Sample
The sample of this study was 237 sheets of elementary school participants' answer sheets. Exam questions consist of 20 items (15 multiple-choice items and 5 items about completing). Taking this answer sheet only focused on the Class II participants. In addition, the answer sheet was obtained from 5 elementary schools in Bontomarannu District, Gowa Regency.
2.3. Data Collection Techniques
The data of this study were collected using documentation collection techniques. This means that the data is available beforehand at the research location (schools). The school exam questions analyzed were a set of questions that had been developed previously by the organizers of the school examinations, so that the researchers did not develop the instruments in this study.
2.4. Data Analysis
Data analysis was performed using the item response theory approach. There are four components that become the unit of analysis in this study. These components include: characteristics of items based on model 1-parameter, characteristics of items based on 2-parameters model, characteristics of items based on 3-parameters model, and test information function. In the 1-parameter model the probability of a test participant to correctly answer a question item is determined by one item characteristic, namely the level of difficulty of the item. The function characteristics of the 1P model items are formulated as follows [12,13,14].
with,
Pi (
θ
): probability answers correctly item i on abilityθ
bi : difficulty level parameter of item i
ai: item discrimination
n: the number of items D: 1,7
e: 2,718
by the following equation [12].
with,
Pi (
θ
): probability answers correctly item i on abilityθ
bi : difficulty level parameter of item i
ai: item discrimination
n: the number of items D: 1,7
e: 2,718
The 3-parameters is determined by three parameters, namely:
b
i ,a
i, andc
i withc
i is a pseudo guess parameter. This model is stated by the following [12].with,
Pi (
θ
): probability answers correctly item i on abilityθ
bi: difficulty level parameter of item i
ai: item discrimination
ci: psedo guess parameter
n: the number of items D: 1,7
e: 2,718
3. Results
This study discusses the quality analysis of elementary school exam questions in Bontomarannu District, Gowa Regency. The quality of the questions referred to in this study is the characteristic of test items based on the item response theory approach. There are three things that become the unit of analysis in this study, namely the characteristics of test items based on 1-parameter model, 2-parameters model, and 3-parameters model. The results of the study based on these three things are stated as follows.
3.1. Characteristics of Items Based on 1-Parameter Model
This 1-parameter model is a logistic model where only the level of item difficulty is observed while the item discrimination is assumed to be the same for all items and guesses are assumed to be equal to 0. The characteristics of the items referred to in this section are item characteristics based on 1-parameter model namely parameter b or level of difficulty. The results of the quality estimation of school exam questions are reviewed from 1-parameter model are presented as follows.
Table 1 presents the characteristics of items based on
the 1-parameter model. A good bi value or item difficulty
[image:3.595.307.538.214.467.2]index ranges from -2 to 2 [12]. The value close to the negative line indicates that the item is too easy, the closer it is to the positive line, the more difficult the item is. If viewed from 1-parameter model, the categorization of school exam questions can be stated that as many as 16 items or about 80% of school exam questions are in the good category, and as many as 4 items (7,10,15,17) or around 20% of school exam questions are in the bad category.
Table 1. Results of 1-parameter Model Estimation
Items ai bi ci
Item_1 1.14 -1.25 0 Item_2 1.14 -1.37 0 Item_3 1.14 -0.74 0
Item_4 1.14 0.57 0
Item_5 1.14 -0.80 0
Item_6 1.14 0.32 0
Item_7 1.14 -2.87 0
Item_8 1.14 0.61 0
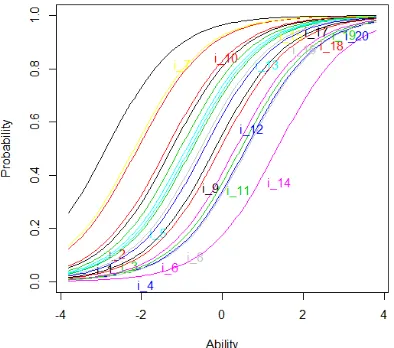
[image:3.595.324.521.547.721.2]Item_9 1.14 -0.18 0 Item_10 1.14 -2.09 0 Item_11 1.14 0.45 0 Item_12 1.14 -0.05 0 Item_13 1.14 -0.88 0 Item_14 1.14 1.35 0 Item_15 1.14 -2.17 0 Item_16 1.14 -0.54 0 Item_17 1.14 -2.87 0 Item_18 1.14 -0.05 0 Item_19 1.14 -1.04 0 Item_20 1.14 -0.44 0 Another thing that can be presented regarding the quality of school exam items is the item characteristic curve. The characteristic curve of the item presents opportunities for certain abilities to correctly answer certain items. The following presents the characteristic curve of the item with 1-parameter model.
Figure 1 presents the characteristic curve for 20 item items based on the 1-parameter model. Based on the data and information, it can be stated that the easiest item is item number 7. Likewise the most difficult item is item number 14. More clearly the following is a comparison of the characteristic curve of the item.
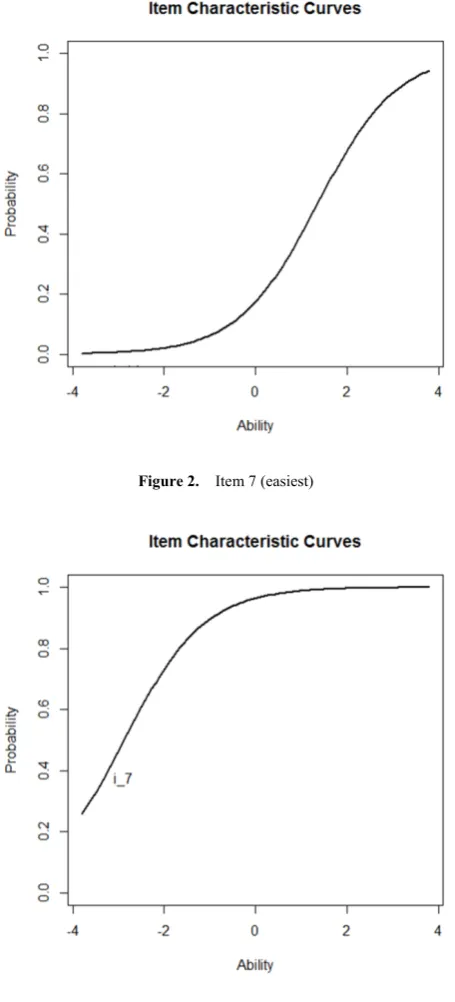
Figure 2. Item 7 (easiest)
Figure 3. Item 14 (hardest)
Figure 2 and Figure 3 show a comparison between the easiest items with the hardest items. Item 7 is said to be the easiest because the item number 7 has a great chance to be answered correctly by the low-ability test taker so that it is said to be easy. On the contrary, item 14 is the most
difficult because on the curve it appears that the question item has a great chance to be answered correctly only on test participants who are highly capable so that it is said to be difficult.
3.2. Characteristics of Items Based on 2-Parameters Model
After obtaining item quality information in 1-parameters model, then the next step is to estimate the quality of items based on 2-parameters model. This model is a logistic model where in addition to the level of item difficulty observed also item discrimination estimation is done while the guess is assumed to be still equal to 0. The results of school exam quality estimation results are viewed from the 2-parameters model are presented as follows.
Table 2 presents the characteristics of items based on the 2-parameters model. In the 2-parameters model. The discrimination ai coefficients of good items are between 0
[image:4.595.61.289.174.676.2]– 2 [8,13]. If viewed from 2-parameter model, the categorization of school exam questions can be stated that as many as 11 items or about 55% of school exam questions are in the good category, and as many as 9 items (1,3,5,7,10,12,14,15, 17) or around 45% of school exam questions are in the bad category.
Table 2. Results of 2-parameters Model Estimation
Items ai bi ci
Item_1 2.23 -0.82 0 Item_2 1.22 -1.23 0 Item_3 2.01 -0.50 0
Item_4 0.88 0.74 0
Item_5 2.94 -0.50 0
Item_6 0.74 0.50 0
Item_7 27.87 -1.35 0
Item_8 0.57 1.11 0
Item_9 1.22 -0.12 0 Item_10 3.26 -1.16 0 Item_11 0.98 0.56 0 Item_12 2.08 -0.01 0 Item_13 1.44 -0.71 0 Item_14 -0.28 -4.32 0 Item_15 2.22 -1.38 0 Item_16 1.38 -0.43 0 Item_17 2.66 -1.65 0 Item_18 1.66 -0.00 0 Item_19 1.06 -1.02 0 Item_20 0.77 -0.52 0
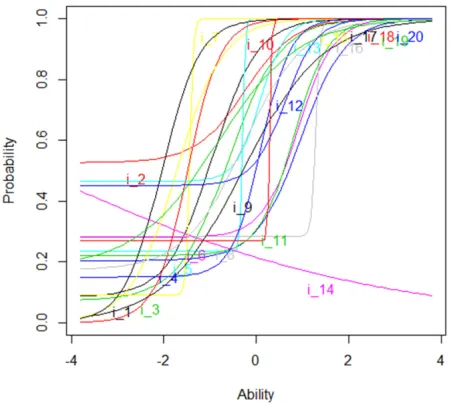
[image:4.595.307.537.407.714.2]2-parameters model.
Figure 4. The Characteristic Curve of The Item with 2-parameters Model
Figure 4 shows the distribution of the characteristics of items totaling 20 items on the school exam. Of all these items have different characteristics. There are items that are ideal (good), there are also items that are not good. One good item is Item 9. The characteristic curve of the item can be observed as follows.
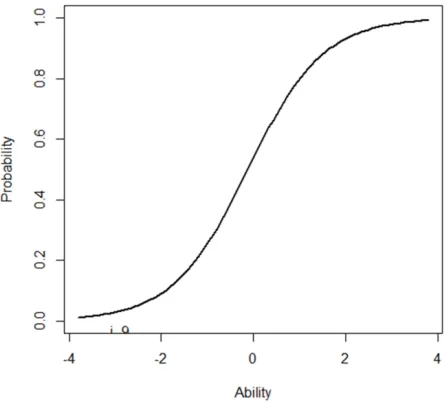
Figure 5. Characteristic Curve ofItem 9
Figure 5 displays the Item 9 characteristic curve. The item is one of the good items because it meets the criteria of 2-parameters both the difficulty level and the item discrimination. In addition, curve lines show the rational thing that low-ability participants have a low probability of answering correctly. Conversely, high-ability participants have a high probability of answering items correctly.
Besides the good items, the analysis of the 2-parameter
model also found items that were not good. The item is item 14. As a comparison, the following characteristics curve Item 14 is presented.
Figure 6. Characteristic Curve ofItem 14
Figure 6 displays the Item 9 characteristic curve. Item 14 is one example of a bad item. Item. The item has a negative difference power coefficient. This shows that on Item 14, participants who have low ability actually have a high probability of answering the item correctly while participants who have high ability actually have a low probability of answering the item correctly. This condition is not very good in carrying out examinations and assessments.
3.3. Characteristics of Items Based on 3-Parameters Model
This 3-parameter model is a logistical model where in addition to the level of difficulty of the item and the discrimination item observed also controls the guessing factor. The results of estimating the quality of school exam questions in terms of the 3-parameter model are presented as follows.
Table 3 presents the characteristics of items based on the 3-parameters model. In the 3-parameters model. In a test item, the value of ci (guess) is between 0 and 1. An
item can be said to be good if the value of ci is not more
than 1 / k (k is the number of choices) [10, 13]. In the case of this study, the number of choices in multiple choice questions was as many as three choices. For that, the cut of value (ci) is 0.33.
[image:5.595.311.537.123.324.2] [image:5.595.63.287.424.625.2]Table 3. Results of 3-parameters Model Estimation
Items ai bi ci
Item_1 2.05 -0.94 0.08 Item_2 1.87 -0.24 0.52 Item_3 1.81 -0.59 0.07 Item_4 2.04 0.95 0.20 Item_5 37.61 -0.29 0.23 Item_6 2.58 0.90 0.28 Item_7 25.59 -1.43 0.09 Item_8 21.80 1.29 0.28 Item_9 1.16 -0.29 0.00 Item_10 2.81 -1.48 0.00 Item_11 2.63 0.80 0.22 Item_12 3.14 0.10 0.15 Item_13 3.67 0.09 0.46 Item_14 -0.27 -4.79 0.00 Item_15 1.98 -1.72 0.00 Item_16 1.55 -0.28 0.17 Item_17 2.45 -2.04 0.00 Item_18 52.65 0.30 0.26 Item_19 1.13 -0.85 0.18 Item_20 2.86 0.61 0.45 In addition to the presentation of the characteristics of the items described in the previous table, the quality of school exam items can also be described through an item characteristic curve. The characteristic curve of the item is presented with the probability of a certain ability to correctly answer a certain item. The following is presented the characteristic curve of the 3-parameter model.
Figure 7. The Characteristic Curve of The Item with 3-parameters Model
Figure 7 presents the characteristic curve for 20 item
[image:6.595.306.532.251.681.2]items based on the 3-parameter model. Based on the results of analysis of items related to guessing parameters (see Table 3), information is obtained that basically the items that have the greatest probability of guessing are item number 2 with the parameter coefficient c of 0.52. This shows that the item has the probability of a correct answer with a guess of 52%. The opposite occurs in items 3,9,15,16, and 19 with the parameter coefficient c smaller than the cut of value and fulfilling the criteria for the level of difficulty and the item discrimination. This shows that the item has the probability of the correct answer with guesses that are less than 33% (0.33 as the cut of value). Figure 8 and Figure 9 are examples of two items with different guessing parameters.
[image:6.595.62.290.506.708.2]Figure 8. Item 2 (good category)
Figure 9. Item 3 (bad category)
is one example of a good item. Item 2 only has a guess probability of 0.07. This is certainly very small or less than the cut of value which is 0.33. In general, only 5 items have good quality in the 3-parameters model. These items are Item 3, Item 9, Item 15, Item 16, and Item 19.
4. Discussion
4.1. 1-Parameter Model
After conducting the data analysis stage for the results of the research that has been stated in the previous description, then to interpret the results of the research in this section, a discussion of three research questions has been described previously. The first research question in this study was related to the quality of school exam questions in terms of the 1-parameter model. Empirical findings show that as many as 16 items or 80% of school exam questions are in the good category, and as many as 4 items or as much as 20% of school exam math questions are in the bad category.
Theoretically, The 1-parameter model only centers on the difficulty level of the item [15]. The level of item difficulty is often associated with the ability of the respondent with the difficult level of the item, namely there are items that are difficult, there are items that are medium, and there are easy items. easy to difficult, items that are too easy to give poor results are classified as items that are not good, as well as items that are too difficult will also give poor results and certainly are in the bad category [16]. The value of bi or a good item difficulty index ranges from -2 to
2. The value that approaches the negative line indicates that the item is too easy, as well as getting closer to the positive line indicating that the item is getting harder [12]. Based on the study, 16 (80%) test items used in the primary school examination in Bontomarannu Subdistrict, Gowa Regency were in a good category based on the 1-parameter model.
4.2. 2-Parameters Model
The second research question in this study was related to the quality of school exam questions in terms of the 2-parameter model. Empirical findings indicate that as many as 11 items (55%) the school exam questions have good discrimination item and there are 9 items (45%) school exam questions that have different items that are not good.
A good item is an item that can distinguish participants who control the material with those who lack mastery of the material. A good item is an item that can distinguish participants who mastery of the material with those who lack mastery of the material. Good items can be answered correctly by participants who are highly skilled, and answered incorrectly by low-ability participants [17].
Discrimination of items have relevance to the abilities of participants. The discrimination parameter is used to
distinguish the level of ability of the test participants [18, 19]. If an item has good discrimination, then it can be used further to estimate the level of ability of the participant and is worth considering as a calibrated measurement scale [20]. If the various views are related to the results of this study, it can be explained that in the 2-parameter model, as many as 11 items (55%) in the elementary school examination in Bontomarannu Subdistrict, Gowa Regency has been able to distinguish the ability of the test participants well.
4.3. 3-Parameters Model
The third research question in this study related to the quality of school exam questions in terms of the 3-parameter model. Empirical findings indicate that only 5 items or 25% of school exam questions are in the good category and meet the 3-parameter criteria, and as many as 15 items or 75% of school exam questions are in the category of not good or 3-parameter criteria.
The main characteristic of the 1-parameter model is the estimation of the guess factor (ci). Guessing is one of the
problems studied in multiple choice tests [21, 22, 23]. This is very important because guesses can have an impact on increasing measurement errors [23]. Therefore, each test item in the implementation of a school exam is expected to have the smallest guess of the foctor. The results of this study found that only five items or around 5% met the criteria of the 3-parameter model. This shows that the 3-parameter model is not suitable with the results of the assessment data on the primary school exam in Bontomarannu Subdistrict, Gowa Regency.
Empirically in the findings of this study shows that most items have a high guessing factor so that they can increase the measurement error until the results of the assessment obtained are of less quality. It is based on that the main purpose of the test is to measure the student's real ability. But sometimes it happens in the case of multiple choice students answer not because of their knowledge, but because it only looks for luck by guessing the answer choices. In addition, it was found that the teacher instructed students to fill in all the answers and not leave blanks or leave items without answers. Such conditions will certainly have an impact on the increased measurement error. Therefore the best measurement is a reduction which has the smallest error.
5. Conclusions
3-parameter model, in the aspect of the guessing factor as much as 25% the items of the elementary school exam are in the good category, and 75% are in the bad category.
The advice presented in this study is to analyze the quality of the questions, especially those that have broad or large-scale coverage such as school examinations, it is recommended to use the item response theory approach. To obtain quality items in the question development process, it is expected to consider the parameters used in the item response theory, given the advantages of response theorem items that are independent of both the item characteristics, and the ability characteristics.
As a suggestion for the development of question items in the future, the teacher must write the items carefully with attention to various aspects, namely: material, construction and language. For example for the material aspect, the item must be in accordance with the competency indicator we want to measure, for the construction aspect, the item must be clearly instructed for example: clear graphs, clear formulas, clear images and clear formulations. For aspects of language, the development of items must pay attention to aspects of the correct language such as no double meaning and do not contain biased sentences. Some of these things are very important so that the item questions developed can measure students' real abilities and can distinguish between students who master the content of the material being tested with students who lack mastering the content of the material being tested.
Acknowledgements
Thank you to our institution IAIN Sultan Amai Gorontalo for providing maximum support to realize this research. Appreciation for headmasters and teachers who have helped document research data.
REFERENCES
G. Schwerdt, L. Woessmann. The information value of [1]
central school exams. Economics of Education Review, Vol. 56, 65–79, 2017.
Q. Suleman, R. Gul, S. Ambrin, F. Kamran. Factors [2]
contributing to examination malpractices at secondary school level in Kohat Division, Pakistan. Journal of Education and Learning, Vol. 9, No. 2, 165-182, 2015. T. Jabbarifar. The importance of classroom assessment and [3]
evaluation in educational system. Proceedings of the 2nd International Conference of Teaching and Learning, 1-9, 2009.
S. Rahman, M. A. A. Majumder. Is it assessment of learning [4]
or assessment for learning?. South East Asia Journal Of Public Health, Vol. 4, No. 1, 72-74, 2014.
S. Ramadhan, D. Mardapi, C, Sahabuddin, R. Sumiharsono. [5]
The estimation of standard error measurement of physics final examination at senior high schools in Bima Regency Indonesia. Universal Journal of Educational Research, Vol. 7, No. 7, 1590-1594, 2019.
A. A. Bichi1, R. Talib. Item response theory: An [6]
introduction to latent trait models to test and item development. International Journal of Evaluation and Research in Education, Vol. 7, No. 2, 142-151, 2018. P. Eaton, K. Johnson, B. Frank, S. Willoughby. Classical test [7]
theory and item response theory comparison of the brief electricity and magnetism assessment and the conceptual survey of electricity and magnetism. Physical Review Physics Education Research, Vol. 15, 1-19, 2019.
R. K. Hambleton, H. Swaminathan. Item Response Theory: [8]
Principles and Applications, Kluwer Academic Publishers, Boston, 1985.
L. Crocker, J. Algina. Introduction to classical and modern [9]
test theory, Rinehart and Winston, Inc, New York, 1986. C. L. Hulin, F. Drasgow, C. K. Parson. Item Response [10]
Theory: Application to Psychological Measurement, Dow Jones-Irvin, Homewood, 1983.
A. Pathak, K. Patro, M. Pathak, M. Valecha. Item response [11]
theory, Journal of Computer Science and Mobile Computing, Vol. 2, No. 11, 7-11, 2013.
R. K. Hambleton, H. Swaminathan, R. H. Rogers. [12]
Fundamentals of Item Response Theory, Sage Publications, London, 1991.
H. Retnawati. Teori Respons Butir dan Penerapannya: [13]
Untuk Peneliti, Praktisi Pengukuran dan Pengujian, Mahasiswa Pascasarjana, Nuha Medika, Yogyakarta, 2014. F. B. Baker. The Basic of Item Response Theory, ERIC [14]
Clearinghouse on Assessment and Evaluation, Chicago, 2001.
R. Rezaee1, M. Shafiayan, P. Jafari, N. Zarifsanaiey. [15]
Invariance of item difficulty parameter estimates based on classical test theory and item response theory, Journal of Advanced Pharmacy Education & Research, Vol. 8, No. 2, 156-161, 2018.
D. S. Naga. Pengantar Teori Skor pada Pengukuran [16]
Pendidikan, Gunadarma, Jakarta, 1992.
O. O. Adedoyin, T. Mokobi. Using irt psychometric analysis [17]
in examining the quality of junior certificate mathematics multiple choice examination test items, International Journal of Asian Social Science, Vol. 3, No. 4, 992-1011, 2013.
F. M. Yang, S. T. Kao. Item response theory for [18]
measurement validity, Shanghai Archives of Psychiatry, Vol. 26, No. 3, 171-177, 2014.
E. Garcia, S. Aryal, E. S. Almaguer, D. Rohr, S. T. Walters. [19]
Use of the IRT model to validate test items from a technology assisted health coaching program, Open Journal of Statistics, Vol. 8, No. 3, 519-532, 2018.
J. P. Lalor, H. Wu, H. Yu. Building an evaluation scale using [20]
E. S. Martin, G. D. Pino, P. D. Boeck. IRT Models for [21]
Ability-Based Guessing, Applied Psychological Measurement, Vol. 30, No. 3, 183-203, 2006.
A. D. E. Obinne. Using IRT in determining test item prone to [22]
guessing. World Journal of Education, Vol. 2, No. 1, 91-95, 2012.
T. W. Chiu, G. Camilli. Comment on 3PL IRT adjustment [23]