THE PERFORMANCE OF SOFT COMPUTING TECHNIQUES
ON CONTENT-BASED SMS SPAM FILTERING
WADDAH WAHEEB HASSAN SAEED
A thesis submitted in partial
fulfillment of the requirement for the award of the Degree of Master of Computer Science (Soft Computing)
Faculty of Computer Science and Information Technology Universiti Tun Hussein Onn Malaysia
iv
ABSTRACT
v
ABSTRAK
vi
CONTENTS
TITLE i
DECLARATION ii
ACKNOWLEDGEMENT iii
ABSTRACT iv
ABSTRAK v
CONTENTS vi
LIST OF TABLES x
LIST OF FIGURES xi
LIST OF SYMBOLS AND ABBREVIATIONS xii
LIST OF APPENDICES xiii
CHAPTER 1 INTRODUCTION 1
1.1
Overview 11.2
Problem Statement 21.3
Aim of Research 51.4
Objective of Research 51.5
Scope of Research 51.6
Significance of Research 6vii
CHAPTER 2 LITERATURE REVIEW 8
2.1
Introduction 82.2
Fuzzy Logic 92.2.1 Fuzzy Similarity 10
2.2.2 T-norms and S-norms 11
2.3
Artificial Neural Network 132.3.1 Neuronal Model 13
2.3.2 Activation Functions 14
2.3.3 Multilayer Perceptron 15
2.3.4 Back-propagation Algorithm 16 2.3.5 Scaled Conjugate Gradient 16
2.4
Support Vector Machine 192.4.1 Support Vector Classification 20 2.4.2 Radial Basis Function Kernel 24
2.5
Content-based Filtering for SMS Spam 242.6
Chapter Summary 27CHAPTER 3 METHODOLOGY 28
3.1
Introduction 283.2
Data Collection 293.3
Data Preprocessing 303.3.1 Removal of Duplicated Messages 31 3.3.2 Removal of non-English Messages 32
3.3.3 Lower case Conversion 32
3.3.4 Feature Abstraction Replacement 32
viii
3.3.6 Stemming 33
3.4
Dimensionality Reduction 333.5
Data Partition 353.6
Training and Testing 363.6.1 SMS Text Message Representation 36 3.6.2 Training Fuzzy Similarity Model 37 3.6.3 Training Artificial Neural Network Model 38 3.6.3.1 Number of Input and Output Units 39 3.6.3.2 Activation Function 39 3.6.3.3 Inputs and Outputs Scaling 39 3.6.3.4 Number of Hidden Layers and Neurons 40 3.6.3.5 Parameters Setting 40 3.6.4 Training Support Vector Machines Model 41 3.6.4.1 SVM Kernel Parameters Searching 41
3.7
Model Selection 423.7.1 True Positive Rate against False Positive Rate 42
3.7.2 F1Score 43
3.7.3 Matthews Correlation Coefficient 43
3.8
Chapter Summary 44CHAPTER 4 DATA ANALYSIS AND RESULTS 45
4.1
Introduction 454.2
Experimental Design 454.3
True Positive Rate against False Positive Rate Analysis 464.4
F1Score Analysis 48ix
4.6
Feature Characteristics Analysis 514.7
Classification Time Analysis 524.8
Additional Testing Using NUS SMS Corpus 524.9
Chapter Summary 53CHAPTER 5 DISCUSSION AND CONCLUSIONS 54
5.1
Introduction 545.2
Novelty and Research Contribution 55 5.2.1 Selecting Feature Subsets Using Gini Index Metric 55 5.2.2 Applying Soft Computing Techniques for SMSSpam Filtering with Selected Feature Subsets 55 5.2.3 Evaluating Soft Computing Techniques
Perfor-mance for SMS Spam Filtering Using Suitable
Measures 56
5.3
Recommendations for Future Work 565.4
Chapter Summary 57REFERENCES 58
x
LIST OF TABLES
2.1 T-norms and s-norms operators 12
3.1 Class information of the collected data sets 30 3.2 Number of instances before and after removal of
message duplicates
31
3.3 Number of instances before and after removal of non-English messages
32
3.4 List of replaced features 33
3.5 Two-way contingency table of a feature fi and a class C j for binary classification
34
3.6 Number of hidden neurons with its number of features 40 3.7 C and γ values with its number of features 41 4.1 Number of instances in training and testing data set 46 4.2 TPR against FPR classifiers comparison with its number
of features [AUC]
47
4.3 Number of instances before and after data preprocessing steps in NUS SMS corpus
53
A.1
xi
LIST OF FIGURES
2.1 An example of ANN with one hidden layer 14
2.2 Neuronal model 14
2.3 Linearly separable training data 20
2.4 Possible separating hyperplanes with their associated margins
21
2.5 Support vectors 22
2.6 Two class nonlinear separable problem 23
3.1 Research framework 29
3.2 Extract taken from the removal of message duplicates 31
3.3 Representation of vector space model 36
4.1 TPR against FPR classifiers comparison with 150 features
48
4.2 True positive rate classifiers comparison with 150 features
49
4.3 False positive rate classifiers comparison with 150 features
49
xii x
LIST OF SYMBOLS AND ABBREVIATIONS
ANN - Artificial Neural Network AUC - Area Under Curve
FN - False Negative FP - False Positive FPR - False Positive Rate
MCC - Matthews Correlation Coefficient MLP - Multilayer Perceptron
MSE - Mean Squared Error RBF - Radial Basis Function
ROC - Receiver Operating Characteristic SCG - Scaled conjugate gradient
SMS - Short Message Service SVM - Support Vector Machine TN - True Negative
xiii
LIST OF APPENDICES
APPENDIX TITLE PAGE
A Performance of ANN classifier using range of hidden neurons with its number of features
65
B Performance of SVM classifier using range of C and γ values with its number of features
67
C
CHAPTER 1
INTRODUCTION
1.1 Overview
SMS which stands for “Short Message Service” is a service used to send short text messages from a mobile device or via the web and received by a mobile device. This service is a very popular type of communication between people, for its ease of use, its fast response and its relatively cheap cost as compared to telephone calls. Thus in 2012, 7.5 trillion SMS messages were sent all over the world (GSMA, 2013). However, not all SMS messages are solicited - mobile device users receive legitimate messages as well as unwanted messages which are called spam.
SMS spam forms 20 to 30% of all SMS traffic in some parts of Asia such as China and India (GSMA, 2011). Some methods are used to combat SMS spam such as black-and-white listing, traffic analysis and content-based filtering (Delany, Buckley & Greene, 2012). According to Delanyet al.(2012), content-based filtering method is required to counteract the increasing threat of SMS spam and to avoid the disadvantages of other filtering methods. Content-based filtering uses some techniques to analyze the contents of SMS text messages to ascertain whether it is legitimate or spam.
ex-2
tracted from SMS data sets with imbalanced class distribution problems. However, not much attention has been paid to handle the imbalanced class distribution problem which could produce unsuitable features or a huge number of features in order to filter SMS spam. Therefore, a suitable feature selection metric is required to select proper features from the imbalanced data sets in order to improve filtering performance. Be-sides a suitable feature selection metric, a suitable technique which has been engaged in spam filtering is essential. Soft computing techniques have been present in almost every domain (e.g. spam filtering) and their ability have been proven (El-Alfy & Al-Qunaieer, 2008; Guzella & Caminhas, 2009).
In this research, the main purpose is to find out how well suited soft computing techniques, namely Fuzzy Similarity, Artificial Neural Network (ANN) and Support Vector Machines (SVMs) are for content-based SMS spam filtering using appropriate features which are selected by the Gini Index metric.
1.2 Problem Statement
SMS spam is a growing problem. Mobile device users in the U.S. received 1.1 billion spam messages in 2007 (Hart, 2008) and 4.5 billion in 2011 (Kharif, 2012). SMS spam can be defined as unsolicited bulk electronic messages. Unsolicited means the recip-ients receive unwanted messages without their consent and bulk because the sender sends many identical messages to different recipients (Bueti, 2005).
3
packages in some countries in Asia with easy solutions to send bulk messages (Delany et al., 2012) as well as mobile network operators who contribute to this problem by
sending messages about their offers.
SMS spam has caused mobile device users and mobile network operators a lot of problems. Spam messages irritate mobile users by filling their in-boxes and wasting their time reading and deleting the messages (Uysalet al., 2012). Some types of SMS spam try to bill mobile device users by tricking them to call premium rate numbers or subscribe to services or, trick the users to call certain numbers to collect confidential information from them to use for other purposes — called phishing (GSMA, 2011). Other types of SMS spam attack mobile device users to steal their money (GSMA, 2011), subject smart-phones to viruses (Murynets & Jover, 2012), harm mobile device operating systems, spread viruses to other mobile device users and violate privacy. Fur-thermore, in some countries mobile device users pay to receive their messages which may include spam messages (Almeida et al., 2011). Mobile network operators also suffer from this problem. They are prone to lose their subscribers because the perfor-mance of the network is affected by the load that SMS spam generates which in turn delay the reception of legitimate messages (Yadav et al., 2011). They may also lose some revenue because they cannot bill the sender(s) a termination fee as some types of SMS spam are sent from fraudulent addresses (Cisco, 2005).
dis-4
card legitimate messages that may be sent from a black-listed phone number(s) (Uysal et al., 2012). Another anti-spam method uses traffic analysis to compare the
sub-scriber’s volume of sent messages to volume limits, but spammers avoid this method by sending low volumes of messages to observe the operator system response and then determine the operator’s volume limit policies (Delany et al., 2012). Content-based filtering method uses some techniques to analyze SMS text message content in order to decide whether it is legitimate or spam. The spammer tries to avoid these filters by making sophisticated message modifications (GSMA, 2011), however, content-based filtering still needs to avoid spammers’ traffic analysis tricks (Delany et al., 2012) as well as the black-and-white listing.
Many studies in the literature on content-based SMS spam filtering selected some features to represent SMS text messages and these selected features are extracted from SMS data sets with imbalanced class distribution problem. However, not much attention has been paid to handle the imbalanced class distribution problem which affect the characteristics and the size of the selected features and cause undesired per-formance. Therefore, in order to select suitable features from the imbalanced data sets, a suitable feature selection scheme is needed. The Gini Index (Shanget al., 2007) is a feature selection metric which has the ability to handle class imbalance problem by selecting proper features (Ogura, Amano & Kondo, 2011) which will improve the per-formance of filtering. Besides a suitable feature selection metric, a suitable technique which has been engaged in spam filtering is required. Soft computing techniques have been present in almost every domain (e.g. spam filtering) and their ability has been proven (El-Alfy & Al-Qunaieer, 2008; Guzella & Caminhas, 2009).
5
1.3 Aim of Research
The aim of this research is to filter SMS spam based on its contents using soft com-puting techniques, namely Fuzzy Similarity, Artificial Neural Network and Support Vector Machine with appropriate features selected by the Gini Index metric.
1.4 Objective of Research
In order to achieve the above mentioned aim of the research, the following are three research objectives:
i To select feature subsets using the Gini Index metric to represent SMS text mes-sages.
ii To apply soft computing techniques: Fuzzy Similarity, Artificial Neural Network and Support Vector Machine for SMS spam filtering with feature subsets selected in (i).
iii To compare the performance of (ii) in terms of True Positive Rate (TPR) against False Positive Rate (FPR), F1score and Matthews Correlation Coefficient (MCC).
1.5 Scope of Research
6
& Lin, 2011) were used to filter SMS spam. Results were compared in terms of True Positive Rate (TPR) against False Positive Rate (FPR) , F1score and Matthews Corre-lation Coefficient (MCC).
1.6 Significance of Research
The efficiency of soft computing techniques for SMS spam filtering with feature sub-sets selected by the Gini Index metric was examined in this research. Therefore, this research was conducted to establish a comparison in performance between Fuzzy Sim-ilarity, Artificial Neural Network and Support Vector Machine to investigate whether they can provide better results based on the selected feature subsets. The outcome of this research could contribute to verifying the best performance with small size features for SMS spam filtering and also contribute to future work in exploring the possibility of other feature selection metrics with soft computing techniques in SMS spam filtering.
1.7 Research Outline
The remaining part of this research is arranged in the following chapters. Chapter 2 is concerned with the relevant background in using content-based filtering technique for SMS spam filtering. Likewise, the chapter also highlights soft computing techniques, namely Fuzzy Similarity, Artificial Neural Network and Support Vector Machine.
Chapter 3 describes briefly steps on how to use soft computing techniques for SMS spam filtering, starting from data collection, data preprocessing, dimensionality reduction, data partition, training and testing, and selecting the best soft computing technique based on specified measures.
7
CHAPTER 2
LITERATURE REVIEW
2.1 Introduction
Many real world problems cannot be solved using hard computing techniques that deal with precision and certainty due to the fact that either these real-world problems are difficult to model mathematically or computationally expensive or require huge amounts of memory (Shukla, Tiwari & Kala, 2012). However, in some cases, human experts can deal with these problems successfully, e.g. face recognition. According to Zadeh, soft computing is “an emerging approach to computing, which parallels the remarkable ability of the human mind to reason and learn in an environment of uncertainty and imprecision” (Zadeh, 1994). From this definition, it is clear that soft computing is inspired by natural processes — especially the human brain. Therefore, soft computing techniques are needed to offer simple, reliable and low cost solutions to these types of problems with best results.
The development of soft computing techniques has attracted the interest of re-searchers from different disciplines over the past two decades. Soft computing tech-niques are applied in various domains such as bioinformatics, biomedical systems, data mining, image processing, machine control, robotics, time series prediction, wireless networks, etc.(Shuklaet al., 2012).
9
soft computing is applied (Shukla et al., 2012). A classification problem relates an object depending on its attributes into a known group or class. If there are many dif-ferences among the classes based on their attributes then the classification problem becomes quite simple. However, if the classes are quite similar, it becomes rather difficult. Therefore, soft computing is needed to offer solutions to these problems.
In this research, three soft computing techniques are used, namely Fuzzy Sim-ilarity, Artificial Neural Networks and Support Vector Machine to classify SMS text messages into two classes either legitimate or spam. These techniques have been used for email spam filtering (El-Alfy & Al-Qunaieer, 2008; Guzella & Caminhas, 2009). Therefore, in order to be more certain about these techniques, this chapter provides a discussion on them. This chapter also reviews the related works regarding the problem under study; the content-based filtering for SMS spam.
2.2 Fuzzy Logic
The concept of fuzzy logic was introduced in 1965 by Zadeh as a new concept to deal with problems in which the imprecision is the absence of precisely defined criteria of class membership (Zadeh, 1965). The acceptance of fuzzy logic started in the second half of the 1970s after the success of the first practical application which is called fuzzy control. Since then, fuzzy logic has been applied in many mathematical and practical areas including clustering, optimization, operations research, control and expert sys-tems, medicine, data mining and pattern recognition (Zimmermann, 2010).
10
the effectiveness of Fuzzy Similarity in content-based SMS spam filtering.
2.2.1 Fuzzy Similarity
Fuzzy similarity is adapted from the Rocchio algorithm (Rocchio, 1971). In this al-gorithm, a cluster center is created for each category from training samples and the similarity between each test sample and a category is measured using cosine coeffi-cient. In fuzzy similarity which was proposed by (Widyantoro & Yen, 2000), a fuzzy term-category relation is developed, whereby the Rocchio cluster is represented by a set of membership degree of words to a particular category. Based on the fuzzy term-category relation, the similarity between a document and a term-category’s cluster center is calculated using fuzzy conjunction and disjunction operators, and the calculated simi-larity represents the membership degree of document to the category.
Fuzzy similarity has two finite sets, a set of terms T =t1,t2,. . .,tn and a set of categories C =c1,c2, ...,cn. A fuzzy relation R : T ×C → [0,1] , whereby the membership value of the relation, which denotes byµR(ti,cj), specifies the degree of
relevance of termtito categorycj. The membership values of this relation are extracted from a training set.
Every training example in the training set is represented by a set of term-frequency pairsd={(t1,o1),(t2,o2), ...,(tm,om)}whereojis the occurrence frequency
of termtjin the document. Given a set of training documentsD, the membership value of the relationR(ti,cj), denoted by µR(ti,cj), is calculated as follows. First, all
docu-ments are grouped according to their category. Next, the occurrence frequency of each term for each category is collected by summing up the term frequency of individual documents in that category. Then the value of µR(ti,cj) is calculated from the total
number of occurrences of term ti in category cj divided by the total number of term
11
µR(ti,cj) =
∑
{wi∈dk∧dk∈D∧c(dk)=cj} wi
∑
{wi∈dk∧dk∈D} wi
(2.1)
Now, the membership values of fuzzy term-category relation are known, the similarity between a document and the category’s membership values of the term is given by Eq. (2.2),
Sim(d,cj) =
∑
tεdµR(t,cj)⊗µd(t)
∑
tεdµR(t,cj)⊕µd(t)
(2.2)
in which µd(t) is the membership degree that termt belongs tod for each term t in
d, ⊗and⊕denote fuzzy conjunction (t-norm) and fuzzy disjunction (s-norm) opera-tors, respectively. The category of the document is the category that has the highest similarity measure.
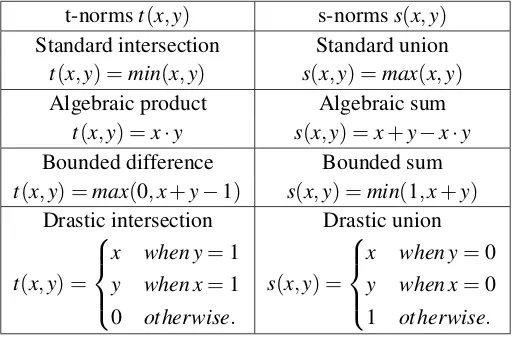
2.2.2 T-norms and S-norms
There are various t-norms and s-norms which are frequently used in the literature. In order to define any t-norms and s-norms operations, there are some axioms that should be satisfied. For t-norms operation, any binary operationt should satisfy the following axioms in order to be a t-norm operation, givenx,y,z ∈[0,1]:
Axiom1. t(x,1) =x (boundary condition) Axiom2. y≤z implies t(x,y)≤t(x,z) (monotonicity) Axiom3. t(x,y) =t(y,x) (commutativity) Axiom4. t(x,t(y,z)) =t(t(x,y),z) (associativity)
Almost the same axioms are defined for s-norms operation, givenx,y,z ∈[0,1]: Axiom1. s(x,0) =x (boundary condition)
12 Axiom4. s(x,s(y,z)) =s(s(x,y),z) (associativity)
The boundary condition is to range the results to be in [0,1]. Monotonicity and commutativity are to ensure that a decrease in the degree of membership in set X orY cannot produce an increase in the degree of membership in the intersection or union. Commutativity ensures that the fuzzy intersection and fuzzy union are symmet-ric therefore there is no consideration for order. The last axiom, associativity, allows taking the intersection of any number of sets in any order of pairwise grouping desired (Klir & Yuan, 1995).
Among the various t-norms and s-norms as shown in Table 2.1, the standard fuzzy intersection and the standard fuzzy union have special features. One of the de-sirable features is that the standard fuzzy intersection, min operator, and the standard fuzzy union, max operator, prevent the compounding of errors in the operands which is lacking in most alternative norms (Klir & Yuan, 1995). For example, If any errore is associated with the membership values µA(x)and µB(x), then the maximum error
associated with the membership value ofxinµA¯(x), µA∪B(x)andµA∩B(x)remainse
[image:23.595.191.448.534.703.2](Klir & Yuan, 1995). For that, the standard fuzzy intersection, min operator, and the standard fuzzy union, max operator, are selected in this research.
Table 2.1: T-norms and s-norms operators
t-normst(x,y) s-normss(x,y)
Standard intersection Standard union
t(x,y) =min(x,y) s(x,y) =max(x,y)
Algebraic product Algebraic sum
t(x,y) =x·y s(x,y) =x+y−x·y
Bounded difference Bounded sum
t(x,y) =max(0,x+y−1) s(x,y) =min(1,x+y)
Drastic intersection Drastic union
t(x,y) =
x when y=1
y when x=1
0 otherwise.
s(x,y) =
x when y=0
y when x=0
13
2.3 Artificial Neural Network
Artificial Neural Network (ANN) is inspired by biological nervous systems, such as the human brain; it can learn and memorize sets of data and adjust its weight matrices to build classifiers that can be used to classify unseen data.
ANN is a machine designed to model how the brain performs a particular task or function of interest (Haykin, 2009). It resembles the human brain in two ways: its knowledge is acquired through training process and this acquired knowledge is stored within inter-neuron connection strengths known as synaptic weights (Haykin, 2009). There are many advantages of ANN such as its high tolerance of noisy data (Han, Kamber & Pei, 2011), its ability to produce a reasonable output for unseen data, its non-linearity that allows it to model complex real world relationships, its input-output mapping in which the model structure is determined from data and its ability to adapt its weights to deal with changes in the environment by retraining (Haykin, 2009).
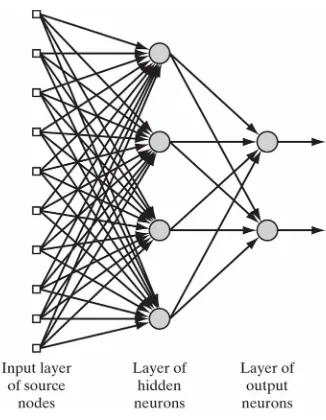
ANN generally consists of three sets of layers that are ordered in the network as input layer, hidden layer(s) and output layer. Each layer consists of a number of nodes or neurons (computation nodes) that are linked with neurons in the adjacent layers through weighted connections, as shown in Figure 2.1. The information flow during the training process is from the input layer to the output layer through the hidden layer(s).
2.3.1 Neuronal Model
14
Figure 2.1: An example of ANN with one hidden layer (Haykin, 2009)
Figure 2.2: Neuronal model (Haykin, 2009)
2.3.2 Activation Functions
[image:25.595.160.482.319.498.2]15
The most commonly used activation function to construct neural networks is the sigmoid function (Samarasinghe, 2006; Haykin, 2009). It is defined in the range [0 - 1] and its expression is given by Eq. (2.3).
f(v) = 1
1+e−v (2.3)
in whichuis the neuron’s output.
2.3.3 Multilayer Perceptron
Multilayer Perceptron (MLP) is a class of different architecture classes in ANN (Haykin, 2009). It consists of an input layer and one or more hidden layers and an output layer. Each layer consists of a number of nodes or neurons (computation nodes). Input nodes in the input layer represent the problem’s input variables, the output layer’s neurons represent the problem classes, while the hidden neurons in the hidden layer(s) help to capture the non-linear relationship between inputs and outputs.
16
2.3.4 Back-propagation Algorithm
The ability to learn from the environment and improve its performance during the train-ing (learntrain-ing) process is the most significant property in ANN (Haykin, 2009). Train-ing allows MLP to extract knowledge that is hidden in the samples. MLP is trained by supervised algorithms which show the network the desired output for each input. The training is conducted in two phases. In the first phase which is called the forward phase, inputs are presented to the network at the input layer and are then passed to the output layer via the hidden layer(s) to generate network output. In the second phase which is called the backward phase, the difference between the generated network out-put and the desired outout-put is calculated and this is called the network error. If this error is larger than an acceptable threshold, the error is back-propagated through the net-work to adjust its weights using an appropriate training method to minimize the error. In general, the training process is repeated until the optimum network performance is achieved (Samarasinghe, 2006).
2.3.5 Scaled Conjugate Gradient
Scaled conjugate gradient algorithm (SCG) can be used to train MLP. It uses second order information from ANN but requiresO(N)memory usage, where N is the num-ber of the network’s weight (Møller, 1993). Unlike gradient descent algorithm which relies on the user dependent parameters learning rate and momentum, SCG is a fully automated training algorithm which includes no critical user-dependent parameters (Møller, 1993).
17
The derivation of this algorithm is found in (Møller, 1993). Details of the SCG algorithm are as follows:
1. Initialize weight vector at the first iteration,w1, and set the values ofσ>0 which represents changes in weight for second derivative approximation,λ1>0 is the parameter for regulating the indefiniteness of the Hessian, and λ =0 . Set the initial conjugate solution, p1, and the steepest descent direction,r1, equal to the error surface gradient,p1=r1=−E0(w1). Setk=1 andsuccess=true.
2. Ifsuccess=truethen calculate second order informationseck:
σk =
σ
|pk|, (2.4a)
seck = E 0
(wk+σkpk)−E 0
(wk)
σk , (2.4b)
δk = pTkseck. (2.4c)
3. Scaleseck andδk
seck = seck+ (λk−λk)pk, (2.5a)
δk = δk+ (λk−λk)|pk|2. (2.5b)
4. Ifδk≤0 then make the Hessian matrix positive definite:
seck = seck+ (λk−2
δk
|pk|2)pk, (2.6a) λk = 2(λk−
δk
|pk|2), (2.6b) δk = −δk+λk|pk|2, (2.6c)
18
5. Calculate step sizeαk:
µk = pTkrk, (2.7a)
αk =
µk
δk. (2.7b)
6. Calculate the comparison parameter4k:
4k=
2δk[E(wk)−E(wk+αkpk)]
µk2 . (2.8)
7. If4k≥0 then a successful reduction in error can be made:
wk+1 = wk+αkpk, (2.9a)
rk+1 = −E0(wk+1), (2.9b)
λk = 0, (2.9c)
success = true. (2.9d)
7a. If k mod N =0 then restart algorithm by: pk+1 =rk+1, else create new conjugate direction:
βk =
|rk+1|2−r
k+1rk
µk
, (2.10a)
pk+1 = rk+1+βkpk. (2.10b)
7b. If4k≥0.75 then reduce the scale parameter: λk=0.5λk else a reduction
in the error is not possible:λk=λk,success= f alse.
8. If4k<0.25 then increase the scale parameter: λk=4λk
9. If the steepest descent directionrk6=0 then setk=k+1 and go to 2 else termi-nate and returnwk+1as the desired weights.
19
the weights of the network (including biases) (Haykin, 2009). It is difficult to know which training algorithm will produce the best accuracy for a given problem. The most widely used algorithm is the gradient descent algorithm. The standard gradient descent algorithm (Rumelhart et al., 1986) is generally very slow because it requires small learning rates for stable learning; momentum variation is introduced to improve the convergence of the standard algorithm by increasing the learning rates while main-taining stability, but it is still too slow for many practical applications (Demuthet al., 2008). The Levenberg-Marquardt training algorithm, due to (Levenberg, 1944) and (Marquardt, 1963), is a relatively fast algorithm with small and medium sized net-works (up to several hundred weights) but it needs enough memory (Demuth et al., 2008). If memory is a problem, then the SCG algorithm is recommended (Demuth et al., 2008). It is fast, has relatively modest memory requirements and performs well
over a wide variety of problems (Demuth et al., 2008). For these reasons, the SCG algorithm is used to train multilayer perceptron in this research.
2.4 Support Vector Machine
20
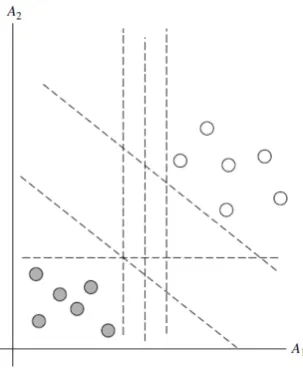
Figure 2.3: Linearly separable training data (Hanet al., 2011)
2.4.1 Support Vector Classification
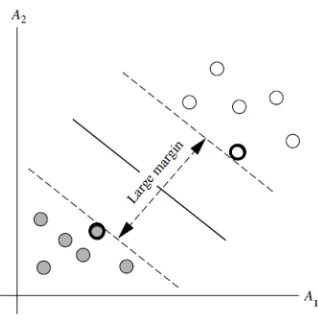
Assume that a two-class classification problem is given as follows. LetDbe the data set which is given as(X1,y1),(X2,y2), ...,(X|D|,y|D|), whereXiis the set of training samples with associated class labels,yi∈ {−1,+1}. It is also assumed that each training sample is represented using two attributesA1andA2, as shown in Figure 2.3. From the figure, it can be seen that the training data are linearly separable, because a straight line can be drawn to separate the two classes.
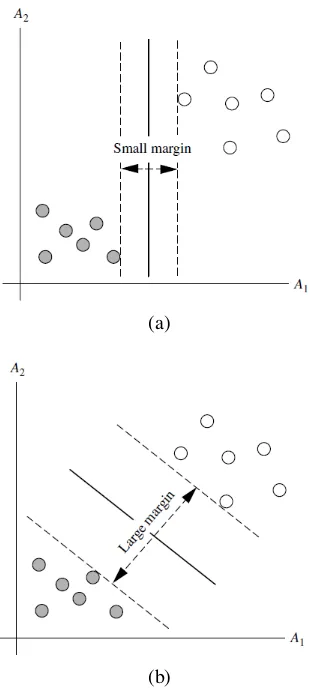
As shown in Figure 2.3, there are many numbers of straight lines that could be drawn to separate the two classes. However, the best straight line (or generally best hyperplane, regardless of the number of input attributes) is the one that has the minimum classification error on unseen samples. Therefore, in order to find the best hyperplane SVM searches for the maximum marginal hyperplane. In Figure 2.4, two possible separating hyperplanes are shown with their associated margins. Both of these hyperplanes can classify all the given data samples correctly, but the hyperplane with the largest margin in Figure 2.4(b) is expected to be more generalized because the largest margins gives the largest separation between classes.
21
(a)
[image:32.595.239.394.69.414.2](b)
Figure 2.4: Possible separating hyperplanes with their associated margins (Hanet al., 2011)
closest training sample of either class. For linear classification, the two classes and the maximum marginal hyperplane separating them can be identified by Eq. (2.11a) and Eq. (2.11b),
wXi+b ≥ 1,yi=1 (2.11a) wXi+b ≤ −1,yi=−1 (2.11b)
in whichwis a weight vector andbis a bias. By combining Eq. (2.11a) and Eq. (2.11b),
yi×(wXi+b) ≥ 1,i=1, ...,l (2.12)
22
Figure 2.5: Support vectors (Hanet al., 2011)
is encircled with a thicker border.
The distance between the support vectors can be given by Eq. (2.13):
d = 2
kwk (2.13)
wherekwkis the Euclidean norm ofw.
Better separation between the two classes can be achieved by maximizingd. In order to maximized while making sure that all the training samples are on the correct side of the hyperplane, w must be minimized. This problem can be solved using the Lagrange functionL= f−αg, where f is the function that will be minimized which is equal to 12kwk2a simplification of the weight vector calculation,α is the Lagrange multiplier and g is the constraint which is equal to yi(wXi+b)−1. Therefore by applying the Lagrange function, it yields:
L(w,b,α) = 1 2kwk
2− l
∑
i=1αi[yi(wXi+b)−1] (2.14)
Eq. (2.14) can be solved by minimizing according towandb, maximizing ac-cording toαi≥0 values,wcan be obtained in Eq. (2.15):
w = l
∑
i=123
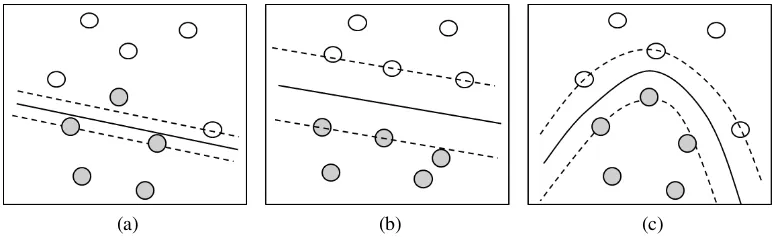
[image:34.595.118.508.79.199.2](a) (b) (c)
Figure 2.6: Two class nonlinear separable problem
According to ∑li=1αi·yi =0,αi≥0,Eq. (2.15) can be replaced into the La-grangian formula Eq. (2.14) which yields:
L(w,b,α) =
l
∑
i=1αi−
1 2
l
∑
i=1l
∑
j=1αiαjyiyjXi·Xj,αi≥0 (2.16)
An upper bound for the Lagrangian multipliers is introduced by C, where 0≤α ≤C. C is called a penalty parameter of the error term and is best determined experimentally.
Next, the sample’s class can be obtained by Eq. (2.17):
y(XT) = Sign(( l
∑
i=1αiyiXi)XT +b),0≤αi≤C (2.17)
If the data is not linearly separable, as in Figure 2.6(a), it means that no straight line can be drawn to separate the two classes. In such cases a simple conversion of feature space is needed. PointXi in the input space is mapped to a feature space with a higher dimension using a nonlinear mapping functionφ(.)then a linear separation is retried in the new space as shown in Figure 2.6(b). Optimum separation is provided by a nonlinear separating surface in the original space as shown in Figure 2.6(c).
The dot product computation involved in Eq. (2.16) and Eq. (2.17) is expensive to compute for the transformed data samples. Thus, kernel functionK(Xi,X) = (φ(Xi)·
24
Function kernels (Hsu, Chang & Lin, 2003).
2.4.2 Radial Basis Function Kernel
There are no rules to determine which kernel will produce the most accurate perfor-mance and also no large difference between the kernel’s resulting accuracy (Hanet al., 2011). However, the Radial Basis Function (RBF) kernel is suggested to be the first choice due to several reasons (Hsu et al., 2003). Firstly, the ability of the RBF ker-nel to handle the nonlinear relation between class labels and attributes by mapping the samples into a higher dimensional space nonlinearly. Furthermore, linear and sig-moid kernels can be a special case of RBF kernel for certain parameters. Secondly, the complexity of the RBF kernel is less than the polynomial kernel because more hyper parameters are found in the polynomial kernel than in the RBF kernel. Finally, there are fewer numerical difficulties found in the RBF kernel as compared to the polyno-mial and sigmoid kernels. However, if the number of features is very large, then the linear kernel is a more suitable choice than the RBF kernel (Hsuet al., 2003). For these reasons and because the number of features is small in this research, the RBF kernel function is selected and it is given by:
K(Xi,X) = e−γkXi−Xk2,γ >0 (2.18)
in whichγ controls the bell’s aperture.
2.5 Content-based Filtering for SMS Spam
58
REFERENCES
Almeida, T., Hidalgo, J.M.G. & Silva, T.P. (2013). Towards SMS spam filtering: Re-sults under a new dataset. International Journal of Information Security Science, 2(1), pp. 1–18.
Almeida, T.A., Hidalgo, J.M.G. & Yamakami, A. (2011). Contributions to the study of SMS spam filtering: new collection and results. In: Proceedings of the 11th ACM symposium on Document engineering, ACM, pp. 259–262.
Bache, K. & Lichman, M. (2013). UCI Machine Learning Repository [http://archive.ics.uci.edu/ml].Irvine, CA: University of California, School of Information and Computer Science.
Basheer, I. & Hajmeer, M. (2000). Artificial neural networks: fundamentals, comput-ing, design, and application.Journal of microbiological methods, 43(1), pp. 3–31.
Bishop, C.M. (1995).Neural Networks for Pattern Recognition. New York, NY, USA: Oxford University Press, Inc., ISBN 0198538642.
Boser, B.E., Guyon, I.M. & Vapnik, V.N. (1992). A training algorithm for optimal margin classifiers. In: Proceedings of the Fifth Annual Workshop on Computational Learning Theory, COLT ’92, New York, NY, USA: ACM, ISBN 0-89791-497-X,
pp. 144–152.
59
Chang, C.C. & Lin, C.J. (2011). LIBSVM: A library for support vector machines.ACM Transactions on Intelligent Systems and Technology, 2, pp. 27:1–27:27, software
available athttp://www.csie.ntu.edu.tw/~cjlin/libsvm.
Chen, T. & Kan, M.Y. (2013). Creating a live, public short message service corpus: The nus sms corpus.Language Resources and Evaluation, 47(2), pp. 299–335.
Cisco (2005).SMS SPAM AND FRAUD PREVENTION.
Cristianini, N. & Shawe-Taylor, J. (2000). An introduction to support vector ma-chines and other kernel-based learning methods. Cambridge university press, ISBN
9780521780193.
Delany, S.J., Buckley, M. & Greene, D. (2012). SMS spam filtering: methods and data. Expert Systems with Applications, 39(10), pp. 9899–9908.
Demuth, H., Beale, M. & Hagan, M. (2008). Neural network toolbox 6.User’s guide.
Deng, W.W. & Peng, H. (2006). Research on a naive bayesian based short message fil-tering system. In: Machine learning and cybernetics, 2006 international conference on, IEEE, pp. 1233–1237.
El-Alfy, E.S. & Al-Qunaieer, F.S. (2008). A fuzzy similarity approach for auto-mated spam filtering. In:Computer Systems and Applications, 2008. AICCSA 2008. IEEE/ACS International Conference on, IEEE, pp. 544–550.
GooglePlay (n.d.). Retrieved on December 2, 2014 from https://play.google.
com/store.
GSMA (2011). SMS Spam and Mobile Messaging Attacks: Introduction, Trends And Examples.GSMA: Spam Reporting Service.
GSMA (2013). GSMA: The Mobile Economy 2013.
60
Han, J., Kamber, M. & Pei, J. (2011).Data mining: concepts and techniques. Morgan kaufmann.
Hart, K. (2008). Advertising Sent To Cellphones Opens New Front In War on Spam. Washington post. Retrieved on December 2, 2014 from
http://articles.washingtonpost.com/2008-03-10/news/36788122_1_
text-messages-spam-e-mail-block-texts.
Haykin, S. (2009). Neural networks and learning machines, volume 3. Pearson Edu-cation Upper Saddle River.
Hidalgo, J., Bringas, G. & Sánz, E. (2006). Content based SMS spam filtering. In: Proceedings of the 2006 ACM symposium on Document engineering, ACM, pp. 107–
114.
Hsu, C.W., Chang, C.C. & Lin, C.J. (2003). A practical guide to support vector classi-fication.
Japkowicz, N. & Shah, M. (2011).Evaluating Learning Algorithms. Cambridge Uni-versity Press.
Joe, I. & Shim, H. (2010). An sms spam filtering system using support vector machine. In: Future Generation Information Technology, Springer, pp. 577–584.
Jurman, G., Riccadonna, S. & Furlanello, C. (2012). A comparison of mcc and cen error measures in multi-class prediction.PloS one, 7(8), p. e41882.
Karami, A. & Zhou, L. (2014). Improving static sms spam detection by using new content-based features.
Kharif, O. (2012). Mobile Spam Texts Hit 4.5 Billion Raising Con-sumer Ire. Bloomberg Business Week News. Retrieved on December
2, 2014 from http://www.businessweek.com/news/2012-04-30/
61
Khemapatapan, C. (2010). Thai-english spam sms filtering. In: Communications (APCC), 2010 16th Asia-Pacific Conference on, IEEE, pp. 226–230.
Klir, G.J. & Yuan, B. (1995).Fuzzy Sets and Fuzzy Logic: Theory and Applications. Upper Saddle River, NJ, USA: Prentice-Hall, Inc., ISBN 0-13-101171-5.
Kotsiantis, S., Kanellopoulos, D. & Pintelas, P. (2006). Data preprocessing for super-vised leaning.International Journal of Computer Science, 1(2), pp. 111–117.
Levenberg, K. (1944). A method for the solution of certain problems in least squares. Quarterly of applied mathematics, 2, pp. 164–168.
Liu, G. & Yang, F. (2012). The application of data mining in the classification of spam messages. In: Computer Science and Information Processing (CSIP), 2012 International Conference on, IEEE, pp. 1315–1317.
Liu, Y., Loh, H.T. & Sun, A. (2009). Imbalanced text classification: A term weighting approach.Expert systems with Applications, 36(1), pp. 690–701.
Mahmoud, T.M. & Mahfouz, A.M. (2012). SMS spam filtering technique based on artificial immune system.IJCSI International Journal of Computer Science Issues, 9(1).
Maier, J. & Ferens, K. (2009). Classification of english phrases and sms text messages using bayes and support vector machine classifiers. In: Electrical and Computer Engineering, 2009. CCECE’09. Canadian Conference on, IEEE, pp. 415–418.
Marquardt, D.W. (1963). An algorithm for least-squares estimation of nonlinear pa-rameters. Journal of the Society for Industrial & Applied Mathematics, 11(2), pp. 431–441.
62
Møller, M.F. (1993). A scaled conjugate gradient algorithm for fast supervised learn-ing.Neural networks, 6(4), pp. 525–533.
Mujtaba, G. & Yasin, M. (2014). SMS Spam Detection Using Simple Message Content Features.
Murynets, I. & Jover, R.P. (2012). Crime Scene Investigation : SMS Spam Data Anal-ysis Categories and Subject Descriptors, pp. 441–452.
Najadat, H., Abdulla, N., Abooraig, R. & Nawasrah, S. (2014). Mobile SMS Spam Filtering based on Mixing Classifiers.
Nuruzzaman, M.T., Lee, C., bin Abdullah, M.F.A. & Choi, D. (2012). Simple SMS spam filtering on independent mobile phone.Security and Communication Networks, 5(10), pp. 1209–1220.
Nuruzzaman, M.T., Lee, C. & Choi, D. (2011). Independent and personal SMS spam filtering. In:Computer and Information Technology (CIT), 2011 IEEE 11th Interna-tional Conference on, IEEE, pp. 429–435.
Ogura, H., Amano, H. & Kondo, M. (2011). Comparison of metrics for feature selec-tion in imbalanced text classificaselec-tion. Expert Systems with Applications, 38(5), pp. 4978–4989.
Özkan, C. & Erbek, F.S. (2003). The comparison of activation functions for multi-spectral landsat tm image classification. Photogrammetric Engineering & Remote Sensing, 69(11), pp. 1225–1234.
Porter, M.F. (1980). An algorithm for suffix stripping.Program: electronic library and information systems, 14(3), pp. 130–137.
Rafique, M.Z. & Abulaish, M. (2012). Graph-based learning model for detection of SMS spam on smart phones. In: Wireless Communications and Mobile Computing Conference (IWCMC), 2012 8th International, IEEE, pp. 1046–1051.
63
Rumelhart, D.E., McClelland, J.L. & PDP Research Group, C. (1986). Parallel Dis-tributed Processing: Explorations in the Microstructure of Cognition, Vol. 1:
Foun-dations. Cambridge, MA, USA: MIT Press, ISBN 0-262-68053-X.
Salton, G., Wong, A. & Yang, C.S. (1975). A vector space model for automatic index-ing.Communications of the ACM, 18(11), pp. 613–620.
Samarasinghe, S. (2006).Neural networks for applied sciences and engineering: from fundamentals to complex pattern recognition. CRC Press.
Shahi, T.B. & Yadav, A. (2013). Mobile SMS Spam Filtering for Nepali Text Using Naïve Bayesian and Support Vector Machine.International Journal of Intelligence Science, 4, p. 24.
Shang, W., Huang, H., Zhu, H., Lin, Y., Qu, Y. & Wang, Z. (2007). A novel feature selection algorithm for text categorization.Expert Systems with Applications, 33(1), pp. 1–5.
Shukla, A., Tiwari, R. & Kala, R. (2012). Real life applications of soft computing. CRC Press.
Sohn, D.N., Lee, J.T., Han, K.S. & Rim, H.C. (2012). Content-based mobile spam clas-sification using stylistically motivated features. Pattern Recognition Letters, 33(3), pp. 364–369.
Sohn, D.N., Lee, J.T. & Rim, H.C. (2009). The contribution of stylistic information to content-based mobile spam filtering. In: Proceedings of the ACL-IJCNLP 2009 Conference Short Papers, Association for Computational Linguistics, pp. 321–324.
Tagg, C. (2009).A corpus linguistics study of SMS text messaging. Ph.D. thesis, Uni-versity of Birmingham.
64
Vapnik, V.N. & Chervonenkis, A.Y. (1971). On the uniform convergence of relative frequencies of events to their probabilities.Theory of Probability & Its Applications, 16(2), pp. 264–280.
Widyantoro, D.H. & Yen, J. (2000). A fuzzy similarity approach in text classification task. In:IEEE International conference on fuzzy systems, volume 2, pp. 653–658.
Yadav, K., Kumaraguru, P., Goyal, A., Gupta, A. & Naik, V. (2011). SMSAssassin: Crowdsourcing driven mobile-based system for SMS spam filtering. In:Proceedings of the 12th Workshop on Mobile Computing Systems and Applications, ACM, pp. 1–
6.
Zadeh, L.A. (1965). Fuzzy sets.Information and control, 8(3), pp. 338–353.
Zadeh, L.A. (1994). Fuzzy logic, neural networks, and soft computing. Communica-tions of the ACM, 37(3), pp. 77–84.
Zhang, J., Li, X., Xu, W. & Li, C. (2011). Filtering algorithm of spam short messages based on artificial immune system. In:Electrical and Control Engineering (ICECE), 2011 International Conference on, IEEE, pp. 195–198.
Zimmermann, H.J. (2010). Fuzzy set theory.Wiley Interdisciplinary Reviews: Compu-tational Statistics, 2(3), pp. 317–332.