Journal of Chemical and Pharmaceutical Research, 2014, 6(3):1400-1406
Research Article
CODEN(USA) : JCPRC5
ISSN : 0975-7384
Research on method of detecting beef fat content based on
maximum entropy segmentation
Ke Xiao
1, Guan-dong Gao
2and Li-sheng Ren
11College of Information Science and Technology, Agricultural University of Hebei, Ling Yu Si Road, Baoding, Hebei,
China
2
Information and Management Department, The Central Institute for Correctional Police, Qi Yi Road, Baoding, Hebei, China
_____________________________________________________________________________________________
ABSTRACT
In this paper, a method of detecting beef fat content based on maximum entropy image segmentation is introduced for the application of estimating beef quality in computer vision field. Beef images were captured by DC and transferred to the computer at first. Then, Otsu algorithm was performed to isolate the pork image background, and R layer in RGB color space was used to isolate accurately. For isolating beef muscle and fat, maximum entropy segmentation method, hue segmentation method in HSV color space, minimal cross-entropy method and Otsu method were tested and compared. The fat content results that estimated by the first two methods were also tested in different light conditions, and compared with the results that tested by Soxhlet extractor method. Then, a detective formula was proposed to estimate the real fat content by the results of maximum entropy. Experimental results show that in natural light condition, maximum entropy method is accurate for isolating fat and then estimating fat content. The method in this paper can detect beef fat content accurately, rapidly and non-destructively, and it laid the foundation for the practical application.
Key words: beef; fat content; maximum entropy; image segmentation
_____________________________________________________________________________________________
INTRODUCTION
In recent years, the domestic animal husbandry markets increase greatly. Beef production has been increasing at the rate of about 20% per year. In 2012, our country beef production total quantity reached 7 million tons, is only inferior in the United States and Brazil, occupies world third. Simultaneously, with development of economic level, improvement of quality of life, more and more people are paying much attention to the beef quality, having an increasingly high requirement of its quality. So the analysis of beef quality is becoming more important.
and the results showed the proposed method can extract the characteristic information and has high accuracy, but this method for measuring beef fat content in room temperature storage has certain limitations. Wang et al [8] applied computer image analysis method to extract the characteristic of the marbling content, then employed the multiple linear regression, nonlinear regression and neural network to calculate the intramuscular fat content, but this method has a large number of requirements and impractical.
In order to improve the speed and the accuracy of the beef fat content detection, this paper employs maximum entropy segmentation method to carry out the adaptive threshold segmentation to finish the recognition of beef fat content, comparing with two test results based on beef fat image characteristics and the chemical method, analyzing the correlation between two methods, setting up the correlation model to get highly correlative image feature with beef fat content, and then applying the fuzzy algorithm to establish a set of automatic recognition algorithm of beef fat content with higher accuracy.
EXPERIMENTAL SECTION
Inspection Standards and Experimental materials: There are many factors affecting beef quality. The
intramuscular fat content is one of the most key factors that influence beef quality. The subcutaneous fat has some influences on the beef quality, especially the beef tenderness. Fat color is also taken as reference for the evaluation of the quality rating. Fat color can be divided into the quality grade 1, 2, 3, 4, 5, 6, 7, 8, and 9. 1st level is the highest grade, and 9th level is the worst grade.
The lean backs of the fresh beef, which were bought from supermarkets and farmers market, were selected as the experimental samples. The purchased beef, which was washed with clean water and drained well, will be cut into uniform sliced meat about 3-5 mm thickness, and then place them in a glass dishes. A total of 12 meat samples were usually preserved in dark blue background at room temperature. While gathering image, they were placed under uniform light source and the different images information were collected by the camera, which is Canon PowerShot SX30 IS, fixed-focus 4 mm macro mode.
Experimental methods:
Image acquisition: considering that the shooting process of the camera is sensitive to light source and light intensity,
the different light source and different light intensity will lead to the color change of the image information. Here we need to extract the color feature of the image, so any of the above can affect the filming, and then further influence the result of the experiment. In order to avoid the happening of this kind of phenomenon, the normalized process to light source and illumination brightness should be carried out before experiment. In the process of the experiment, the beef images are obtained respectively under the sunlight scattered light and incandescent light source so as to verify the test results in different light conditions. Simultaneously, the image acquisition is carried out at the same time, under the same desk lamp and in the same position to ensure that the light source and illumination brightness are changeless in every photograph. Furthermore, the beef samples are put on the deep blue cloth in order to avoid reflection against the experiment result appearing in the process of collecting image.
Image preprocessing: in the process of image acquisition, there are all kinds of influence factors such as
illumination, brightness, angle and etc., which make the collected images containing different degrees of noise affecting on the experimental result, so it is necessary to do the image de-noising. For the elimination of random noise, many smoothing image methods have been searched and used to remove the noise from image. In the smoothing process of image, it is very important to reserve fringe detail of image or keep clear contour line while filtering noise. There are some commonly used arithmetic such as median filter, partly average algorithm, and K-nearest neighboring method. By contrast, median filter can lift the image clarity while eliminating the noises. Therefore, here the selected smoothing technology is median filter, which is a nonlinear signal processing technology based on the order statistical theory, and it can effectively suppress the noise.
Image segmentation: As the key steps from image processing to image analysis, image segmentation is just to divide
an image into different and specific sub-images with different characters and extract some interested objects. Based on the used technology or algorithm, PalandPal divided the image segmentation algorithm into six categories including threshold segmentation, splitting pixel Method, range image segmentation, color image segmentation, edge detection and image segmentation method based on fuzzy set [9-11]. In threshold segmentation method, how to select the optimal threshold is the core of the problem, and it is also a delicate matter. Different choice criteria will get a different threshold algorithm. The commonly algorithm includes maximum entropy, minimum entropy and fuzzy entropy [12-14]. Here, maximum entropy is applied to carry out the image segmentation.
and stable effects. The application of the adaptive threshold is to separate the beef image from the image background, and finish the individual treatment of the beef image. But the traditional segmentation method doesn't get a good effect of gray-scale beef image segmentation due to the small color difference between the background and the beef image in the gray-scale image, and consequently cannot accurately detect the beef image boundary. This paper, for the sake of increasing the contrast between the beef image and the background, improved the algorithm by making the background the dark blue. On the basis of the color image collected under the improved background, the segmentation is carried out by using the red (R) image layer, on which the beef pixel value is bigger while the background pixel value is smaller,( that is, there is an obvious difference between the beef image and the background).
(a) (b)
[image:3.595.170.443.186.354.2](c) (d)
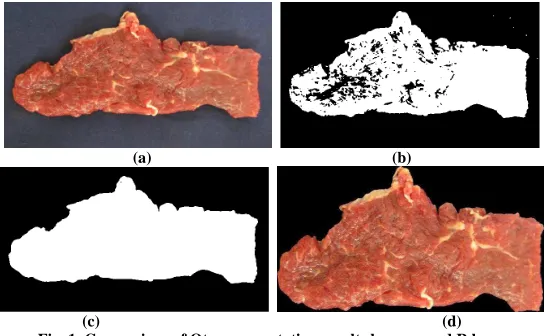
Fig. 1. Comparison of Otsu segmentation results by gray and R layer
The segmentation image by Otsu algorithm are given in figure 1, in which (a) is the original image, (b) is the gray-scale image which adopts Otsu to confirm the threshold of binary image, (c) is the R layer image on the color image, and (d) is the image segmentation result. From figure 1, the application of R layer image can accurately separate the beef region with the background.
The image segmentation algorithm for the maximum entropy: for the image segmentation, maximum entropy
method has quick speed, simple calculation and good segmentation quality, and thus it has been widely applied [15]. The main idea of maximum entropy segmentation method entropy algorithm is [16]: The image pixels are classified by selecting one or more optimal gray threshold. Generally, The image pixels less than the threshold value are supposed to be the same category and the image pixels greater than the threshold value is be classified as another category, while these equal to the threshold value can be classified as either category. And finally the specific goal is extracted.
Set the image segmentation threshold is (s,t) [17], the probability of background region is Pb, the probability of the
target area is Po, then
b o
L
H
H
H
=
+
(1)The discriminant function of image entropy is defined as
o o L o o o o o o o L o o o
P
H
H
P
H
P
P
P
P
H
H
H
P
H
b
H
o
H
t
s
−
−
+
+
−
=
−
+
−
−
+
+
=
+
=
1
)]
1
(
lg[
)
1
lg(
1
lg
)
(
)
(
)
,
(
(2)The optimal threshold vector (s*, t*) have to satisfy the following condition
))
,
(
max(
*)
*,
(
s
t
=
f
s
t
(3)studied the minimal cross-entropy segmentation method, Otsu method and HSV color space segmentation method under the same conditions, analyzing and discussing their segmentation results.
RESULTS AND DISCUSSION
Region segmentation of fat and lean meat: for the sake of accuracy of region segmentation for the fat and lean
meat, this paper studied four segmentation algorithms including maximum entropy method, the minimal cross-entropy segmentation method, Otsu method and HSV color space segmentation method. Among four segmentation algorithms, three algorithms, which are maximum entropy method, the minimal cross-entropy segmentation method and Otsu method, employed R layer image on based on RGB color space to segment the image. While the detailed description for HSV color space segmentation method is: The color layer image(H layer) are used to segment the fat and lean meat in beef imaging after converting the obtained RGB image into HSV image. The image segmentation is based on the optimal threshold, which is to calculate the hue boundary threshold between the fat and lean area.
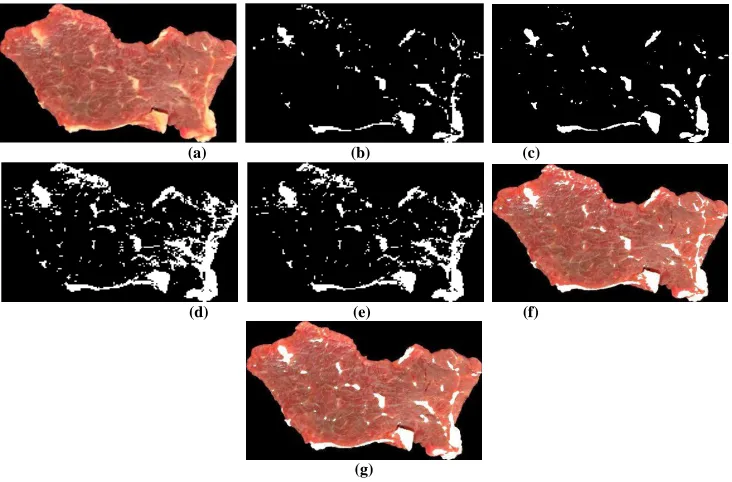
This paper took the red areas of color as the segmentation threshold, which is obtained from experiment experience. The muscle tissues are the range of the hue component satisfying H > 0.89 or H<0.05. Other hue components belong to fat area. Figure 2 gives the beef fat areas segmented by four segmentation algorithms. Figure 2 (a) is the image wiped off the background. Figure 2(b), (c), (d) and (e) are the binarization segmentation image of the fat area orderly based on maximum entropy segmentation method, HSV color space segmentation method, minimal cross-entropy segmentation method and Otsu adaptive threshold segmentation method. The white area in each binarization segmentation image is the fat area. Figure 2(f) and (g) are the beef muscle image based on maximum entropy segmentation method and HSV color space segmentation method.
(a) (b) (c)
(d) (e) (f)
[image:4.595.124.490.347.588.2](g)
Fig. 2. The results of separating muscle and fat
From the figure 2, the segmentation effects of maximum entropy segmentation method and HSV color space segmentation method are better, while that of minimal cross-entropy segmentation method and Otsu adaptive threshold segmentation method are relatively poor. By comparing figure 2(f) with figure 2(g), we can see that there are still the minimal residual fat in the figure 2(g) but the fat area in figure 2(f) is completely disappeared. Therefore, from this experiment, we come to the conclusions that the improved maximum entropy segmentation method can accurately segment the fat and lean meat in beef imaging, and can further calculate the amount in beef fat content.
The beef fat content under different light conditions: to observe the influences of the illumination conditions on
%
100
*
total fat
S
S
p
=
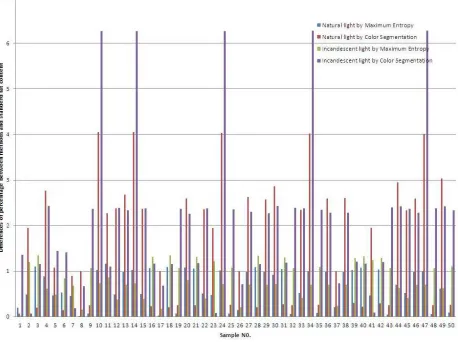
(4) [image:5.595.81.539.243.585.2]where p is the fat percentage. S is the area. Subscript fat and total are the fat area and the beef total area respectively. Here the Hydrote and Soxtec made in FOSS Inc. are employed to rapidly determine the beef fat, which are regarded as the comparable data of detection result. Hydrotec is used mainly for hydrolyzing experimental samples to avoid the error resulted from the traditional manual operation. Soxhlet's extraction was used for the standard value of fat content. This system can quickly and accurately carry out the total fat content detection, crude fat analysis and extractable matter. This paper detected 50 beef samples. For measuring the difference with standard fat content in 50 samples, figure 3 shows the absolute differences with standard fat content by each sample. From figure 3, the differences of fat content by maximum entropy method is much smaller than HSV color space segmentation method under different light conditions.
Fig. 3. The differences of fat content with 50 samples
Tab.1. The differences of fat content with standard results in beef
Items Natural light Incandescent light The fat content Maximum entropy HSV color space Maximum entropy HSV color space
Average 8.8055 10.1820 8.8378 10.6115 9.2258
Max difference 1.1655 4.0547 1.3485 6.2774 \
Min difference 0.0153 0.0696 0.0209 0.064 \
Total distances 5.3742 14.625 6.349 18.744 \
[image:5.595.99.513.630.693.2]and the smallest total distances is using Maximum entropy method in natural light.
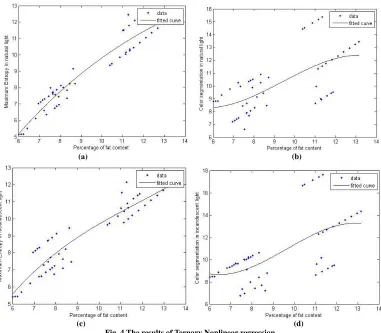
[image:6.595.116.497.334.667.2]In addition, we analyzed and calculated these fat content data by Ternary Nonlinear regression analysis method. Figure 4 shows the results of nonlinear regression under varying light and two methods as y-axis, and the x-axis is the standard fat content percentage. Figure 4(a) fits the standard fat content by maximum entropy method in natural light, and figure 4(b) is HSV color segmentation in the same light condition. Figure 4(c) and (d) is the regression results in incandescent light by the two methods. From these figures, the data are closely distributed around the fitted curve in figure 4(a) obviously, and the data are distributed dispersive in other three figures. Therefore, the maximum entropy method in natural light is an effective method of detecting beef fat content. The detective formula that calculated by Ternary Nonlinear regression is as follows:
y=0.0017x3-0.1065x2+2.528x-6.532 (5)
where y is the final fat content percentage and x is the fat content value that detected by maximum entropy method in natural light. In addition, the fitted curve in figure 4(a) is like a quadratic curve, and the third coefficient is very small. Therefore, for simplifying the formula, the third coefficient is eliminated, and the formula becomes as follows:
y=-0.1065x2+2.528x-6.532 (6)
That is the final detective formula that we proposed in this paper. And we also proposed a fat content detection method by maximum entropy segmentation method in natural light.
(a) (b)
(c) (d) Fig. 4 The results of Ternary Nonlinear regression
CONCLUSION
This paper presented a method of detecting beef fat content based on the maximum entropy. In view of the shortcomings of the traditional gray image segmentation algorithm, Otsu algorithm was performed to isolate the beef image background, and the improved R layer in RGB color space was used to isolate accurately the beef area from the beef image background. For isolating beef muscle and fat, maximum entropy segmentation method, hue segmentation method in HSV color space, minimal cross-entropy method and Otsu method were tested and compared. The fat content results that estimated by the first two methods were also tested in different light conditions, and compared with the results that tested by Soxhlet extractor method. Experimental results show that that in natural light condition, maximum entropy method is accurate for isolating fat and then computing fat content. The calculated result by maximum entropy method is in good agreement with the standard value by the accuracy of 92%. Therefore, we proposed a maximum entropy method in the beef fat segmentation and a detective formula. The proposed segmentation algorithm can rapidly, conveniently and non-destructively detect beef fat content, and has low cost, small error and stable light source. These same factors, in turn, make it has a good application prospect.
Acknowledgements
This work was supported in part by the Science and Technology Support Program of Hebei (No. 12220139), and Polytechnic Foundation of Agricultural University of Hebei (No. LG20130701) and (No. LG20130702).
REFERENCES
[1] Anderson Nathan M., Walker, Paul N. Transactions of the American Society of Agricultural Engineers, 2003, 46(1): 117-124.
[2] Ballerini Lucia1, Högberg Anders, Borgefors Gunilla, et al. IEEE Transactions on Nuclear Science, 2002, 49(1I): 195-199.
[3] Liu Ying, Cao Jiaji, Zhang Haowei, et al. Journal of Chemical and Pharmaceutical Research, 2014, 6(1): 254-258.
[4] Ng Sing K., Gibson Andrew, Parkinson Graham, et al. IEEE Transactions on Instrumentation and Measurement,
2009, 58(10): 3778-3787.
[5] Fumito Yoshikawa, Kazuo Toraichi, Koichi Wada, et al. Pattern Recognition Letters, 2000, 21(12): 1037-1050. [6] Jeymkondan S, Ray N, Kranzler G A, et al. Beef quality grading using machine vision. In: Proceedings of the
Conference on Biological Quality and Precision Agriculture II, 2000, 22 (5), 41-44.
[7] Sun Yonghai, Zhao Xiwei, Xianyu Jianchuan. Journal of agricultural machinery, 2004, 35(1):104-107. [8] Wang Xiaodan, Sun Yonghai, Fan Xiangchao, et al. Journal of Chinese food, 2012, (12):185-190. [9] Horng M.H. Journal of Chemical and Pharmaceutical Research, 2013, 5(9): 599-605.
[10]Liu Yanjun, Wang Jinliu. Modern Business Trade Industry, 2010(12): 361-362. [11]Li Xinwu. Journal of Chemical and Pharmaceutical Research, 2013, 5(12): 113-117. [12] Tao WenBing, Jin Hai. Chinese Journal of Computers, 2007, 30(1): 110-119. [13] Tian Jie, Zeng Jianchao. Computer Engineering, 2009, 35(3) : 230-232.
[14] Jiao Hongwei, Li Kun, Wang Jianping. Journal of Chemical and Pharmaceutical Research, 2014, 6(1): 271-277.
[15] Apro M., Novakovic D., Pal S., et al. Acta Polytechnica Hungarica, 2013, 10(1): 43-62. [16] Zhou Delong , Pan Quan, Zhang Hongcai, et al. Journal o f Software, 2001, 12(9): 1420-1422. [17] Wang Wenyuan,Wang Fangmei, Computer Simulation, 2011, 28(8): 291-294, 319.