Theoretical and Experimental Study of Combined
System: Chilled Ceiling and Displacement Ventilation
Israa Ali AbdulGhafor1,*, Adnan A. Abdulrasool2, Qasim S. Mehdi2
1Lecturer, Department of Electronic Technique, Middle Technical University, Iraq 2Professor, Department of Mechanical Engineering, Al-Mustansiriya University, Iraq
Copyright©2019 by authors, all rights reserved. Authors agree that this article remains permanently open access under the terms of the Creative Commons Attribution License 4.0 International License
Abstract
The present experimental study presents the of performance of the combine cooling system (chilled ceiling and displacement ventilation). The experimental study included the effect of different temperatures of chilled ceiling of (20 and 16)°C and different supplied air temperatures of (18, 20, 22 and 24)°C with constant internal load of 1600W and constant supplied air velocity of 0.75m/s. The theoretical study content studying the air flow pattern through occupant zone and temperatures contours in different directions X, Y and Z at supplied air temperature (18)°C and internal load, mean plate temperature and supplied air velocity of (1600W, 20°C and 0.75m/s) respectively. The experimental results show that the cooling capacity of air decreases as temperature of supplied air increases. At temperature of supplied air increase by 33.3%, the cooling capacity of air decreases by (22.7 and 22.54) % for chilled ceiling temperature of (20 and 16)°C respectively. While cooling capacity of chilled ceiling increases as supplied air temperature increases. At supplied air increases by 33.3%, the cooling capacity of chilled ceiling increase by (14 and 15.28)% for chilled ceiling temperatures of (20 and 16)°C respectively. The theoretical results show that the air velocity and temperatures contours for supplied air temperature in different direction are approximated constant.Keywords
Combined System, Chilled Ceiling andDisplacement Ventilation, Theoretical Study of Combined System
1. Introduction
The indoor air quality and thermal comfortable are the most necessary condition for the inside environment. Because people remain more time inside environmental, heating, ventilation and air condition (HVAC) systems supply high indoor air quality and thermal comfortable became very important. High indoor air quality can be
obtain with using HVAC systems that supply enough quantity of fresh air to the occupied zone whilst effectively elimination contaminants. So, HVAC, systems provide suitable air temperature by elimination heat from occupied zone while avoid large air temperature gradients and drafts. Economic side should be achieved by both thermal and indoor air quality requirements, because the largest energy consumption is done by these systems. According to recent researches more than 40% of total energy used by commercial building is consumption by HAVC systems
[1].
2. Literature Review
There are many experimental and theoretical investigations were focused on chilled ceiling combined with displacement ventilation with different operation conditions. Jeong and Mumma. (2003),[2] presented an analysis of the enhancement performance of cooling panel capacity when used ventilation. The model was used a space with dimensions of 3m (L) x 3m(W) x 3(H)m with five cooling panel made from aluminum ,dimensions of each one 0.6m(L) x 3m(W). The space model has only one external wall with small window. The temperature of outdoor is 30℃, while temperature inside the space remains about 26℃. The air is introduced to the space by 0.5m(L) x 0.5(W) nozzle diffuser positioned near ceiling. The velocity of air changed from 2 to 6m/s and temperature of chilled water is varied from 12 to 25℃. The results show that when air velocity increases the performance is enhanced from (5 to 35)% at typical design temperature. The increment of capacity means a reduction in initial cost and area panel required. At a velocity less than 2m/s, the effect of ventilation on capacity of cooled panel is small so the correlation of natural heat transfer coefficient was used to evaluate the capacity of cooling panel at low velocities.
The method included a liquid desiccant dehumidification membrane cycle (LDMC) that is modeled mathematically to replace cooling ceiling. The combined (LDMC-C) with displacement ventilation is used in office at Beirut climate. The combined LDMC-C/DV system is consisted of four main subsystems: the liquid desiccant cycle, the DV system, the parabolic solar collector and the space thermal. The soiled pipes were used in all system except in dehumidifier and regenerator parts, the pipes made from porous material.
The results shown that at temperature of desiccant ceiling decreases by 3°C, the total cooling energy needed by chiller decreasing by 10%. With the same input parameters of operation, the energy saves by 49% compared to the conventional system. The thermal condition in occupied zone for both new system and conventional system have same conditions for thermal comfort but the slightly difference in operative parameters like RH. The RH was 68.2% and 73.2% for LDMC and DV while RH was 50.1% and 70% for conventional system CC/DV.
Pomianowski et. al. (2017), [4] developed the numerical model that can expect the air flow and thermal performance of diffuser ventilation combined with chilled ceiling at design stage. This model is used to estimate the effects of different design parameters that contain the U-value of diffuse ceiling panel, plenum depth high of plenum. The simulation results show that the effect of diffuse ceiling for separating the radiant ceiling from the rest room can be minimized by using chilled ceiling plate with higher U-value and the low plenum height was good for energy efficiency but cause non-uniform in air distribution that led to draught problem in occupied zone. So this system can be used for small offices instead of large office.
3. Experimental Work
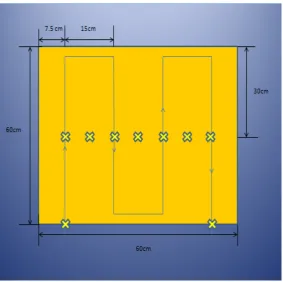
A combined cooling system (chilled ceiling and displacement ventilation) was installed at room with 3m(L)x4m(W)x3m(H) located at fourth floor on surface of Mechanical Engineering Department building, Al Mustansiriya University , Collage of Engineering as shown in figure 1. The chilled ceiling consist of corrugated metal plates (made of red copper metal), with copper tube being fitted inside it. The tube is fixed in holes made inside the plate to increase the contact area between the tube and the plate in order to reduce the thermal resistance and increase
Figure 1. The texted room
a: The Plate Mold
c: Thermocouples arrangement Figure 2. The details of plate’s construction
b: The actual view for combing network pipes
[image:5.595.177.421.450.743.2]c: The actual view for dividing network pipes
Figure 3. The graphical and photographic details of pipe network
b: The graphical picture of displacement ventilation
Description Number
Inlet Gate 1
Inlet Duct 2
Air Filter 3
Cooling Coil 4
Heater 5
Centrifugal Fan 6
Supply Duct 7
Room 8
Return Duct 9
[image:6.595.143.454.77.350.2]Vent Duct 10
Figure 4. The details of displacement ventilation
In experimental work DV unite was made and used as a cooling system combined with chilled ceiling. The component of DV is shown in figure 4 consist of air washer box that sides are closed by aluminum plates and then all side of the box are insulated by cork having thermal conductivity of 0.04W/m. K [9]. The assembly is a box which a centrifugal fan mounted. The centrifugal fan is used for drawing, supply circulation air. This type of fan is used because it’s more suitable for this application which needs low to medium air flow rate with low pressure and its more appropriate for HVAC an application [10]. The box content a filter of air, cooling coil, heater with temperature controller to adjust temperature of entering air, circular diffuser with angle 45° since it has high induction (mixing of supply and room air) [11], and two ducts one for return and other for supply air, chose this duct due to roughness
that refer to low friction loss, thermal conductivity, easy for installation due to its flexibility and low cost [12].
3.1. Pipe Network Consideration Design
The diameter of pipe is restricted by two main factors, first is velocity of water flow inside pipe and the second is friction loss. The maximum and minimum velocities in piping system are limited by erosion, noise, operation cost and installation. The noise, erosion levels and pumping cost, are appeared if the size of pipe is too small because it causes high velocity while if pipe size is too large, the installation cost is appears, so the size of pipe must be chosen to avoid the unflavored effect of high velocity also choose to minimize initial cost. The noise causing due to higher velocity that produce turbulence, free air ,sharp pressure loss or combination of these all, so in addition to consider velocity another parameter is considerate that is pressure loss , as a result the velocity and pressure loss are limited by AHRAE standard. The velocity of water in close loop hydraulic system isn't exceed 1.219 m/s for pipe diameter of 50.8mm and under, also a range of pipe friction loss utilize for hydraulic system is between 0.0981 and 0.3924 kpa/m. The easy method to estimate the required velocity and pressure loss is chart presented by ASHRE,
[image:7.595.140.454.347.574.2]this chart calculation from the Darcy- Weisbach equation with friction factors from the Colebrook equation or Moody chart. This chart is suitable of water temperature is 15.5° C but can used this chart up to 93.3° C with errors in pressure loss not exceed 20% [13]. The chart is appropriate in this study since is use plastic pipe schedule80 which is used in this investigation. The first value of mass flow rate used in this study depending on initial assumption of heat load and temperature difference is 0.47 kg/s, when apply this value on chart, the result show the suitable diameter is 25.4mm (1in) with increase in pressure loss in limited value, so in experimental test choose another mass flow rate but lower than the first one in order to reduce pressure loss. The chart used mentioned is in figure 5. In order to solve the problem of uniform flow through the piping system, the header diameter must be with a small diameter [14]. The sub pipes diameters are chosen as 19.05 m to ensure this condition. Also the chosen and design of theses diameters are validation theoretically as shown later in results.
4. Mathematical Model
1- The capacity of CC is determined by ability of plates to absorp heat from inside room by radiation and convection as well as heat absorption by plate’s increase that means the plate’s capacity increase and near to remove cooling loads from the zone. The radiation, convection heat flux and cooling capacity of chilled ceiling are determined by the following equations:
Qr=Jp-∑𝑛 𝐹
𝑗=1 pj Jj (1)
To simplify eq. (1) using MRT method. The radiation interchange in the room is included by assuming that the surfaces radiate to an imaginary surface that has an area emittance and temperature giving about the same heat transfer as the real multi surface case. The angle factor doesn’t need to be determined in the evaluation of the two surface enclosures. The simplified from of eq. (1) may be written by MRT method as following:
qr=ε Fr(T4
p –T4r ) (2)
The radiation exchange factor for two surface radiation heat exchange is given by Hottel equation:
Fr= 1 1 𝐹𝑝−𝑟+�
1
𝜀𝑝−1�+ 𝐴𝑝 𝐴𝑟�
1
𝜀𝑟−1�
(3) Also, when the emittence of an enclosure are nearly equal and surface exposed to plates are marginally unheated (un cooled), then Tr become AUST of unheated
(un cooled) surfaces exposed to the plates. AUST value can be determined as:
AUST = 1
A walls,total ∑ 𝐴𝑤𝑎𝑙𝑙
𝑛
𝑖=1 𝑇𝑤𝑎𝑙𝑙 (4)
The emittance εp of painted metal with non-reflect ting
(as the plates used) or nonmetallic plate can assume εp is
0.9, so when substitute this value in equation (3) getting a constant value Fr of 0.87. Substituting this value in eq. (2)
the final equation used is as following:
qr= 5x10⁻⁸ [(Tp+273)4 –(AUST+273)4] (5)
Depending on tests by Schtruin et al. (1953) and simulation by Kalisperis (1985) based on a program developed by Kalisperis and summers (1985) prove that if there is little or no outdoor exposure the AUST and air room temperature are equal almost. This assumption is made in this research work.
Now, analysis heat transfer by convection. It is defined as the heat transfer between the air and plate. Usually considering the heat transfer by convection is natural. The
convection in plate is depended mainly on temperature of plate surface and temperature of air stream layer directly below the plate because the fully developed stream begin usually (50 to 65mm) below the plate. In this work the temperature is measured at 50mm below the plates, at 265 cm height. The convection heat is determined by the following equation [15]:
qc=h(Tp- Tair) (6)
Where
h=2.12(Tp-Tair) 0.31 (7)
2-To determine the required number of the plates, assume an area of each plate is (60x60cm), then by using following equations [13,12]:
Aplate = The maximum cooling load removed by CC(W)(qr+ qc)(W/m2) (8)
The required number of chilled plate can be determined as following equation:
N= A of one plateA plates (9) 3- The mass flow rate of chilled water can be determined from the following equation:
Q (W) =𝑚. Cp (Twin – Twout) (10)
4- The capacity of DV system is determined by the following equation:
Qair=𝑚.Cp (Tr –Ts) (11)
5- When combined system is used, the pervious calculation is repeated with addition of parameter ɳ (eta) which is the ratio of cooling load removed by CC to the total cooling load and the expression is as following [16]:
ɳ=(CLDVCLcc+CLcc) (12)
5. Theoretical Work
Table 1. Boundary Conditions for Cases studied
Case number Supply air velocity (m/s) Supply air temperature (°C) Mean plate temperature(°C) The First Main Case
Piping Design
1 - - 12.5
Combined system CC/DV
1 0.75 18 20
6. Results and Discussion of
Experimental Work
To achieve the thermal condition limited by ASHREA55 stranded the combined system (combine displacement ventilation and chilled ceiling) is used. Figures from (6) to (13) show the analyses of combine system.
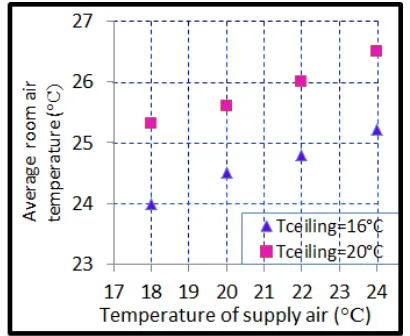
[image:9.595.319.521.294.462.2] [image:9.595.72.277.487.655.2]Figure 6 shows the relationship between supply air temperature and average air temperature of the room for different mean plate temperatures. It's can be noticed that for each mean plate temperature, the average air room temperature increases as the supply air temperature increases due to the decrease in the cooling capacity of air. For mean plate temperature of (16 and 20)°C, the average room air temperature increases from (24 to 25.2)°C and from (25.3 to 26.5)°C respectively for supply air temperature increase from (18 to 24)°C. Notice that for each supply air temperature ,the average room air temperature increases as mean plate temperature increase, for supply air temperature of 18°C, the air room temperature increase from (24 to 25.3)°C for mean plate temperature increases from(16 to20)°C respectively. This is due to the decrease in capacity of chilled ceiling as the mean plate temperature increase.
Figure 6. The relationship between average room air temperature of room and supply air temperature for different mean plate temperature
The relationship between ɳ and supply air temperature is shown in figure (7). It's clear from figure that the ɳ increase as supply air temperature increases, due to decreasing the air capacity with an increases supply air temperature at the same time of the increase in capacity of chilled ceiling for each mean plate temperature. For mean plate temperature
of (16 and 20)°C, the ɳ increases from (42.76 to 48.67)% and from (37.06 to 42.2)% respectively at supply air temperature increase from (18 to 24)°C. Also ɳ decreases as mean plate temperature increases for each supply air temperature due to decrease in chilled ceiling capacity. For supply air temperature of 18°C, the ɳ decreases from (42.76 to 37.06)% for chilled ceiling increase from (16 to 20)°C.
Figure 7. The relationship between ɳ and supply air temperature for different mean plate temperatures
Figure 8. The relationship between VATD calculated between level (10and110)cm and supply air temperature for different mean plate temperatures
[image:9.595.315.522.493.652.2]value ɳ for each mean plate temperature. At mean plate temperature (16 and 20)°C, the VATD decreasing from (1.3to0.3)°C and( 1.7to 0.65)°C respectively for air temperature increase from (18 to 24)°C. Also can notice as mean plate temperature increases ,VATD increase for each supply temperature and increases. For mean plate temperature increase from (16to 20)°C, the temperature difference for increase from (1.3 to 1.7)°C for 18°C supply air temperature.
The VATD between levels (10and170) cm with respect to supply air temperature for different mean temperatures is shown in figure 9. It can be noticed that the VATD decrease with temperature of supply air increase due to increase ɳ for each mean plate temperature. At mean plate temperature (16 and 20) °C, the VATD decreasing from (2 to 0.4)°C and (2.7 to 0.85)°C respectively for air temperature increase from (18 to 24)°C. Also it can be noticed that as mean plate temperature increases, VATD increases for each supply temperature due to decrease ɳ.
[image:10.595.320.520.80.238.2]For mean plate temperature increase from (16to 20)°C, the VATD increase from (2 to 2.7)°C for supply air temperature of 18°C.
Figure 9. The relationship between levels (10and170)m and supply air temperature for different mean plate temperatures
The relationship between cooling capacity of air and supply air temperature for different mean plate temperatures is illustrated in figure 10. It can be noticed that, when increasing supply air temperature from (18to 24)°C, the cooling capacity of air decreases from (865 to 670)W and from (925 to 715)W for mean plate temperature of (16 and 20)°C respectively. The reason of decreasing air capacity is the reduction in heat exchange between air room and supply air. Also it's clear from figure that, as mean plate temperature increases, the air capacity increases due to decrease in the capacity of chilled ceiling as mean plate temperature increases and hence increase the temperature of returned air. For supply air temperature of 18°C, the air capacity increases from (865 to 925)W at mean plate temperature increase from (16 to 20)°C.
Figure 10. The relationship between air capacity and supply air temperature for different mean plate temperatures
[image:10.595.75.273.352.505.2]Figure 11 shows the relationship between cooling capacity of plates and supply air temperature for different mean plate temperatures. it can be noticed that the cooling capacity of plates increase as supply air temperature increases for different mean plate temperatures. This is because the decrease in air capacity with increasing supply air temperature leads to an increase average air room temperature, so the difference in temperature between mean plate and average air room increase as a result the radiation and convection heat transfer to chilled ceiling increase. For supply air temperature increases from (18 to 24)°C, the chilled ceiling capacity increases from (684.22 to 778.83)W and from (593.049 to 675.34)W for a mean plate temperature of (16 and 20)°C respectively. Also it can be noticed that for each supply air temperature, the cooling capacity of chilled ceiling decreases as the mean plate temperature increases since the temperature difference between mean plate and air room is decreased and as a result the heat transfer to chilled ceiling reduced. For supply air temperature of 18°C, the cooling capacity decreases from (684.22 to 593.04) W for mean plate temperature increase from (16 to 20)°C respectively.
[image:10.595.322.520.545.702.2]Figure 12 describes the relationship between supply air temperature and PMV for different mean plate temperatures. It can be noticed that for each mean plate temperature, the PMV increases with the increase in supply air temperature because of the increase in room air temperature. For mean plate temperature of (16 and 20)°C, the PMV increase from (-0.33 to 0.02) and from (0.05 to 0.4) respectively at supply air temperature rise from (18 to 24)°C. Also it can be noticed that PMV increase as the mean plate temperature increases for each supply air temperature, since air room is high at higher mean plate temperature. For supply air temperature is 18°C, the PMV increase from (--0.33 to 0.05) at mean plate temperature increase from (16 to20)°C.
Figure 12. The relationship between PMV and supply air temperature for different mean plate temperatures
The relationship between PPD with respect to supply air temperature with different mean plate temperatures is shown in figure 13. The PDD decreases from (7 to 5)% as supply air temperature is increased from (18 and 22)°C respectively for mean plate temperature of 16°C, then PPD
[image:11.595.323.517.174.330.2]is remain constant at and equal 5% supply at air temperature of 24°C, for a mean plate temperature of 20°C, the PPD is constant at supply air temperature is (18 and 20)°C and equal 5% while at supply air temperature of (22 and 24)°C, the PPD increase from (6 to 8)%, this gives an indication of the increase in number of people feeling uncomforted.
Figure 13. The relationship between PPD and supply air temperature for different mean plate temperatures
7. Results and Discussion of
Theoretical Work
[image:11.595.74.274.253.411.2]Figure 14. The velocity of chilled water through pipes network
Figure 15 shows the temperatures distribution through the plates. It’s clear that the temperature for each plate is approximate constant and that meaning the velocity chosen is suitable to achieve required heat transfer.
[image:12.595.108.496.419.718.2]Theoretical study of combine system (chilled ceiling and displacement ventilation) used as a cooling system installed in a room with real dimensions (4W x 3L x 3H)m. The theoretical study consists of studying the effect of temperature of supplied air on the velocity vectors and temperatures distribution in occupant zone at steady state conditions. The constant internal load of 1600W, velocity of supplied air of 0.75m/s and chilled ceiling temperature of 20°C is assumed constant. The supplied air temperatures to be been investigated is 18°C.
Figures 16 to 18 show the velocity vectors (Y-Z), (X-Z) and (X-Y) planes for temperatures of supplied air 18°C.
At supplied air temperature of 18°C, the (Y-Z) plane located at X (100,0,-100)cm, (X-Z) plane located at Y (10,110,170 and 265)cm and (X-Y) plane located at Z (50,0 and -50)cm. The locations of plans are chosen to pass through the heat source to show the flow behavior through it.
Figure 16 shows the velocity vector in (Y-Z) plane at different locations of X (100,0and-100)cm. It's clear that at X=-100cm, the room air is flowing with high velocity at floor level and reach at some locations near and above heaters to 0.2m/s due to the effect of heating of the heaters and throw of supplied cold air. Also it can be noticed that the room air is denser at floor level since the cooling supplied air at floor level. While the room air becomes lighter with height of room due to the heating of heaters as
a result the room air flow upward. When air reaches the chilled ceiling the another heat exchange occurs so the air room becomes denser at ceiling level and flow down ward. At X of zero notice that the velocity of air room reaches about 0.5m/s at height not exceeds 0.31m since this zone is affected by throw of supplied air velocity. The air becomes lighter with height and flow upward. When air reaches the ceiling level some of lighter air room flows toward the opening of return air duct. After reaching the air to the chilled ceiling the exchange of the heat is done from air to chilled ceiling, so the air becomes denser and cooler and flow downward. At X of 100 the same behavior is notification as that at of room air at X of -100. The turbulent flow is more clearly shown in this section.
[image:13.595.114.479.403.700.2]Figure17 shows the velocity vectors in (X-Z) plane at different locations of Y(10,110,170 and 265)cm. Generally it can be noticed that the maximum air velocity at Y of 10cm is affected by the heating of the heaters and velocity of supplied air. The velocity of the air decreases at Y 110cm because the air room at Y of 10cm is subjected to the throw of supplied of cooling air. The air is heated more with height and as a result it becomes lighter with the increase height of room and flow upward. At Y of 170cm, the air becomes lighter with increase in velocity and causes turbulent flow. At Y of 265cm, the air reaches ceiling with relatively high velocity and the vortices exits with turbulent flow can be noticed.
Figure 17. The velocity vector at Y direction and temperature of ceiling 20°C, velocity of supply air is 0.75m/s and temperature of supply air is 18°C
[image:14.595.101.493.436.740.2]Figure (18) show the velocity vector at (X-Y) plane that locates at different Z position of (-50,0and 50)cm. At Z of -50cm the air with relatively high velocity at floor level is affected by the heaters and throw of supplied air. With height increase of the room, the air velocity increases and flow up ward but remain less than velocity of supplied air. The denser air can be noticed at floor level and ceiling level since these levels is considered the coldest area in the room. The turbulence and vortices is exits and increase with height of the room. The same manner can be noticed at Z position of zero and 50cm.
Figures 19 to 21 show the temperatures contours in(Y-Z), (X-Z) and (X-Y) planes for temperatures of supplied air 18°C.
At supplied air temperature of 18°C, the (Y-Z) planes located at X (120,0,-120)cm, (X-Z) plane located at Y (10,110,170 and 265)cm and (X-Y) plane located at Z (100,0 and -100)cm. The locations of planes are chosen to pass through the heat source to show the flow behavior through it.
[image:15.595.96.496.251.616.2]Figure 19 shows the temperature contours in (Y-Z) plane at different locations of X (120,0and-120)cm. It's clear that at X=-120cm, the cooler air room at floor level since the heat transfer take place between supplied air and air room at floor level with temperature of 18°C. The temperature of air increases with height until reach chilled ceiling and the heat transfer achieved between room air and chilled ceiling. The same behavior is noticed at X of zero and 120cm.
Figure 20 shows the temperature contours in (X-Z) plane at different locations of Y(10,110,170 and 265)cm. Generally notice that the minim air room temperature at Y of 10cm since it locates at supplied cooled air level. The temperature of the room air increases at Y 110cm. The air
[image:16.595.119.477.146.496.2]is heated more with height. At Y of 170cm, the air temperature increases. At Y of 265cm, the air reaches ceiling with relative high velocity and the air room is cooled by chilled ceiling.
Figure 21. The temperature contour at Z direction and temperature of ceiling 20°C, velocity of supply air is 0.75m/s and temperature of supply air is 18°C
Figure 21 shows the velocity vector at (X-Y) plane located at different Z of (-100,0 and 100) cm. At different Z positions the (X-Y) temperature contours have the same behavior of (X-Z) as mentioned above in describing figure 21.
8. Conclusions
Experimental and theoretical study presented in this work to produce integral cooling system to achieve thermal comfortable conditions and to design a system that is friendly with environment under Iraq, Baghdad climate also with new design of radiant chilled ceiling using in experimental work. Figure from 6 to 13 show the ability of combine system to a chive thermal conditions. It's clear from all figures, combined system able to achieve thermal conditions for different air supply temperature and mean plate temperature since the PMV and PPD value lie in limited range specific by ASHREA 55 standard. Also
Figures from 16 to 21 show the theoretical results that appear good distribution of air through the occupied zone and suitable velocity that choose for supplied air.
Nomenclature
L: Length, m W: Width, m H: Height, m Q: Heat transfer, WJP: Total radiosity that leaves panel surface, W/m2
Ji: Radiosity from another surface in room W/m2
Fpj: Radiation angle factor between panel surface and another surface in room
qr: Radiation heat flux W/m2
Fr: Radiation exchange factor °C qc: Convection heat flux W/m2
A: Area m2
Greek Symbols
ε: emittance
ɳ: ration between heats remove by chilled ceiling to total cooling load
Subscripts
P: Plate r: Radiation C: Convection In: inlet Out: outlet W: WaterAbbreviations
DV: Displacement Ventilation
AUST: Area-weighted average temperature of uncontrolled surface in room
PMV: Predicated Mean Vote PPD: Percentage People Dissatisfied CC: Chilled Ceiling
CP: Specific Heat at constant Pressure CL: Cooling Load
ASHRAE: American Society for Heating, Refrigeration and Air Conditioning Engineers
VATD: Vertical Air Temperature Difference
Appendix A
Analysis of Experimental Error
A-1Analysis of Experimental Error
When an experimental test are carried out, an accurate readings should be taken, since any mistakes could reduce the accuracy of the results. Error of the reading can take place due to following errors:
Inherent Error
This type of error is due to human measurement error when reading the apparatus or the instruments used in experimental parts of the tests.
The uncertainties in each individual measurement lead to the uncertainties in the experiment, which are given in table (A-1).
Table (A-1). The uncertainties in each individual measurement Independent Variable Uncertainties The average hot water temperature
±
0.5 The average coil surface temperature±
0.1mass flow rate
±
2.16%Computational Error:
This type is called "Round off Error" which takes place due to floating digits present in the calculations presents in the process of finding the final results.
There are more than one method which can be used to find the experimental error. One of these methods is that given by:
Kline & Melintock which depends on the assumption that when calculating a variable as R for example, which as to be calculated from a certain experimental test. This variable is assumed to be related to a number of in depended variables as J1,J2,J3. Then
R= f (J1, J2, J3) (A-1) During experimental test, there will be error in the in dependent variables , which is (W1,W2,W3) respectively ,so the percentage of error in calculating the variable ( R ) ,which is due to errors in the in dependent variables , can be calculated from the following equation:
∂ ∂ ∂ ∂ + ∂ ∂= W j
J R W j J R W j J R
W R 32
3 2 22 2 2 12 1
2 21 (A-2)
The percentage error in the variable R is calculated as:
(A-3)
The above mention method is used for error analysis of different variables calculated in this work. The measured quantities and the errors estimated for each them are as follows.
The equations used for calculating the percentage experimental errors of variables in as follows:
Error in calculating the value of heat transfer coefficient. h=2.12 × (TNear Ceiling –Tmp)0.31 (A-4)
[image:18.595.308.535.92.152.2] [image:18.595.320.539.472.536.2](A-6)
T
NearCeiling=30.1 °C
T
mp=16.5°C
The uncertainties in the independent variables are: The uncertainty in water temperature Ww =
±
0.5The uncertainty in man plate surface temperature WTmp =
±
0.1 The error in ∆T can be expressed as follows:(
0
.
5
)
2
(
0
.
1
)
2
1
/
2
Tmp
=
+
W
W
Tmp=
0
.
5099
Sub values in Eq.(A -5)
Error in calculating the value of convection heat transfer by CC
q
c=h
×
(T
Near Ceiling– T
mp)
(A-10)
∂ ∂ + ∂
∂
= W T mp
T mp qc W TNearceiling T Nearciling
qc W qc
2 2
2 21 (A-11)
(A-12)
Error in calculating the value of cooling capacity of CC
(A-14)
(A-15)
Error in calculating value of cooling capacity of DV
Q
a=
𝑚̇
a×
Cp
a×
(T
R–T
S)
(A-16)(A-17)
(A-18)
REFERENCES
A. Novoselac and J. Serebric "A critical review on the [1]
performance and design of combined cooled ceiling and displacement ventilation ", Energy and Building 34497-509, 2002.
Jae-Weon Jeong and Stanley A. Mumma (2003)" Ceiling [2]
radiant cooling panel capacity enhanced by mixed convection in mechanically ventilated spaces" Applied Thermal Engineering
Muslmani, Nesreen Ghaddar, and Kamel Ghali, [3]
"Performance of combined displacement ventilation and cooled ceiling liquid desiccant membrane system in Beirut climate" Journal of Building Performance Simulation vol 9 Issue 6, 2016.
Ch. Zhang, P. Heiselberg, Q. Chen, M. Pomianowski and Ch. [4]
Zhang(2017)" Numerical analysis of diffuse ceiling ventilation and its integration with a radiant ceiling system "Volume 10, Issue 2, pp. 203–218.
Alessandro Simoncini , Vincenzo Tagliaferri and Nadia [5]
Ucciardello ,2016," High Thermal Conductivity of Copper Matrix Composite Coatings with Highly-Aligned Graphite Nanoplatelets"
Price, (2011)"Engineering Guide Radiant Products" [6]
G. Wang and S. P. Vanka, Convective Heat Transfer in [7]
Periodic Wavy Passages, International Journal of Heat and Mass Transfer, Vol. 38, pp. 3219-3230, 1995.
ASHRAE Handbook, (2000) HVAC Systems and [8]
Equipments (SI) “Panel Heating and Cooling”, Chapter 6. S. P. Silva, M. A. Sabino, E. M. Fernandes, V. M. Correlo, L. [9]
F. Boesel and R. L. Reis (2005)" Cork: properties, capabilities and applications " International Materials Reviews 2005 VOL 50 NO 6 347
Cunha et al ,2008," Fan and Blowers Energy Efficiency and [10]
Reference Guide"
Hidria,2011, " Circular diffuser and Square diffuser Guide" [11]
Dave Janquart, 2014," Duct Design" [12]
ASHRAE Handbook, (2009) HVAC Systems and [13]
John Canivan ,2004,book of "How to Build a Solar Hot [14]
water system"
G. Wang and S. P. Vanka, Convective Heat Transfer in [15]
Periodic Wavy Passages, International Journal of Heat and Mass Transfer, Vol. 38, pp. 3219-3230, 1995.
ASHRAE Handbook, (2000) HVAC Systems and [16]
Equipment (SI) “Panel Heating and Cooling”, Chapter 6. Schiavon, S ,Bauman, FS and Tully, B(2015)" Chilled [17]
ceiling and displacement ventilation system: Laboratory study with high cooling load" Science and Technology for the Built Environment, 21(7)
L. Jalil, A.H.Taki and D.L. Loveday (200)"
[18]