Saito, Kazuya and Ilkan, M. and Magne, V. and Tran, M. and Suzuki, S.
(2018) Acoustic characteristics and learner profiles of low, mid and high-level
second language fluency. Applied Psycholinguistics 39 (3), pp. 593-617.
ISSN 0142-7164.
Downloaded from:
Usage Guidelines:
Please refer to usage guidelines at or alternatively
Acoustic characteristics and
learner profiles of low, mid
and high-level second
language fluency
KAZUYA SAITO
Birkbeck, University of London
MELTEM ILKAN
Birkbeck, University of London
VIKTORIA MAGNE
University of West London
MAI TRAN
Birkbeck, University of London
SHUNGO SUZUKI
Lancaster University
ABSTRACT
In the context of 90 adult Japanese learners of English with diverse L2 experience and 10 native speakers, this study examined the linguistic characteristics and learner profiles of low, mid and high-level fluency performance. The participants’ spontaneous speech samples were first rated by 10 native listeners for global fluency on a 9-point scale (1 =dysfluent, 9 = very fluent), and then divided into four proficiency groups via cluster analyses: low (n = 29), mid (n = 30), high (n = 31) and native (n = 10). Next, the dataset was analyzed for the number of pauses in mid/final clauses, articulation rate and the frequency of repetitions/self-corrections. According to the results of a series of ANOVAs, the number of final-clause pauses differentiated low and mid-level fluency performance; the number of mid-clause pauses differentiated mid and high-level performance; and articulation rate differentiated high and nativelike performance. The analyses also found that the participants’ L2 fluency was significantly associated with their length of residence profiles (0-18 years), but not with their age of arrival profiles (19-40 years).
In the field of second language acquisition (SLA), there is a growing consensus among a range of theoretical perspectives that adult second language (L2) learners’ speech can continue to develop as a function of increased practice and experience (i.e., experience effects), and that the extent to which these learners can eventually improve their L2 performance is strongly tied to their age of acquisition (i.e., age effects) (e.g., Flege, 2016 for Speech Learning Model). While much discussion in this research area has concerned the acquisition of L2 segmentals (Piske, MacKay, & Flege, 2001), a growing number of L2 speech researchers have also examined the underlying mechanisms of L2 fluency development.
The existing literature has extensively worked to illustrate which subconstructs of L2 speech (speed, breakdown, repair) determine native speakers’ perception of fluency, and what kinds of learner factors are crucial for efficient and effective fluency development (for a comprehensive review, Segalowitz, 2016). Due to the relatively limited quantity and quality of samples used in previous studies, however, little is known about the acoustic correlates of perceived fluency at different proficiency levels, and the role of learner variables (experience, age) in the attainment of various levels of L2 fluency performance.
In the context of 90 adult Japanese learners of English with diverse L2 experience and 10 native speakers (N = 100), this study aimed to examine the specific linguistic characteristics and learner profiles of low, mid and high-level fluency performance. First, we elucidated which aspects of temporal information—speed, breakdown and repair—native speakers differentially relied on while assessing the overall fluency of the native and non-native speech samples. Subsequently, we probed the extent to which these beginner-, intermediate-, and advanced-level L2 fluent learners differed in terms of the length of residence (0-18 years) and the age of arrival (19-40 years) to an L2 speaking environment.
BACKGROUND
Second Language Perceived, Utterance and Cognitive Fluency
In its broadest sense, fluency—especially in practice—has been considered as equivalent to general oral proficiency (Chambers, 1997). On a more narrow scale, many L2 scholars have focused on which acoustic properties relate to the optimal, smooth and fluid delivery of L2 speech (utterance fluency), and how these features interact to influence native speakers’ fluency judgements of L2 speech (perceived fluency) (Skehan, 2003; Tavakoli & Skehan, 2005). In the existing literature, the components of utterance fluency have been analyzed through three groups of objective measures: (a) breakdown (e.g., the number of filled and unfilled pauses between and within clauses; (b) speed (e.g., the number of pruned syllables uttered per minute); and (c) repair (e.g., the number of repetitions and self-corrections) (Bosker, Pinget, Quené, Sanders, & De Jong, 2013). As summarized in Table 1, it has been generally shown that native speakers’ fluency judgements can be mainly associated with the breakdown and speed measures, and, to a much lesser degree, linked to the repair measures.1
1 Notably, the repair measures were differently operationalized among the primary studies, such as the
Table 1. Summary of Five Major L2 Fluency Studies Examining the Relationship between Perceived and Utterance Fluency Sample
size Participant proficiency levels Significant predictors
Kormos & Dénes
(2004) N = 16
• Intermediate L2 English learners (5 years of FL; LOR = 0.5-1 year)
• Beginner L2 English learners (5 years of FL; LOR = 0 years
• Speed fluency (speech rate, phonation time ratio, the mean length of run)
Derwing et al.
(2004) N = 20
• Intermediate L2 English learners (< 0.5 years of LOR)
• Breakdown fluency (no. of pauses) • Speed fluency (speech rate)
Rossiter (2009) N = 24 • Intermediate L2 English learner (3.7 years of LOR)
• Breakdown (no. of pauses) • Speed fluency (speech rate)
Bosker et al.
(2013) N = 38
• Intermediate L2 Dutch learners • Native speakers
• Breakdown fluency (no. of silent pauses) • Speed fluency (mean length of syllables) • Repair fluency (no. of
repetitions/self-corrections) Préfontaine et al.
(2016) N = 40
• 40 L2 French learners (with varied proficiency levels)
Furthermore, a growing number of SLA scholars have also examined the cognitive processes underlying fluent speech performance (cognitive fluency). For example, Kormos (2006) proposed that certain aspects of utterance fluency measures (breakdown, speed, repair) can reflect three different stages of L2 speech production—conceptualizing the message, encoding and formulating linguistic information, and monitoring one’s own output. Specifically, one breakdown fluency measure—the number of final-clause pauses—is argued to signal L2 learners’ engagement with conceptualization and content planning; another breakdown measure—the number of mid-clause pauses—is related to the present state of L2 learners’ timely phonological, lexical and syntactic encoding; repair fluency measures reflect the amount of attentional resources that L2 learners have for the purpose of monitoring their own speech. Comparatively, speed fluency measures (e.g., speech/articulation rate) are thought to involve every dimension of L2 speech production (conceptualization, formulation, monitoring), and act as a crucial indication of automatization.
Whereas much attention has been given to examining the complex relationships between perceived, utterance and cognitive fluency, the extent to which these different components of fluency actually develop as L2 learners become more proficient over time (beginner →
intermediate → advanced) has remained surprisingly understudied. As observed in Table 1, previous studies have drawn on relatively small datasets focusing on particular groups of L2 learners with relatively homogenous proficiency levels (N = 16-40)—a common methodological problem in the field of SLA, as pointed out by Norris, Plonsky, Ross and Schoonen (2015). According to a componential view of proficiency, L2 speech is a composite phenomenon constituting both global dimensions (e.g., perceived fluency) and subconstructs (e.g., breakdown, speed and repair fluency) (De Jong, Steinel, Florijn, Schoonen, & Hulstijn, 2012), and the associations between these global and subskill domains may vary in relation to different proficiency levels (Higgs & Clifford, 1982). In L2 assessment research (which is outside of the domain of L2 fluency research), for example, it has been shown that the relative weight of vocabulary appropriateness as measured by global oral proficiency judgements (e.g., comprehensibility, communicative adequacy) may be strong for low-level proficiency L2 learners, while grammar and pronunciation accuracy could be more distinguishing of high-level proficiency L2 learners (e.g., Isaacs & Trofimovich, 2012).
the first three or four repetitions; and their self-repairs substantially declined only between the fourth and fifth repetitions.
Taken together, the previous literature suggests that adult L2 learners’ improvement can be observed particularly (a) in the development of breakdown and speed fluency by enhancing their smooth and fluid access to the conceptualizer and formulator in the initial stage of SLA (beginner to intermediate); and (b) in the development of repair and speed fluency by optimizing the process of monitoring in the later stages of SLA (intermediate to advanced). Following this line of thought, the current study aimed to revisit the acoustic correlates of low-, mid- and high-level fluent speech in the context of a relatively large-scale dataset covering a wide range of proficiency levels (N = 100).
Experience and Age Effects on Adult Second Speech Learning
In the field of L2 speech research, scholars have explored two essential questions regarding the mechanisms underlying successful L2 pronunciation learning—(a) how adult L2 learners can quickly improve the spectral and temporal dimensions of consonants and vowels in relation to increased experience—i.e., the role of experience in rate of learning; and (b) the extent to which they can eventually refine the nativelikeness of their pronunciation proficiency, especially in accordance with learners’ age of acquisition—i.e., the role of age in ultimate attainment (for a comprehensive review, see Saito, in press). With respect to the former (rate of learning), length of residence (LOR) has been considered as a rough proxy for L2 experience, as it does not always mirror how L2 learners actually use the target language. For example, certain learners could choose to use their L1 rather than L2 as the primary language of communication for the duration of their potentially extensive residence (Flege & Liu, 2001). However, there is ample evidence that adult L2 speech learning continues to take place as a function of increased LOR, as long as learners use the target language through interaction with other native and non-native speakers on a daily basis (e.g., Derwing & Munro, 2013; Saito, 2015).
Within the first few years of immersion, many adult L2 learners’ phonological forms quickly become intelligible, especially in the context of frequently-used words (Munro & Derwing, 2008 for vowels; Saito & Munro, 2014 for approximants). These L2 learners appear to continue to enhance their segmental (e.g., Baker, 2010 for stops; Saito & Brajot, 2013 for approximants; Flege, Bohn, & Jang, 1997 for vowels) and prosodic (e.g., Trofimovich & Baker, 2006 for word stress and intonation) accuracy over an extensive period of time (e.g., 5-10 years of LOR). This process of phonological re-attunement is assumed to facilitate learners’ comprehension and production of a number of phonologically similar words (e.g., minimal pairs) (Bundgaard-Nielsen, Best, & Tyler, 2011), and is used as empirical support for many theoretical accounts which claim that even adult L2 learners can learn new sounds in a manner similar to L1 acquisition (e.g., Flege, 2016 for Speech Learning Model; Best & Tyler, 2007 for Perceptual Assimilation Model-L2).
language at a native-like level based on mere exposure (Abrahamsson & Hyltenstam, 2008; Granena & Long, 2013), or because certain cognitive abilities (e.g., working memory, brain size, speech processing, attentional/inhibitory control) relevant for successful language acquisition likely decline after the age of 18-20 years (Birdsong, 2006; Saito, 2013).
Although L2 pronunciation learning involves a wide range of acoustic phenomena (e.g., the accurate and fluent use of consonants, vowels, word stress, intonation and rhythm), it is noteworthy that the aforementioned studies have been exclusively concerned with the effects of experience and age on the development of L2 segmental accuracy. What has remained understudied to date is the extent to which such findings could be generalized to other aspects of L2 pronunciation development (prosody, rhythm and fluency). To our knowledge, very few studies have examined the role of LOR and AOA particularly in L2 fluency development and attainment, especially focusing on a range of L2 learners with varied experience, age and proficiency profiles. With a total of 30 Korean learners of English (LOR = 0.1 to 15 years), Trofimovich and Baker (2006) showed that the participants’ breakdown fluency (the number of pauses) was associated with their LOR, especially among the inexperienced and moderately experienced learners (LOR < 3 years). In the context of 102 experienced German learners of English (LOR > 10 years), Lahmann, Steinkrauss, and Schmid (2017) did not find any significant relationship between participants’ age of arrival and their utterance fluency performance (breakdown, speed, repair), suggesting that many L2 learners may be able to attain high-level fluency as a function of increased experience regardless of their starting age of acquisition (different from L2 segmental learning, which is amenable to both experience and age effects throughout one’s life).
To further examine this topic, the current study compared 90 Japanese learners of English with varied LOR and AOA profiles (see the Method section) with 10 native speaker baselines. Our dataset departed in quantity/quality from the aforementioned studies (Trofimovich & Baker, 2006 for 30 inexperienced and experienced L2 learners; Lahmann et al., 2017 for 102 experienced learners but without any comparison with inexperienced learners nor native speakers). First, we aimed to identify low-, mid- and high- fluent speakers by way of a cluster analysis based on 10 native speakers’ subjective judgement scores (i.e., perceived fluency). Subsequently, we investigated which components of utterance fluency (breakdown, speed, repair) could distinguish between the three different Japanese (low, mid, high) and the English baseline (native) groups. Finally, we explored whether and to what degree the grouping category (low, mid, high) could be related to the participants’ LOR and AOA profiles. The following research questions and predictions were thus formulated:
1. How do breakdown, speed and repair fluency correlate with native speakers’ intuitive judgements of fluency?
2. Which utterance fluency measures distinguish between learners at low, mid, high and native levels of perceived fluency?
3. To what extent do experience and age factors influence the attainment of such different fluency levels?
METHOD
Speech Samples
A total of 90 spontaneous speech samples were drawn from our unpublished corpus, which currently comprises 500+ Japanese learners of English with varied L2 learning experience in Japan, Canada, the US and the UK (for details, see Saito, 2017; for the materials deposited in IRIS, see Marsden, Mackey, & Plonsky, 2016). All of them were native speakers of Japanese (both of their parents were L1 Japanese speakers) and started learning L2 English from Grade 7 in foreign language classroom settings in Japan.
Speakers. To cover a wide range of proficiency levels and learner profiles, the 90 participants were selected in accordance with the following categories which were adapted from Trofimovich and Baker (2006): (1) Inexperienced learners (LOR = 0 years), (2) Experienced learners (LOR < 5 years) and (3) Attainers (LOR > 6 years). For the latter two groups, care was taken to choose only those who had reported using L2 English as their main language of communication at the time of the investigation. According to the analyses of individual interviews, their L2 use was considered highly frequent on a 6-point scale (1 = infrequent, 6 = very frequent) (M = 5.3; Range 4-6). This was done to avoid including L2 learners who actually continued to use L1 Japanese despite their residence in Canada, and whose LOR factor did not correlate with the actual quantity/quality of their L2 experience (Flege, 2016). Finally, we selected from the same corpus data (4) a baseline group of native English speakers who completed the same task in order to provide the baseline data for the purpose of comparison.
1. Inexperienced Japanese learners (n = 10). A total of 10 inexperienced university-aged Japanese learners (at the time of the project) were chosen to provide the lower range of the baseline data (L2 learners without any experience abroad) (M age = 20.4 years; Range = 18-21 years). Since they had never stayed nor studied abroad (LOR = 0 months), their performance was considered to serve as a proxy for the initial stage of Japanese learners’ L2 fluency development (solely based on their six years of foreign language experience in Japan).
2. Experienced Japanese learners (n = 40). A total of 40 Japanese learners were chosen for the “experienced” category (M age = 34.7 years; Range = 22-48 years). These learners had a range of LOR profiles in Vancouver and Calgary, Canada (M = 1.4 years; Range = 0.1 to 5 years) with widely different AOA points (M age = 28.3 years; Range = 19-40 years). Given the cross-sectional (Trofimovich & Baker, 2006) and longitudinal (Munro & Derwing, 2013) evidence that much L2 speech learning likely takes place over an extensive period of immersion (LOR = 0-5 years), their performance was assumed to represent the mid stage of L2 fluency development.
3. Japanese attainers (n = 40). In line with the standards in L2 ultimate attainment research (e.g., DeKeyser, 2013), a total of 40 Japanese attainers were also included (M age = 40.2 years; Range = 28-63 years). They had been in Canada for at least six years (M = 11.3 years; Range = 6-18 years), and had various AOA profiles (M age = 27.1 years; Range
=21-36 years). Their performance was considered to indicate the final stage of L2 fluency development.
been using English as their L1 from birth onwards and had limited knowledge/use of the other official language in Canada—French.
Task procedure. All the speakers engaged in a timed picture description task designed to elicit spontaneous language production, where the primary focus was on conveying meaning rather than form under communicative pressure (Spada & Tomita, 2010). The task was developed based on picture description tasks which have been widely used in previous L2 speech research where L2 learners explained a series of pictures in a sequence (e.g., Derwing et al., 2009) or a single picture (e.g., Munro & Mann, 2005).2 In this task, the participants described seven pictures with a limited amount of planning time (i.e., 5 seconds per photo). Whereas the first four pictures were used as practice for participants to get used to the task procedure (describing a photo with little planning), the remaining three pictures were used for the final analyses. Given that the current study included inexperienced learners who had noted much difficulty in producing free speech, especially due to the significant lack of their conversational experience inside/outside classrooms, the decision was made to provide three key words so that they could at least start producing language without too much silence at the beginning of each picture description.3
The first 10 seconds of each picture description were cut, combined and saved in a WAV file for each speaker (10 seconds × 3 pictures = 30 seconds in total). Efforts were made to ensure that each sample started from the beginning of the picture description without initial dysfluencies (e.g., false starts, hesitations) and ended at a phrase boundary. The total length of each speech sample— 30 seconds per speaker—was comparable to previous fluency research (e.g., Bosker et al., 2013 for 20 sec; Derwing et al., 2009 for 20 seconds).4 All the speech data were individually recorded in a quiet room in a community center, a university lab and the participants’ residences using digital Roland-05 audio recorders (set to 44.1 kHz sampling rate with 16-bit quantization).
2 The picture description format was selected, as it has been found to induce L2 learners to pay more
attention to linguistic formulation and production (resulting in more accurate and fluent language) compared to interview tasks, where L2 learners simply talk about familiar topics with a greater focus on the conceptualization of the intended message (resulting in more complex language) (Foster & Skehan, 1996).
3 In a pilot data collection, we found that some inexperienced Japanese learners spent much time (> 30
sec) planning what to say before starting to describe a picture when they were not given any key words. To make sure that all participants were to say something right after five seconds of planning time, a decision was made to provide three simple key words that they were asked to use for each picture description. These key words included (a) rain, table and driveway (to describe a table left out in driveway), (b) three guys, guitar and rock music (to describe three men playing rock music with guitars) and (c) blue sky, road, cloud (to describe a long road under a cloudy blue sky).
4 Different from other fluency research using a relatively large speech samples (> 1 min) (e.g., Lambert et
al., 2017), we decided to use relatively short speech samples (30 sec) to avoid unwanted fatigues during the relatively long listening sessions (2 hours). Of course, it could have been possible to ask the listeners to engage in even longer sessions over several days to assess longer samples. Noteworthy is, however, that intensive and extensive exposure to particular accented speech can affect native listeners’ L2 speech assessment patterns (e.g., their judgements of Japanese accented English may become stricter: see Flege & Fletcher, 1992 for the relationship between the length of rating sessions and listeners’ accent
Perceived Fluency Analyses
Listeners. A total of 10 native listeners were recruited in London, UK to assess all the speakers’ global fluency (Mage = 29.3 years; Range = 18-51 years). They were born and raised in English-speaking families in London and had at least one native English-English-speaking parent. None of the participants had studied Japanese prior to the project. Their familiarity with Japanese accented English was moderate (M = 2.9, Range = 1-4) on a 6-point scale (1 = not at all, 6 = very much).5
Rating procedure. Following the methodology by Derwing et al. (2009), the listeners first received a brief explanation on the definition of perceived global fluency (i.e., the flow and smoothness of speech); notably, raters were not asked to pay attention to specific sub-constructss of L2 speech (i.e., utterance fluency features), such as the number of pauses, repetitions and self-corrections. Next, they proceeded with a practice session where they rated three speech samples (not included in the main dataset) and explained their decisions for each sample. After we ensured that each listener focused on fluency (the raters’ comments mainly concerned “tempo” rather than overall proficiency, accuracy nor complexity of L2 speech), they proceeded to assess a total of 100 speech samples which were played in a randomized order through Praat (Boersma & Weenink, 2012) on a 9-point scale (1 = not fluent, 9 = very fluent).
As operationalized in the previous literature (e.g., Bosker et al., 2013) and in order to tap into their initial intuitions and impressions about the L2 speech, the listeners were permitted to listen to each sample only once. In addition, the listeners were explicitly told to use the entire 9-point scale as much as possible, and were informed that the dataset represented a wide scope of adult L2 fluency proficiency ranging from inexperienced learners (without any experience abroad) to experienced learners (with extensive length of residence in an L2 speaking environment) to native speakers. Since each listener session took approximately two hours (including explanation, training and rating), all the listeners took a 10 min break halfway through.
Inter-rater agreement. According to the results of Cronbach alpha analyses, the 10 listeners showed relatively high inter-rater agreement on their intuitive judgements of perceived L2 fluency (α = .98) in line with other fluency studies (e.g., Bosker et al., 2013 for α = .97).
Utterance Fluency Analyses
All the speech samples were first transcribed into Analysis of Speech units (Foster, Tonkyn, & Wigglesworth, 2000). Conforming to Kormos’s (2006) utterance and cognitive fluency model, these samples were coded for three different dimensions of utterance fluency (breakdown, speed, repair) which are assumed to correspond to four stages of L2 speech production (conceptualization, formulation, articulation, monitoring). We purposefully selected these utterance measures as they have been found to demonstrate little inter-collinearity (Bosker et al, 2013). For breakdown fluency, the number of filled (e.g., ah, oh, eh) and unfilled (> 250ms: Bosker et al., 2013) pauses in the middle and end of clauses were manually calculated and divided by the total number of
5The listeners were from the UK, whereas the speech samples were collected mostly in Canada and,
hence, exposed to a Canadian variety of English as opposed to British English. To our knowledge, however, little attention has been given to the role of listener factor in L2 fluency assessment. We are currently conducting a follow-up study by asking native and non-native listeners with various
words.6 For speed fluency, the total phonation time (without all filled pauses) was divided by the
total number of syllables (i.e., articulation rate). For repair fluency, the number of repetitions and self-corrections were divided by the total number of words.
Three trained researchers served as analysts for this portion of the study—the second, third and fourth author. In a one-hour training session, they first received explicit explanation on each category of breakdown, speed and repair fluency. Next, they practiced and discussed the analytic procedure with five similar speech samples (not included in the main dataset). After they confirmed their clear understanding of the concept of the utterance fluency categories, they then analyzed 10 samples randomly selected from the main dataset in order to check inter-coder reliability. The results of Cronbach alpha analyses found relatively high alpha values for breakdown (α = .95 for filled pauses, α = .92 for unfilled pauses, α = .91 for final-clause pauses, α = .91 for mid-clause pauses), speed (α = .93 for articulation rate) and repair (α = .96 for repetitions; α = .97 for self-corrections). Finally, the three researchers were randomly assigned to analyze a subset of 30 different speech samples, respectively.
RESULTS
The first objective of the statistical analyses was to identify three different levels of L2 fluency (low, mid, high) based on the results of the 10 listeners’ rating scores of 90 non-native speech samples. To this end, a hierarchical cluster analysis using Ward’s method was adopted to categorize all the samples (n = 90) into smaller homogeneous groups. In accordance with a visual inspection of the dendogram (see Figure 1), a three-factor solution was adopted, dividing 90 Japanese learners into three groups—low (n = 29), mid (n = 30) and high (n = 31).
The descriptive statistics of the participants’ perceived fluency scores are summarized in Table 2. According to the results of 95% confidence interval analyses, there was no overlapping of the groups’ mean scores, indicating that the four groups (low, mid, high, native) significantly differed in their perceived fluency performance at a p <.05 level.
The second objective of the statistical analyses was to investigate the relationship between the five utterance fluency measures—final-clause pause ratio, mid-clause pause ratio, articulation rate, repetition ratio, and self-correction ratio (for the descriptive results, see Table 2). According to the results of Pearson correlation analyses (as summarized in Table 3), three significant correlations were found: between final-clause pauses (breakdown) and articulation rate (speed); mid-clause pauses (breakdown) and articulation rate (speed); and repetitions and self-corrections (repair) (p
< .005, Bonferroni corrected). In contrast, such significant correlations were not found for the two breakdown measures (mid-clause vs. final-clause pauses). The repair measures were not significantly associated with the breakdown nor the speed measures (p < .005). In keeping with Kormos’s (2006) proposal, the results suggest that the five utterance fluency measures included in the current study seem to tap into the participants’ abilities to perform three separate cognitive operations during L2 speech production: (a) conceptualization (final-clause pauses, articulation ra-
6 The breakdown measures were operationalized as the “frequency” (but not “length”) of pauses at final
Figure 1.Dendrogram Tree of Hierarchical Clusters based on the Participants’ Perceived Fluency Scores
te), (b) formulation (mid-clause pauses, articulation rate), and (c) monitoring (repetitions, self-corrections).
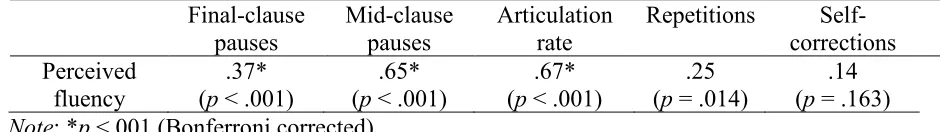
The third objective of the statistical analyses was to illustrate the acoustic correlates of the 10 native listeners’ intuitive fluency judgements of the 100 native and non-native speakers. Given that the listeners demonstrated relatively high inter-rater agreement as to L2 fluency judgements (α > .95), the perceived fluency scores were averaged across raters to generate a single score for each speaker. To analyze the relationship between the perceived and utterance fluency, the mean fluency scores (dependent variable) and all the breakdown, speed and repair measures (independent variable) were first analyzed via a set of Pearson correlation analyses. As shown in Table 4, the perceived fluency scores were significantly linked to mid- and final-clause pauses and articulation rate (p < .010, Bonferroni corrected). However, the role of the repair factor (repetition, self-correction) in perceived fluency remained unclear, as the correlation between the repetition ratio and perceived fluency reached only marginal significance (p = .014).
Table 2. Descriptive Statistics of Perceived and Utterance Fluency Scores Low Fluency
(n = 29)
Mid Fluency (n = 30)
High Fluency (n = 31)
Native Fluency (n = 10)
M SD 95% CI M SD 95% CI M SD 95% CI M SD 95% CI
A. Perceived fluency
Perceived fluencya 2.7 1.4 2.2-3.2 5.4 1.6 4.9-6.0 7.4 1.2 7.0-7.8 8.7 0.6 8.3-9.1
B. Utterance fluency Final-clause pause ratio
(Breakdown) .18 .11 .14-.23 .13 .08 .09-.16 .11 .07 .08-.14 .07 .03 .05-.10 Mid-clause pause ratio
(Breakdown) .30 .17 .23-.36 .18 .12 .14-.12 .09 .07 .07-.12 .04 .05 .01-.08 Articulation rate 2.50 0.56 2.28-2.71 2.86 .39 2.72-3.01 3.28 0.44 3.12-3.44 4.20 0.71 2.88-3.16
Table 3. Results of Pearson Correlation Analyses between Five Utterance Fluency Measures Mid-clause ratio (breakdown) Articulation rate (breakdown) Repetition ratio Self-correction ratio
r p r p r p r p
Final-clause ratio
.059 .561 .402 < .001* .093 .358 .250 .012
Mid-clause ratio
.610 < .001* .120 .236 .275 .006
Articulation rate
.062 .542 .182 .070
Repetition ratio
.425 <.001*
Note: *p <.005 (Bonferroni corrected)
Table 4. Correlation Coefficients between Perceived Fluency Scores and Five Utterance Fluency Measures Final-clause pauses Mid-clause pauses Articulation rate
Repetitions Self-corrections Perceived
fluency
.37* (p < .001)
.65* (p < .001)
.67* (p < .001)
.25 (p = .014)
.14 (p = .163)
Note: *p <.001 (Bonferroni corrected)
listeners used speed fluency (articulation rate) as a primary cue, and breakdown (mid- and final-clause pauses) as a secondary cue for the perceived fluency judgements.
The fourth objective of the statistical analyses was to examine how the five utterance fluency scores (final-/mid-pauses, articulation rate, repetitions, self-corrections) distinguished between the four different perceived fluency groups (low, mid, high, native). A set of one-way ANOVAs were performed with perceived fluency level as the grouping factor and each of the utterance fluency scores as the dependent variable (Bonferroni corrected, p < .016).
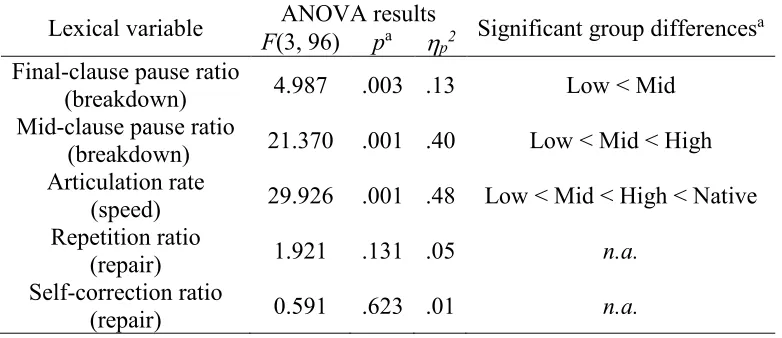
As shown in Table 6, the results of ANOVAs found that whereas the final-clause pause factor distinguished between low and mid levels of perceived fluency (p = .015), the pause ratio of the other groups (mid, high, native) appeared to be similar (p > .016). The mid-clause pause factor differentiated not only between low and mid levels of perceived fluency (p = .001), but also between mid and high levels of perceived fluency (p = .005). Interestingly, there was no statistically significant difference in the mid-clause pause ratio between the high and native fluency groups (p > .016). The articulation rate factor distinguished between all four different levels of perceived fluency (p = .006 for low and mid, p = .002 for mid and high, p < .001 for high and native). Last, the ANOVAs did not find any significant group effects for the repair factors (repetition and self-correction ratio) at a p < .016 level.
[image:14.612.68.538.309.375.2]Table 5. Results of Multiple Regression Analysis Using Acoustic Variables as Predictors of Perceived Fluency
Predicted variable Predictor variables Adjusted R2 R2 change F p Perceived fluency Articulation rate .45 .45 79.86 < .001
Mid-clause pauses .53 .08 57.77 < .001 Final-clause
pauses .57 .04 44.23 < .001
[image:15.612.102.493.254.423.2]Note. The variables entered into the regression equation included mid-clause pause ratio, final-clause pause ratio, articulation rate, repetition ratio, and self-correction ratio.
Table 6. Summary of Group Differences for Low, Mid, High and Native Levels of Perceived Fluency
Lexical variable ANOVA results Significant group differencesa
F(3, 96) pa
η
p2 Final-clause pause ratio(breakdown) 4.987 .003 .13 Low < Mid Mid-clause pause ratio
(breakdown) 21.370 .001 .40 Low < Mid < High Articulation rate
(speed) 29.926 .001 .48 Low < Mid < High < Native Repetition ratio
(repair) 1.921 .131 .05 n.a.
Self-correction ratio
(repair) 0.591 .623 .01 n.a.
Note: a p <.016 (Bonferroni corrected)
learners, 30 mid fluent learners, 31 high fluent learners) significantly differed according to their LOR backgrounds (0-18 years). The results yielded a significant effect of Group, F(2, 87) = 49.264,
p < .001,
η
p2 = .53, indicating that the experience factor (LOR) accounted for 53% of the variance in the participants’ perceived fluency performance. A set of multiple comparison analyses further revealed that the LOR factor significantly distinguished three different levels of perceived fluency (p < .001 for low and mid, mid and high) at a p < .025 level (Bonferroni corrected).In terms of the influence of the participants age profiles (age of arrivals), we eliminated from the dataset a total of 10 inexperienced Japanese learners, all of whom belonged to the low fluency group, as they had no AOA records due to the lack of their experience abroad. With the remaining 80 Japanese learners (19 low fluent learners; 30 mid fluent learners; 31 high fluent learners), results of a one-way ANOVA did not find a significant effect of Group, F(2, 77) = .441, p = .645,
η
p2 = .02 (summarized in Table 8). Thus, the results here hinted that AOA did not play a substantial role in the attainment of high-level fluent speech.Table 7. Descriptive Statistics of Learner Length of Residence Profiles
Low Fluency (n = 29)
Mid Fluency (n = 30)
High Fluency (n = 31)
M SD 95%
CI M SD
95%
CI M SD 95% CI
Length of residence
(years) 0.4 1.1 0.0-0.8 5.4 4.5 3.7-7.1 10.6 4.94
[image:16.612.72.544.224.299.2]8.8-12.4
Table 8. Descriptive Statistics of Learner Age of Acquisition Profiles
Low Fluency (n = 29)
Mid Fluency (n = 30)
Low Fluency (n = 31)
M SD 95% CI M SD 95% CI M SD 95% CI
Age of acquisition
(years) 27.2 5.9
24.3-30.0 28.3 4.5
26.6-30.0 27.3 4.6
[image:16.612.72.540.367.492.2]25.6-29.0
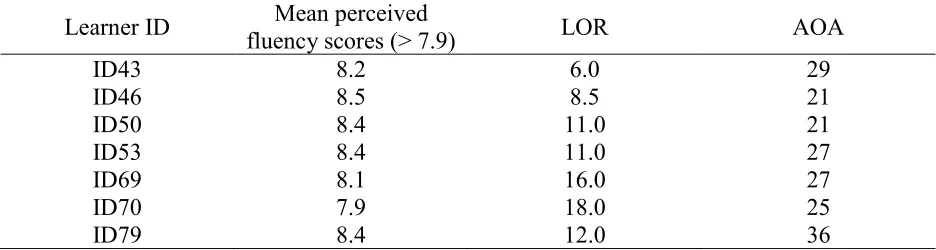
Table 9. Learner Profiles of Seven Japanese Learners Who Attained Nativelike Fluency Performance
Learner ID Mean perceived
fluency scores (> 7.9) LOR AOA
ID43 8.2 6.0 29
ID46 8.5 8.5 21
ID50 8.4 11.0 21
ID53 8.4 11.0 27
ID69 8.1 16.0 27
ID70 7.9 18.0 25
ID79 8.4 12.0 36
learners’ fluency performance was identified as nativelike. As shown in Table 9, these participants’ LOR and AOA profiles widely ranged, suggesting that neither LOR nor AOA could be a reliable predictor for the incidence of attaining nativelike L2 fluency
DISCUSSION AND CONCLUSION
to identify whether and to what degree the different proficiency levels could be related to L2 learners’ individual differences in terms of experience (operationalized as length of residence) and age of arrival (the first intensive exposure to L2 English). A summary of the results is presented in Table 10.
With respect to the first research question (the relationship between perceived and utterance fluency), the results of the correlation and multiple regression analyses showed that the native listeners tend to use speed (articulation rate) as a primary acoustic cue (explaining 45% of variance) and breakdown (final- and mid-clause pauses) as a secondary acoustic cue (explaining 12% of variance) for their overall fluency judgements. Comparatively, the extent to which they relied on the repair-related information (repetitions, self-corrections) remained unclear. The relative importance of the acoustic information in perceived fluency (speed > breakdown > repair) here is in line with findings reported in existing studies (e.g., Bosker et al., 2013).
Turning to the second research question, the current study further expounded whether and to what degree the listeners differentially used breakdown, speed and repair information while assessing different levels of speech fluency. To this end, four proficiency categories—low (n = 29), mid (n = 30), high (n = 31), native (n = 10)—were determined based on cluster analyses of the 10 native listeners’ fluency ratings of the 100 speech samples. The results of the series of ANOVAs provided three unique findings. First, the native listeners used all of the breakdown/speed measures to differentiate low- and mid-level fluency; two measures (mid-clause pauses, articulation rate) to differentiate mid- and high-level fluency; and only one measure (articulation rate) to differentiate high- and native-level fluency. The results here lend some empirical support to Cucchiarini et al.’s (2000) claim that the acoustic correlates of perceived fluency may differ depending on the level of proficiency, with breakdown fluency being a relatively strong predictor for beginners’ L2 fluency, and speed fluency for more advanced learners’ fluency.
In terms of the third research question (the role of LOR and AOA in low, mid and high-level fluency), the ANOVAs showed that the three proficiency groups significantly differed according to the participants’ LOR profiles, but not according to their AOA profiles. The results of the CI analyses (summarized in Tables 7 and 10) suggest that L2 learners may need a different amount of experience to achieve mid-level fluency proficiency (LOR > 3.7 years) and high-level fluency proficiency (LOR > 8.8 years) regardless of their age of arrival in an L2 speaking environment (18-40 years). The results here concur with previous findings on the presence of strong experience effects (Trofimovich & Baker, 2006), but a lack of any significant age effects (Lahmann et al., 2017) on L2 fluency development. Notably, this temporal aspect for L2 speech learning is different from the widely accepted view in regards to L2 segmental acquisition, where both experience and age effects are equally strong (Flege, 2016).
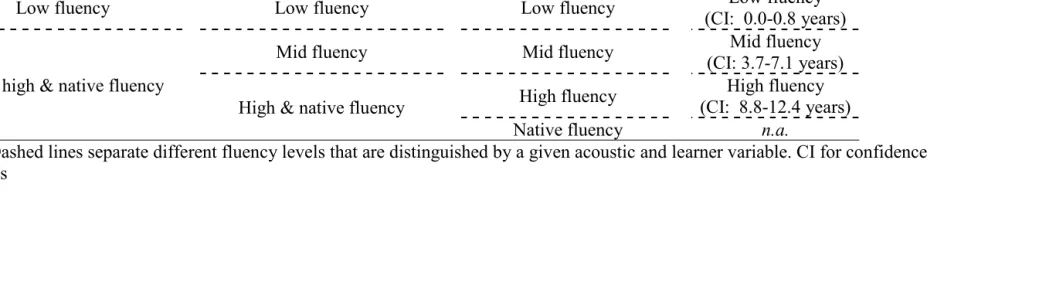
Table 10. Summary of Acoustic Characteristics and Learner Profiles of Low, Mid, High and Native Fluency Final-clause pauses
(related to conceptualization)
Mid-clause-pauses (related to linguistic encoding)
Articulation rate
(related to automatization) Length of residence
Low fluency Low fluency Low fluency Low fluency
(CI: 0.0-0.8 years)
Mid, high & native fluency
Mid fluency Mid fluency Mid fluency
(CI: 3.7-7.1 years)
High & native fluency High fluency
High fluency (CI: 8.8-12.4 years)
Native fluency n.a.
of learner awareness (explicitly and implicitly). In particular, their developmental patterns could be discussed in relation to Kormos’s (2006) proposal of the different stages of cognitive operations during L2 speech production (conceptualization, formulation, articulation, monitoring), and the amount of L2 experience required to reach each fluency level (operationalized as LOR).
In the initial stage of L2 fluency development (low → mid-level fluency), we would like to argue that much learning can be observed, particularly in the decreasing number of final-clause pauses; this claim stems from the finding that many L2 learners in the current study with adequate amounts of experience (LOR = 3.7-7.1 years) demonstrated nativelike pause frequency. As Kormos (2006) suggested, the frequency of final-clause pauses is hypothesized to capture the efficient and timely conceptualization during L2 speech production (see also Götz, 2013; Lambert et al., 2016). Thus, the findings here indicate that inexperienced L2 learners (e.g., LOR < 0.8 years) may conceptualize what to say more slowly. Given that spontaneous production entails various levels of processing operations in parallel (Skehan, 2014), this delay in conceptualization could be due to the interaction of problems at both conceptualization and formulation. That is, inexperienced L2 learners’ relatively weak representational and processing systems in the target language require excessive amounts of cognitive resources for linguistic encoding and formulation, leaving considerably less cognitive capacity that they could use for conceptualization.
As their L2 experience and proficiency increases (e.g., approximately five years of immersion), these learners may continue to enhance and then attain the more prompt and robust retrieval of the preverbal message even during spontaneous L2 speech production (like speaking an L1). Although the mildly experienced learners’ conceptualization processes may reach the nativelike efficiency in terms of the final-clause pause ratio, the other aspects of their fluency performance (mid-clause pause ration, articulation rate) could be still substantially different from advanced-level L2 learners (e.g., LOR = 8.8-12.4 years) and native speakers.
In the later stages of L2 fluency development (mid → high-level fluency), the frequency of L2 learners’ mid-clause pauses appear to reach native-like levels, suggesting that their linguistic encoding processes seem to be optimized in keeping with their gradually developing phonetic, lexical and grammatical knowledge over approximately 10 years (8.8-12.4) of LOR. To reach native-level perceived L2 fluency, however, even such experienced L2 learners still need to enhance their articulation rate by automatizing both the conceptualization and formulation processes at a faster speed (Trofimovich & Baker, 2006). Since we did not find LOR nor AOA to be predictors of perceived nativelike fluency performance, it remains open to further investigation which factors (“beyond” LOR and AOA), such as cognitive abilities (e.g., Granena & Long, 2013 for aptitude; O’Brien et al., 2006 for working memory), motivation (Saito, Dewaele, & Hanzawa, 2017 for integrativeness, instrumentality vs. metacognition) and personality (e.g., Dewaele & Furnham, 1999 for extroversion vs. introversion), could facilitate this.
clause pauses and articulation rate) and high-level fluency (mid clause pauses and articulation rate). All the relevant features here have been identified as crucial for successful L2 comprehensibility (Isaacs & Trofimovich, 2012). Our arguments here concur with a growing number of scholars who have claimed that L2 learning should concern/aim at increasing comprehensibility and intelligibility rather than nativelikeness as a realistic, prioritized and attainable goal (e.g., Derwing & Munro, 2013; Isaacs & Trofimovich, 2012; Jenkins, 2014; Saito, 2015).
Importantly, the repair factor—i.e., frequency of repetitions and self-corrections—did not significantly relate to the native listeners’ fluency ratings, nor did it distinguish between any proficiency groups in the current study (low vs. mid vs. high vs. native). In conjunction with the finding that both L2 learners and native baselines produced similar number of repairs during their picture descriptions, our findings echo previous studies evidencing the weak role of the repair phenomenon in L2 fluency (e.g., Kormos & Dénes, 2004; Prefontaine, Kormos, & Johnson, 2016). At the same time, however, the lack of any significant associations related to repair fluency also cast doubt on the construct validity of the repair measures used in the current (and other existing) studies. Although we used separate categories to capture two types of repair (i.e., repetitions and self-corrections), different types of repair could be further analyzed at a fine-grained level, such as appropriateness repair (specifying ambiguous and/or incoherent content message more precisely) and error repair (modifying erroneously activated lexical, syntactical, morphological and phonological forms at the sage of the formulation) (Kormos, 1999). Future studies are warranted to scrutinize precisely which types of repair could be uniquely tied to L1 and L2 fluency (for similar arguments, see Bosker et al., 2013).
Another issue that needs to be discussed is the lack of age effects on the final quality of L2 fluency attainment. One possible interpretation is that age effects may be relatively weak for those dimensions of L2 speech where much learning likely takes place as long as L2 learners regularly use and practice the target language for an extensive period of time. One such linguistic feature with much learning potential includes the approximation of nativelike fluency. As shown in the current study, Japanese learners with extended amounts of L2 experience (LOR > 8.8 years) seemed to attain similar results to the native speaker baseline in many dimensions of utterance fluency—e.g., the frequency of final/mid-clause pauses, repetitions and repairs; a significant difference between the high- and native-level fluency groups was observed only in articulation rate (for similar findings, see also Trofimovich & Baker, 2006). Previous literature has indicated that strong age effects can be clearly observed for acquisitionally difficult dimensions of L2 speech, such as prosodic and segmental accuracy (Flege et al., 1995; Saito, 2013, in press) and lexicogrammatical complexity (Lahmann, Steinkrauss, & Schmid, 2016). To summarize, the results here suggest that there are unique learning patterns generalizable to various dimensions of L2 speech learning (i.e., strong and extensive experience effects) (Flege, 2016 for segmentals; Trofimovich & Baker, 2006 for suprasegmentals), and specific to L2 fluency attainment (i.e., weak age effects and high-level achievement) (Lahmann et al., 2017).
the study concerns the lack of instruments evaluating the influence of L1 fluency on L2 fluency. Whereas the L1-L2 fluency link is particularly strong among inexperienced learners (Derwing et al., 2009), speakers’ L1 speech rate seems to continue to be a strong predictor of L2 speed fluency (De Jong, Groenhout, Schoonen, & Hulstijn, 2015). To disentangle L1 speaking styles from any discussion related to L2 fluency proficiency, it is necessary for future studies to adopt both L1 and L2 fluency measures.
REFERENCES
Abrahamsson, N., & Hyltenstam, K. (2008). The robustness of aptitude effects in near-native second language acquisition. Studies in Second Language Acquisition, 30(4), 481–509. http://doi.org/10.1017/S027226310808073X
Ahmadian, M. J., & Tavakoli, M. (2011). The effects of simultaneous use of careful online planning and task repetition on accuracy, complexity, and fluency in EFL learners’ oral production. Language Teaching Research, 15(1), 35–59.
http://doi.org/10.1177/1362168810383329
Baker, W. (2010). Effects of age and experience on the production of English word-final stops by Korean speakers. Bilingualism: Language and Cognition, 13(3), 263–278.
http://doi.org/10.1017/S136672890999006X
Best, C., & Tyler, M. (2007). Nonnative and second-language speech perception. In O.-S. Bohn & M. J. Munro (Eds.), Language experience in second language speech learning: In honour of James Emil Flege (pp. 13–34). Amsterdam, the Netherlands: Benjamins.
http://doi.org/10.1075/lllt.17.07bes
Birdsong, D. (2006). Age and second language acquisition and processing: A selective overview.
Language Learning, 56, 9–49. http://doi.org/10.1111/j.1467-9922.2006.00353.x Boersma, D., & Weenink, P. (2012). Praat: Doing phonetics by computer version 5.3.14.
Retrieved from http://www.praat.org
Bosker, H. R., Pinget, A.-F., Quene, H., Sanders, T., & de Jong, N. H. (2013). What makes speech sound fluent? The contributions of pauses, speed and repairs. Language Testing, 30(2), 159–175. http://doi.org/10.1177/0265532212455394
Bundgaard-Nielsen, R., Best, C., & Tyler, M. (2011). Vocabulary size is associated with second-language vowel perception performance in adult learners. Studies in Second Language Acquisition, 33, 433–461. https://doi.org/10.1017/S0272263111000040
Chambers, F. (1997). What do we mean by fluency? System, 25(4), 535–544. http://doi.org/10.1016/S0346-251X(97)00046-8
Cucchiarini, C., Strik, H., & Boves, L. (2000). Quantitative assessment of second language learners’ fluency by means of automatic speech recognition technology. The Journal of the Acoustical Society of America, 107(2), 989–999. http://doi.org/10.1121/1.428279
De Jong, N. H. (2016). Predicting pauses in L1 and L2 speech: The effects of utterance
boundaries and word frequency. International Review of Applied Linguistics in Language Teaching, 54(2), 113–132. http://doi.org/10.1515/iral-2016-9993
language behavior. Applied Psycholinguistics, 36(2), 223–243. http://doi.org/10.1017/S0142716413000210
De Jong, N. H., Steinel, M. P., Florijn, A. F., Schoonen, R., & Hulstijn, J. H. (2012). Facets of speaking proficiency. Studies in Second Language Acquisition, 34(1), 5–34.
http://doi.org/10.1017/S0272263111000489
DeKeyser, R. M. (2013). Age Effects in Second Language Learning: Stepping Stones Toward Better Understanding. Language Learning, 63, 52–67. http://doi.org/10.1111/j.1467-9922.2012.00737.x
Derwing, T. M., & Munro, M. J. (2013). The development of L2 oral language skills in two L1 groups: A 7-year study. Language Learning, 63(2), 163–185.
http://doi.org/10.1111/lang.12000
Derwing, T. M., Munro, M. J., Thomson, R. I., & Rossiter, M. J. (2009). The relationship between L1 fluency and L2 fluency development. Studies in Second Language Acquisition,
31(4), 533–557. http://doi.org/10.1017/S0272263109990015
Dewaele, J.-M., & Furnham, A. (2000). Personality and speech production: A pilot study of second language learners. Personality and Individual Differences, 28(2), 355–365. http://doi.org/10.1016/S0191-8869(99)00106-3
Flege, J.E. (2016). The role of phonetic category formation in second language speech acquisition. Eight International Conference on Second Language Speech, 10 June, 2016, Aarhus University, Denmark.
Flege, J. E., & Fletcher, K. L. (1992). Speaker and listener effects on degree of perceived foreign accent. The Journal of the Acoustical Society of America, 91(1), 370–389.
Flege, J. E., & Liu, S. (2001). The effect of experience on adults’ acquisition of a second language. Studies in Second Language Acquisition, 23(4), 527–552. http://doi.org/doi:null Flege, J. E., Bohn, O.-S., & Jang, S. (1997). Effects of experience on non-native speakers’
production and perception of English vowels. Journal of Phonetics, 25(4), 437–470. http://doi.org/10.1006/jpho.1997.0052
Flege, J. E., Munro, M. J., & MacKay, I. R. A. (1995). Factors affecting strength of perceived foreign accent in a second language. The Journal of the Acoustical Society of America,
97(5), 3125–3134. http://doi.org/10.1121/1.413041
Foster, P., Tonkyn, A., & Wigglesworth, G. (2000). Measuring spoken language: A unit for all reasons. Applied Linguistics, 21(3), 354–375. http://doi.org/10.1093/applin/21.3.354 Foster, P., & Skehan, P. (1996). The Influence of planning and task type on second language
performance. Studies in Second Language Acquisition, 18, 299–323.
Götz, S. (2013). Fluency in native and nonnative English speech. Amsterdam: John Benjamins. Granena, G., & Long, M. H. (2013). Age of onset, length of residence, language aptitude, and
ultimate L2 attainment in three linguistic domains. Second Language Research, 29(3), 311– 343. http://doi.org/10.1177/0267658312461497
Higgs, T., & Clifford, R. (1982). The push towards communication. In T. Higgs (Ed.),
Curriculum, competence, and the foreign language teacher (pp. 57–79). Skokie, IL: National Textbook Company.
Isaacs, T., & Trofimovich, P. (2012). Deconstructing comprehensibility. Studies in Second Language Acquisition, 34(3), 475–505. http://doi.org/10.1017/S0272263112000150 Jenkins, J. (2014). English as a lingua franca in the international university: The politics of
Kormos, J. (2006). Speech production and second language acquisition. Mahwah, N.J.: Lawrence Erlbaum Associates.
Kormos, J. (1999). The effect of speaker variables on the self-correction behaviour of L2 learners. System, 27(2), 207–221. http://doi.org/10.1016/S0346-251X(99)00017-2
Kormos, J., & Dénes, M. (2004). Exploring measures and perceptions of fluency in the speech of second language learners. System, 32(2), 145–164.
http://doi.org/10.1016/j.system.2004.01.001
Lahmann, C., Steinkrauss, R., & Schmid, M. S. (2016). Factors affecting grammatical and lexical complexity of long‐term L2 speakers’ oral proficiency. Language learning, 66(2), 354-385. http://doi.org/10.1111/lang.12151
Lahmann, C., Steinkrauss, R., & Schmid, M. S. (2017). Speed, breakdown, and repair: An investigation of fluency in long-term second-language speakers of English. International Journal of Bilingualism, 21(2), 228–242. http://doi.org/10.1177/1367006915613162 Lambert, C., Kormos, J., & Minn, D. (2017). Task repetition and second language speech
processing. Studies in Second Language Acquisition, 39(1), 167–196. http://doi.org/10.1017/S0272263116000085
Marsden, E., Mackey A., & Plonsky, L. (2016). The IRIS Repository: Advancing research practice and methodology. In A. Mackey & E. Marsden (Eds.), Advancing methodology and practice: The IRIS Repository of Instruments for Research into Second Languages (pp. 1-21). New York: Routledge.
Munro, M., & Mann, V. (2005). Age of immersion as a predictor of foreign accent. Applied Psycholinguistics, 26(3), 311-341. http://doi.org/10.1017/S0142716405050198
Munro, M. J., & Derwing, T. M. (2008). Segmental acquisition in adult ESL learners: A longitudinal study of vowel production. Language Learning, 58(3), 479–502. http://doi.org/10.1111/j.1467-9922.2008.00448.x
Munro, M. J., & Derwing, T. M. (2013). English L2 vowel acquisition over seven years. In J. Levis & K. LeVelle (Eds.), Proceedings of the 4th Pronunciation in Second Language Learning and Teaching Conference. Ames, IA: Iowa State University.
Norris, J. M., Plonsky, L., Ross, S. J., & Schoonen, R. (2015). Guidelines for reporting
quantitative methods and results in primary research. Language Learning, 65(2), 470–476. http://doi.org/10.1111/lang.12104
O’Brien, I., Segalowitz, N., Collentine, J., & Freed, B. (2006). Phonological memory and lexical, narrative, and grammatical skills in second language oral production by adult learners.
Applied Psycholinguistics, 27(3), 377–402. http://doi.org/10.1017/S0142716406060322 Piske, T., Mackay, I. R. A., & Flege, J. E. (2001). Factors affecting degree of foreign accent in
an L2: A review. Journal of Phonetics, 29(2), 191–215. http://doi.org/10.006/jpho.2001.0134
Prefontaine, Y., Kormos, J., & Johnson, D. E. (2016). How do utterance measures predict raters’ perceptions of fluency in French as a second language? Language Testing, 33(1), 53–73. http://doi.org/10.1177/0265532215579530
Révész, A., Michel, M., & Gilabert, R. (2016). Measuring cognitive task demands using dual-task methodology, subjective self-ratings, and expert judgements: A validation study.
Studies in Second Language Acquisition, 38(4), 703–737. http://doi.org/10.1017/S0272263115000339
Rossiter, M. J. (2009). Perceptions of L2 fluency by native and non-native speakers of English.
Saito, K. (2013). Age effects on late bilingualism: The production development of /r/ by high-proficiency Japanese learners of English. Journal of Memory and Language, 69, 546-562. https://doi.org/10.1016/j.jml.2013.07.003
Saito, K. (2015). Experience effects on the development of late second language learners' oral proficiency. Language Learning, 65, 563-595. http://doi.org/10.1111/lang.12120
Saito, K. (2017). “Beginner, intermediate and advanced Japanese learners of English in Japan Canada, the US and the UK.” Unpublished corpus of second language speech. Retrieved from http://kazuyasaito.net/ October 2017
Saito, K. (in press). Advanced segmental and suprasegmental acquisition. In P. Malovrh & A. Benati (Eds.). The handbook of advanced proficiency in second language acquisition. Oxford: Blackwell Publishers.
Saito, K., & Brajot, F. (2013). Scrutinizing the role of length of residence and age of acquisition in the interlanguage pronunciation development of English /r/ by late Japanese bilinguals.
Bilingualism: Language and Cognition, 16, 847-863. https://doi.org/10.1017/S1366728912000703
Saito, K., Dewaele, J.-M., & Hanzawa, K. (2017). A longitudinal investigation of the
relationship between motivation and late second language speech learning in classroom settings. Language and Speech. Advanced online publication.
https://doi.org/10.1177/0023830916687793
Saito, K., & Munro, M. (2014). The early phase of /r/ production development in adult Japanese learners of English. Language and Speech, 57, 451-469.
https://doi.org/10.1177/0023830913513206
Segalowitz, N. (2016). Second language fluency and its underlying cognitive and social determinants. International Review of Applied Linguistics in Language Teaching, 54(2), 79–95. http://doi.org/10.1515/iral-2016-9991
Skehan, P. (2003). Task-based instruction. Language teaching, 36(1), 1-14. https://doi.org/10.1017/S026144480200188X
Skehan, P. (2014). Processing perspectives on task performance. Amsterdam: John Benjamins. Spada, N., & Tomita, Y. (2010). Interactions between type of instruction and type of language
feature: A meta-analysis. Language Learning, 60(2), 263–308. http://doi.org/10.1111/j.1467-9922
Tavakoli, P., & Skehan, P. (2005). Strategic planning, task structure and performance testing. In R. Ellis (Ed.), Planning and task performance in a second language (pp. 239- 77).
Amsterdam: Benjamins.
Trofimovich, P., & Baker, W. (2006). Learning second language suprasegmentals: Effect of L2 experience on prosody and fluency characteristics of L2 speech. Studies in Second
Language Acquisition,