Citation:
Bagnall, A and Raine, G and Trigwell, J and Giuntoli, G (2014) Validation of the ‘Life Essentials Assessment Framework’ questionnaire: Phase 2. Project Report. Leeds Beckett University.
Link to Leeds Beckett Repository record:
http://eprints.leedsbeckett.ac.uk/2674/
Document Version: Monograph
The aim of the Leeds Beckett Repository is to provide open access to our research, as required by funder policies and permitted by publishers and copyright law.
The Leeds Beckett repository holds a wide range of publications, each of which has been checked for copyright and the relevant embargo period has been applied by the Research Services team.
We operate on a standard take-down policy. If you are the author or publisher of an output and you would like it removed from the repository, please contact us and we will investigate on a case-by-case basis.
1
Validation of the ‘Life Essentials Assessment
Framework’ questionnaire: Phase 2
Findings
Anne-Marie Bagnall
Gary Raine
Jo Trigwell
Gianfranco Giuntoli.
June 2014
The Centre for Health Promotion Research Institute for Health and Wellbeing
Leeds Metropolitan University 80 Woodhouse Lane
Leeds LS8 2NU
2
Contents
Acknowledgements ... 3
Executive Summary ... 4
Background ... 7
Objectives ... 8
Methods ... 8
Findings ... 9
Factorial validity ... 9
Concurrent validity ... 12
Responsiveness ... 13
Discussion... 14
Conclusions ... 17
References ... 18
Appendix 1: LEAF ... 19
3
Acknowledgements
4
Executive Summary
Introduction
This report presents findings from the second validation phase of the “Life Essentials Assessment Framework” (LEAF) questionnaire. LEAF is an eight question interviewer-administered questionnaire devised by AgeUK Wakefield District to enable effective evaluation of vulnerable adults’ needs and to help establish the effectiveness of service provision. During the LEAF assessment, service users rate themselves on a scale of one to ten in relation to eight statements about their feelings, functionings and capabilities. The statements cover:
Managing daily living
Managing finances
Managing physical health to still make the most of life
Having one’s say in decisions - control and choice
Feeling safe
Social networks and social life
Feeling valued by others
Happiness - emotional wellbeing
The practitioner uses the assessment results to plan and allocate the support available locally that can meet the service user's needs. Revisiting the LEAF questions at six and twelve weeks enables the practitioner to check whether the prescribed support is improving the service user’s well-being scores. The practitioner can make necessary adjustments to intervention components received and typically will close the referral after the third contact.
In 2012, the Centre for Health Promotion Research, Institute for Health and Wellbeing at Leeds Metropolitan University was commissioned by AgeUK Wakefield District to assess the measurement characteristics of LEAF, adopting a phased approach. See Giuntoli et al. (2013) for findings from phase one.
Given the results of the first validation study, the aims of the second phase were to:
Assist AgeUK Wakefield in the re-writing of the six questions of the LEAF questionnaire.
Complete the evaluation of the LEAF questionnaire through undertaking the tests recommended in the first phase (exploring concurrent and construct validity).
In order to pursue these two aims, the objectives of the validation were to:
Provide examples of relevant validated questionnaire items to AgeUK Wakefield to help with the amendment of the six questions of the LEAF questionnaire.
Test for factorial validity, by undertaking a factor analysis of the re-written items of the LEAF questionnaire.
Test for concurrent validity, by comparing the LEAF questionnaires to other, already validated questionnaires and scales that aim to measure similar constructs.
5 To meet the objectives for the second phase of validation, the following processes were undertaken:
Objective 1: a short document with a number of relevant examples of validated items from UK and international surveys was produced. This document was delivered to AgeUK Wakefield.
Objective 2: principal component analysis was undertaken using the revised LEAF questionnaire.
Objective 3: a validated questionnaire that assesses the life domains measured by the LEAF questionnaire was identified and discussed with AgeUK Wakefield in terms of its
appropriateness for use with the clients under study. This questionnaire was administered to the clients in one meeting in which the LEAF questionnaire was also administered (at
baseline, 6 week or 12 week data collection time points). The findings of the validated questionnaire were then compared with corresponding findings from the LEAF questionnaire completed at matched time points.
As part of these analyses, the responsiveness of the ‘Leaf’ questionnaire was also evaluated, that is its ability to measure meaningful changes (from baseline to 6 week or 12 week time points).
Findings
Overall the analyses showed that:
The factorial validity analysis demonstrated that, although a two factor solution was posited (Factor 1: Control & choice, Daily living, Physical health, Finance, Safety & Factor 2: Social networks, Contribution, Emotional wellbeing), the correlation between the two factors suggests that they are not two separate and unrelated constructs, but could be viewed as sub-dimensions of an overall “Life Essentials” construct. Factor 1 seems to collectively refer to the concept on “independence” while Factor 2 refers to the concept of “mental
wellbeing”. The mental well-being concept was also present in the first phase of the validation, but the independence item was not. As in the first phase of the validation
(Giuntoli et al., 2013), the coherence of the LEAF questionnaire as a scale could be improved by removing the Finance item, but the potential statistical improvement is minimal,
compared against what would probably be lost in practical terms by removing that item.
The concurrent validity analysis (n=128) showed a medium positive correlation between LEAF and the validated scale (CASP-19). No significant difference was also observed when comparing converted summed LEAF (converted to the CASP-19 scale to create a common measure) and CASP-19 scales. Since both scales measure similar constructs, and taking the results of both tests together, the construct validity of the LEAF questionnaire can be confirmed.
Follow-up data revealed that the LEAF questionnaire is responsive to change, with data showing (n=46-53) significantly higher improved scores across all eight life domains on completion of the relevant intervention.
6 Data suggest an overall LEAF scale could be generated by adding the scores from all eight items together. However, given that the strength of LEAF is to identify which areas a client needs help with and to then assess whether scores in these areas have improved post-intervention, it may be most useful to keep LEAF scores separate for the eight domains.
Comparison of LEAF with the validated scale CASP-19 confirmed the construct validity of the LEAF questionnaire, while follow-up data from 46 to 53 clients revealed that the LEAF questionnaire is responsive to change.
There may be some scope for treating the two factors (independence and mental wellbeing) as two distinct life dimensions and to create a four-fold typology of low versus high independence against low vs high mental wellbeing. This may be helpful to AgeUK to identify which patterns to prioritise in their interventions.
Test-retest reliability could be confirmed by giving the LEAF questionnaire to the same group of clients twice at baseline, a few days apart, and before any intervention is given.
7
Background
This document presents findings from the second validation phase of the “Life Essentials Assessment Framework” (LEAF) questionnaire, an eight question interviewer-administered questionnaire
devised by AgeUK Wakefield District to enable effective evaluation of vulnerable adults’ needs and to help establish the effectiveness of service provision. LEAF was designed particularly with older people in mind. It comes as a pack of guidance and tools for assessors and service users. It should only be used by staff who are fully trained to perform all of the various processes. During the LEAF assessment, service users rate themselves on a scale of one to ten in relation to eight statements about their feelings, functionings and capabilities. The statements cover:
Managing daily living
Managing finances
Managing physical health to still make the most of life
Having one’s say in decisions - control and choice
Feeling safe
Social networks and social life
Feeling valued by others
Happiness - emotional wellbeing
The practitioner uses the assessment results to plan and allocate the support available locally that can meet the service user's needs. Revisiting the LEAF questions at six and twelve weeks enables the practitioner to check whether the prescribed support is improving the service user’s well-being scores. The practitioner can make any adjustments that are necessary and typically will close the referral after the third contact.
The main aim of the validation of LEAF is to establish whether the information that we collect through LEAF is valid and reliable, which means that we can trust that this information – e.g. the information collected through the individual items of LEAF – is likely to represent people’s states on those aspects of their lives and it is not an artefact of a badly designed questionnaire.
The first phase of the validation of the LEAF questionnaire aimed to undertake relevant validation analyses of this measurement tool using the answers collected from 99 older people interviewed at two points in time: before and after the delivery of specific AgeUK services. Overall, this first phase of validation proved the potential of the LEAF questionnaire. In particular, the first phase of the validation showed that the LEAF questionnaire recorded improvements in the clients’ conditions across its six domains which were statistically significant and had, on average, a large effect size. These results suggested that the improvements in the clients’ conditions were substantial and were not due to chance, however, they could not establish any causal relationships with the AgeUK intervention because this was undertaken without a control group. However, although a control group is needed to establish causal relationships between specific interventions and observed changes in AgeUK clients, it is not strictly needed for the validation of the LEAF questionnaire.
8
To reword the six items of the questionnaire in such a way to remove all sources of ambiguity (and add additional items).
To undertake further tests of the reliability (e.g. measures of stability) and validity of the ‘LEAF’ questionnaire. For example:
o Concurrent validity.
o Construct validity.
o Test-retest reliability.
To adopt a simpler way to record the data collected through the questionnaire.
We also suggested testing responsiveness of the LEAF questionnaire, that is its capacity to measure meaningful changes (Revicki et al., 2008), using a longitudinal research design.
Objectives
Given the results of the first phase of the validation, the aims of the second phase were to:
Assist AgeUK Wakefield in the re-writing of the six questions of the LEAF questionnaire.
Complete the validation of the LEAF questionnaire through undertaking the tests recommended in the first phase.
In order to pursue these two aims, the objectives of the validation were to:
Provide examples of relevant validated questionnaire items to AgeUK Wakefield to help with the amendment of the six questions of the LEAF questionnaire.
Test for factorial validity, by undertaking a principal component analysis of the re-written items of the LEAF questionnaire.
Test for concurrent validity, by comparing the LEAF questionnaires to other, already validated questionnaires and scales that aim to measure similar constructs.
Methods
The first objective was achieved by producing a short document with a number of relevant examples of validated items from UK and international surveys. This document was delivered to AgeUK Wakefield.
The second objective was pursued using principal component analysis, as in the first phase of the validation.
The third objective was pursued as follows:
A validated questionnaire that assesses the life domains measured by the LEAF questionnaire was identified and discussed with AgeUK Wakefield in terms of their appropriateness with the clients under study.
9
The findings of the validated questionnaire were then compared with the corresponding findings from the LEAF questionnaire completed at matched time points.
As part of these analyses, the responsiveness of the ‘Leaf’ questionnaire was also evaluated, that is its ability to measure meaningful changes (from baseline to post-intervention (6 or 12 week time points)) (Revicki et al., 2008). Responsiveness can be evaluated using repeated administrations of the questionnaire.
Findings
Factorial validity
Principal Component Analysis
Principal Component analysis (PCA) was conducted on the 8 items of LEAF (n=139) using a Varimax rotation. Initially all factors with Eigenvalues greater than 1 were retained for rotation. Factor loadings of 0.3 and above were considered to be substantive values.
The value of the Kaiser Meyer Olkin (KMO) test of sampling adequacy was .691. A value greater than .5 is required for the sample to be adequate. The closer a value is to 1 the more reliable the analysis. (The KMO values for all individual items were also greater than .5). Additional tests did not detect any issues with multicollinearity (variables having a very high degree of correlation), or the presence of an identity matrix (variables correlating very badly with each other). Thus, it was appropriate to proceed with the analysis.
Table 1 shows that the analysis produced a 3 factor solution which accounted jointly for 66.8% of the total variance (Factor 1 accounted for 37.5% of the variance, Factor 2 accounted for 15.5% & Factor 3 accounted for 13.8%).
Factor 1 loaded most strongly on 4 items: Physical health (.830); Daily living (.783); Control & Choice (.633); Safety (.494) (Control & Choice also loaded less strongly on Factor 3 and Safety also loaded less strongly on Factors 2 & 3).
Factor 2 loaded most strongly on 3 items: Social networks (.893); Emotional wellbeing (.612); Contribution (.596) (Emotional wellbeing also loaded less strongly on Factor 3 and Contribution also loaded less strongly on Factor 1).
Factor 3 loaded most strongly on 1 item: Finance (.886)
10 Table 1: Rotated Component Matrix (PCA 1)
Analysis further revealed there to be 21 (75%) non redundant residuals with absolute values greater than 0.05. These residuals provide an indication of how well the solution fits the data, and ideally the value should be less than 50%. (Field, 2009).
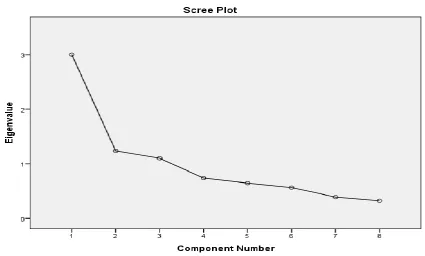
[image:11.595.78.504.387.643.2]The scree plot generated by the analysis is shown in Figure 1. It suggests that selecting factors based on eigenvalues over 1 might not be the most appropriate. The slope of the line begins to tail off after 2 factors, suggesting that this might be a more accurate number to retain.
Figure 1: Scree Plot (PCA 1)
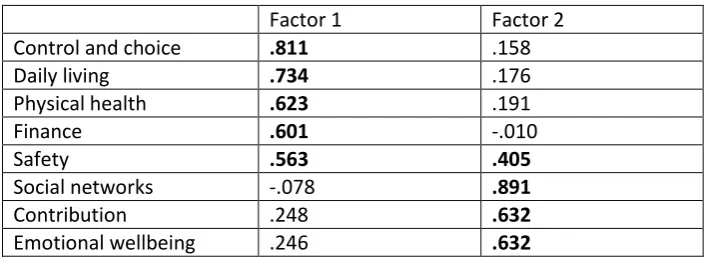
The analysis (PSA 2) was re-run with 2 factors retained and the results are shown in Table 2. In total, the 2 factors accounted for 53% of the total variance (Factor 1 = 37.5% & Factor 2= 15.5%).
Factor 1 loaded most strongly on 5 items: Control & choice (.811); Daily living (.734); Physical health (.623); Finance (.601) & Safety (.563) (Safety also loaded less strongly on Factor 2).
Factor 1 Factor 2 Factor 3
Physical health .830
Daily living .783
Control and choice .633 .533
Safety .494 .341 .348
Social networks .893
Emotional wellbeing .612 .568
Contribution .393 .596
11 Factor 2 loaded most strongly on 3 items: Social networks (.891); Contribution (.632) & Emotional wellbeing (.632).
Table 2: Rotated Component Matrix (PCA 2)
In total, there were 20 (71%) non redundant residuals with absolute values greater than 0.05.
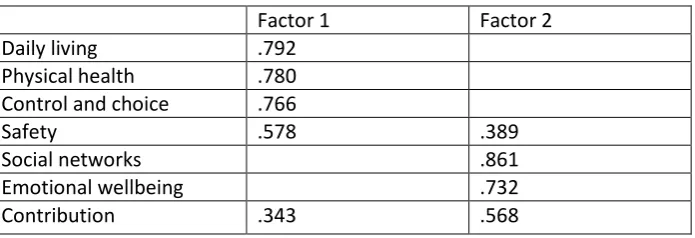
As the results of the first PCA suggested that the item Finance loaded on a separate third factor, a further analysis (PSA 3) was conducted using all items except Finance (KMO=.744) to see what impact this would have on the factor structure. This analysis generated a 2 factor solution, which accounted for 58.6% of the total variance (F1 = 41.6% & F2 = 17%).
Table 3: Rotated Component Matrix (PCA 3)
Once again there was a high proportion (15, 71%) of non-redundant residuals with absolute values greater than 0.05.
Factor 1 loaded most strongly on 5 items: Daily living (.792); Physical Health (.780) Control & choice (.766) & Safety (.578) (Safety also loaded less strongly on Factor 2).
Factor 2 loaded most strongly on 3 items: Social networks (.861) Emotional wellbeing (.732) & Contribution (.568) (Contribution also loaded less strongly on Factor 1).
As can be seen from Tables 1-3, some items had sizeable loadings on more than one factor, which suggests there might be interrelationship between variables. In such circumstances an Oblique rotation is suggested and therefore all analyses were repeated using a Direct Oblimin rotation. This produced solutions with identical patterns of loadings in all 3 cases, except that in the first PCA
Factor 1 Factor 2
Control and choice .811
Daily living .734
Physical health .623
Finance .601
Safety .563 .405
Social networks .891
Contribution .632
Emotional wellbeing .632
Factor 1 Factor 2
Daily living .792
Physical health .780 Control and choice .766
Safety .578 .389
Social networks .861
Emotional wellbeing .732
[image:12.595.77.425.419.538.2]12 (Table 1) Safety no longer loaded on Factors 2 & 3 above .30, and in PCA 3 (Table 3), Safety did not load on Factor 2 above .30 and Contribution did not load above .30 on Factor 1.
In PCA 2 and 3, the component correlation matrix produced by the direct oblimin rotation indicated substantive interrelationship between latent dimensions (.329 and .358 respectively).
Interrelationship between factors suggests that the latent dimensions are not 2 totally separate unrelated constructs.
Weaker interrelationship between factors was suggested in PCA 1. The largest correlation existed between Factor 1 and Factor 2 (.260), followed by Factor 1 and 3 (.214) and Factor 2 and Factor 3 (.155).
Cronbach’s Alpha tests
Cronbach’s Reliability Coefficient Alpha test was conducted to assess the internal consistency of the items comprising the LEAF questionnaire using data collected at baseline. The Alpha value generated by all 8 questions together was .749, which is satisfactory. A value equal to or greater than 0.7 is generally considered acceptable in the literature (Field, 2009).
However, the analysis also provided an indication of the Alpha value that would result if individual items were excluded from the calculation (Alpha if item deleted). Finance had an Alpha if item deleted value equal to the overall Alpha score (.749) suggesting that it wasn’t contributing to reliability. When Finance was removed and the analysis re-run the overall Alpha score increased slightly to .760.
When constructing a scale it is recommended (see for example, Field 2009) that Alpha scores also be generated separately for each latent dimension identified by PCA. A further Cronbach’s Alpha test was subsequently conducted on each of the 2 factors generated by PCA 2.
Factor 1 (Control, Daily Living, Physical Health, Finance, Safety) had a combined Alpha score of .733. However, the analysis suggested a higher value could be achieved by removing Finance. The removal of Finance from the test increased the Alpha value to .763.
The Alpha score for Factor 2 (Social networks, contribution, emotional well-being) was slightly lower at .620. Cronbach’s Alpha test is influenced by the number of items included in the analysis and therefore the lower reliability could be due to the fact that this dimension comprises just 3 items.
Concurrent validity
In order to test the concurrent validity of LEAF, respondents were also asked to complete the validated CASP-19 questionnaire at a time point LEAF was also administered. CASP-19 is a
13 quality of life (Wiggins et al., 2008). CASP-19 was therefore considered appropriate to test the concurrent validity of LEAF, covering all domains included in LEAF and developed for a population similar in age.
To explore the strength of the association between the two questionnaires, LEAF responses were summed across all domains, thus creating a scale, and compared to the CASP-19 scale using Pearson’s correlation. Results revealed a medium, positive correlation1 between the two scales (r=0.42, n=128, p<0.001), with high scores on LEAF associated with high scores on CASP-19 (and similarly, low scores on LEAF were associated with low scores on CASP-19). As an additional measure of concurrent validity, the summed LEAF responses were converted to the CASP-19 scale to create a common scale. Differences between the converted LEAF and CASP-19 scales were explored using a paired samples T-Test. Data showed no significance difference (p>0.05) between the converted summed LEAF (M=30.34, sd=8.14) and CASP-19 scales ((M=30.66, sd=7.96), t (127)=-4.15). Since both scales measure similar constructs, and taking the results of both tests together, the construct validity of the LEAF questionnaire can be confirmed.
Responsiveness
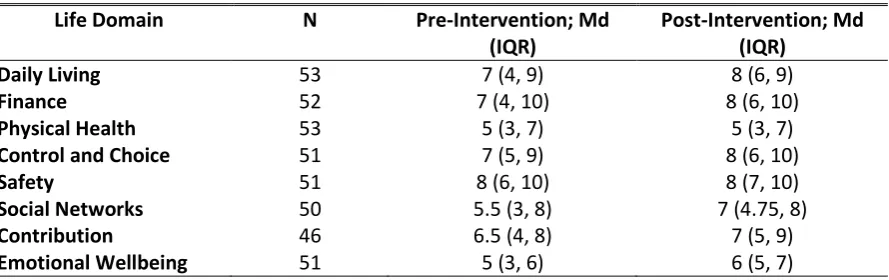
[image:14.595.79.524.448.588.2]Descriptive statistics were generated for all individual variables in the study and data was checked for normality. As data was non-parametric, Wilcoxon Signed Rank Tests were used to determine differences in scores pre- to post-intervention (six or 12 weeks from baseline). Descriptive statistics for each life domain pre- and post-intervention are displayed in Table 4.
Table 4. Descriptive statistics for eight life domains pre- and post-intervention
Life Domain N Pre-Intervention; Md
(IQR)
Post-Intervention; Md (IQR)
Daily Living 53 7 (4, 9) 8 (6, 9)
Finance 52 7 (4, 10) 8 (6, 10)
Physical Health 53 5 (3, 7) 5 (3, 7)
Control and Choice 51 7 (5, 9) 8 (6, 10)
Safety 51 8 (6, 10) 8 (7, 10)
Social Networks 50 5.5 (3, 8) 7 (4.75, 8)
Contribution 46 6.5 (4, 8) 7 (5, 9)
Emotional Wellbeing 51 5 (3, 6) 6 (5, 7)
Md=Median, IQR=Inter-Quartile Range
Table 5 highlights that clients reported significantly higher improved scores across all eight life domains on completion of the relevant intervention. Effect size from pre- to post-intervention varied across domains; data revealed a high effect on emotional well-being and moderate/ moderate to
1 Small correlation r=0.10 to 0.29; Medium correlation r=0.30 to 0.49; Large correlation r=0.50 to 1.0 (Cohen J
W (1988) Statistical power analysis for the behavioural sciences (2nd ed). Hillsdale, NJ: Lawrence Erlbaum
14 high effect on safety, daily living, contribution, social networks and control and choice (based on Cohen, 1988, classification of effect size).
Table 5. Wilcoxon Signed Ranks Tests
Life Domain Z Significance value Effect size (r value)
Daily Living -3.652 <0.001 0.355
Finance -3.753 <0.001 0.368
Physical Health -2.366 0.018 0.230
Control and Choice -4.550 <0.001 0.451
Safety -3.063 0.002 0.303
Social Networks -4.216 <0.001 0.422
Contribution -3.620 <0.001 0.377
Emotional Wellbeing -5.057 <0.001 0.501
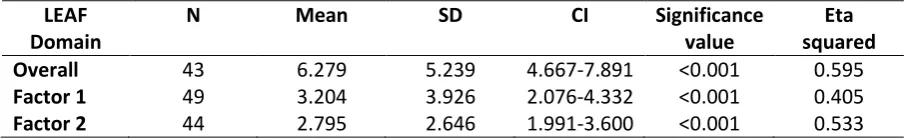
In addition to analysis of individual questions, responsiveness of scales (Total, Factor 1 and Factor 2 scores) was tested. Paired-samples t-tests were conducted to explore changes in combined scores pre- to post-intervention (see Table 6).
Scores from all eight items were combined to create a total score. The total mean score at pre-intervention was 48.496 (SD=11.360); scores ranged from 17 to 76 (maximum possible score = 80). At post-intervention, the mean score was 55.843 (SD=11.807), with scores ranging from 22 to 78. The mean change in total scores from pre- to post-intervention was 6.279 (SD= 5.239), representing a significant positive increase (t (42)=7.860, p<0.001). Overall, total scores increased among 86% (n=37) of the sample; 7% (n=3) of scores remained constant.
Scores from five items were combined to create a scale for Factor 1. Pre-intervention, the mean score for Factor 1 was 32.480 (SD=8.198); scores ranged from 12 to 50 (maximum possible score = 50). At post-intervention, the mean score was 36.164 (SD=7.981), with scores ranging from 18 to 50. The mean change in Factor 1 scores from pre- to post-intervention was 3.204 (SD= 3.926),
representing a significant positive increase (t (48)=5.712, p<0.001). Overall, Factor 1 scores increased among 67.3% (n=33) of the sample, with 26.5% (n=13) of scores staying the same.
Scores from the remaining three items were combined to create a scale for Factor 2.
Pre-intervention, the mean score for Factor 2 was 16.407 (SD=5.453), with scores ranging from 3 to 29 (maximum possible score = 30). At post-intervention, the mean score for Factor 2 was 19.373 (SD=5.325); scores ranged from 4 to 30. The mean change in Factor 2 scores from pre- to post-intervention was 2.795 (SD=2.646), representing a significant positive increase (t (43)=7.007, p<0.001). Overall, scores for Factor 2 increased among 75% (n=33) of the sample; 25% (n=11) of scores remained constant.
Table 6. Paired-Samples T-Tests LEAF
Domain
N Mean SD CI Significance
value
Eta squared
Overall 43 6.279 5.239 4.667-7.891 <0.001 0.595
Factor 1 49 3.204 3.926 2.076-4.332 <0.001 0.405
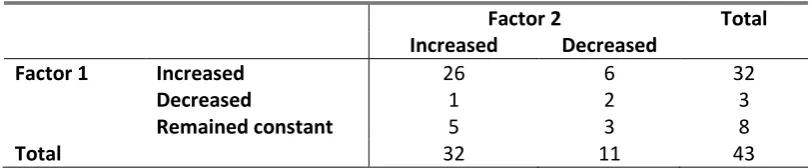
[image:15.595.71.525.695.765.2]15 Table 7. Cross-tabulation of changes in Factors (pre- to post-intervention)
Factor 2 Total
Increased Decreased
Factor 1 Increased 26 6 32
Decreased 1 2 3
Remained constant 5 3 8
Total 32 11 43
A cross-tabulation was conducted to explore changes across both factors (see Table 7). Overall, scores improved pre- to post-intervention on both factors for 26 clients. A further, 12 client scores increased for one factor only (increased/ decreased, n=7; increased/ remained constant, n=5).
Discussion
Key findings
The factorial validity analysis demonstrated that the LEAF tool can be considered to be a reasonably coherent scale. Although a two factor solution was posited (Factor 1: Control & choice, Daily living, Physical health, Finance, Safety & Factor 2: Social networks, Contribution, Emotional wellbeing), the correlation between the two factors suggests that they are not two separate and unrelated
constructs, but could be viewed as sub-dimensions of an overall “Life Essentials” construct. Factor 1 seems to collectively refer to the concept on “independence” while Factor 2 refers to the concept of “mental wellbeing”. The mental well-being concept was also present in the first phase of the
validation, but the independence item was not. As in the first phase of the validation (Giuntoli 2013) the coherence of the LEAF tool as a scale could be improved by removing the Finance item, but the potential statistical improvement is minimal, compared against what would probably be lost in practical terms by removing that item.
The concurrent validity analysis showed a medium positive correlation between LEAF and the validated scale (CASP-19). Since both scales measure similar constructs, these results confirm the construct validity of the LEAF questionnaire.
Follow-up data from 46 to 53 clients revealed that the LEAF questionnaire is responsive to change, with clients reporting significantly higher improved scores across all eight life domains on
completion of the relevant intervention.
What next?
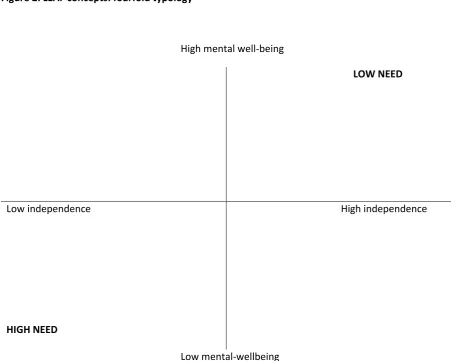
16 two factors (independence and mental wellbeing) as two distinct life dimensions and to create a four-fold typology of low versus high independence against low vs high mental wellbeing. This may be helpful to AgeUK to identify which patterns to prioritise in their interventions, e.g. low mental well-being and low independence would indicate the highest need and high independence and high mental-wellbeing would indicate the lowest need (Figure 2).
Figure 2: LEAF concepts: fourfold typology
High mental well-being
LOW NEED
Low independence
HIGH NEED
High independence
Low mental-wellbeing
Test-retest reliability could be confirmed by giving the LEAF questionnaire to the same group of clients twice: at baseline, and then after a few days, but before any intervention is given. Face validity was not formally assessed for this 8-item version of the LEAF tool; however it was assessed in Phase I of the validation when the LEAF tool was a 6-item questionnaire. The tool was expanded to 8 items, and the wording of some questions and display of response options was changed in response to the results of this assessment (Giuntoli et al. 2013).
17 group would be the most ethical solution, although some clients would not be able to wait six weeks for an intervention, so this would only work for certain types of intervention.
Conclusions
Data from 139 clients suggest an overall LEAF scale could be generated by adding the scores from all eight items together. The analysis also suggested that the LEAF may comprise of two related
concepts of “independence” and “mental wellbeing”. However, given that the strength of LEAF is to identify which areas a client needs help with and to then assess whether scores in these areas have improved post-intervention, and acknowledging the holistic “whole-client” nature of the range of interventions provided by AgeUK, which LEAF is designed to reflect, it may be most useful to keep LEAF scores separate for the eight domains.
The concurrent validity analysis (128 clients) showed a medium positive correlation between LEAF and the validated scale (CASP-19). Since both scales measure similar constructs, these results confirm the construct validity of the LEAF questionnaire.
Follow-up data from 46 to 53 clients revealed that the LEAF questionnaire is responsive to change, with clients reporting significantly higher improved scores across all eight life domains on
completion of the relevant intervention.
18
References
Field, A.P. (2009) Discovering statistics using IBM SPSS: (and sex drugs and rock ‘n’ roll) (3rd Edition). London: SAGE.
Giuntoli, G., Raine, G. and Bagnall, A.-M. (2013) Validation of the 'Life Essentials Assessment Framework' (LEAF) questionnaire. Findings, Leeds: Institute for Health and Wellbeing, Leeds Metropolitan University.
Hyde, M., Wiggins, R.D., Higgs, P. and Blane, D.B. (2003) A measure of quality of life in early old age: the theory development and properties of a needs satisfaction model (CASP-19), Aging and Mental Health, 7, 3, 186-194.
Revicki, D., Hays, R.D., Cella, D. and Sloan, J. (2008) Recommended methods for determining responsiveness and minimally important differences for patient-reported outcomes, Journal of Clinical Epidemiology, 61, 2, 102-109.
Wiggins, R.D., Netuveli, G., Hyde, M., Higgs, P. and Blane, D. (2008) The Evaluation of a
19
24
Appendix 2: CASP-19
CASP 19 questionnaire
Service User ID
___________________________________
Instructions
This booklet contains the CASP-19 questionnaire
(Control, Autonomy, Self-realisation, Pleasure),
which has to be asked to clients after having
administered the LEAF questionnaire.
Please ask all the questions in the order in which
they come in this booklet.
Data inputting
Please record the number next to the ticked box
in the Excel spread sheet.
25
Please read the words below to each client and
show them the booklet to help them choose
their answer from the list underneath each
question:
“I am going to read to you a number of
statements that describe how people sometimes
feel. Please indicate how often you feel the way
described by each statement using the four
options provided: ‘Often’, ‘Not Often’,
‘Sometimes’, ‘Never’.
Control
Q1
My age prevents me from doing the things I
would like to (please tick one)
Often
...
0Not Often
...
1Sometimes
...
2Never
...
3Q2
I feel that what happens to me is out of my
control (please tick one)
Often
...
0Not Often
...
1Sometimes
...
226
Q3
I feel free to plan for the future (please tick
one)
Often ...
3Not Often...
2Sometimes ...
1Never ...
0Q4
I feel left out of things (please tick one)
Often ...
0Not Often...
1Sometimes ...
2Never ...
3Q5
I can do the things that I want to do (please
tick one)
Often ...
3Not Often...
2Sometimes ...
1Never ...
0Q6
Family responsibilities prevent me from doing
what I want to do (please tick one)
Often ...
0Not Often...
1Sometimes ...
2Never ...
3Autonomy
Q7
I feel that I can please myself what I can do
(please tick one)
Often ...
3Not Often...
2Sometimes ...
1Never ...
027
Not Often...
1Sometimes ...
2Never ...
3Q9
Shortage of money stops me from doing the
things that I want to do (please tick one)
Often ...
0Not Often...
1Sometimes ...
228
Q10
I look forward to each day (please tick one)
Often ...
3Not Often...
2Sometimes ...
1Never ...
0Q11
I feel that my life has meaning (please tick one)
Often ...
3Not Often...
2Sometimes ...
129
Pleasure
Q12
I enjoy the things that I do (please tick one)
Often ...
3Not Often...
2Sometimes ...
1Never ...
0Q13
I enjoy being in the company of others (please
tick one)
Often ...
3Not Often...
2Sometimes ...
1Never ...
0Q14
On balance, I look back on my life with a sense
of happiness (please tick one)
Often ...
3Not Often...
2Sometimes ...
1Never ...
0Q15
I feel full of energy these days (please tick one)
Often ...
3Not Often...
2Sometimes ...
130
Self-realisation
Q16
I choose to do things that I have never done
before (please tick one)
Often ...
3Not Often...
2Sometimes ...
1Never ...
0Q17
I feel satisfied with the way my life has turned
out (please tick one)
Often ...
3Not Often...
2Sometimes ...
1Never ...
0Q18
I feel that life is full of opportunities (please
tick one)
Often ...
3Not Often...
2Sometimes ...
1Never ...
0Q19
I feel that the future looks good for me (please
tick one)
Often ...
3Not Often...
2Sometimes ...
1Never ...
031
[image:32.595.36.507.118.247.2]Appendix 3: Full rotated component matrix tables
[image:32.595.35.393.312.442.2]Table 1: Rotated Component Matrix (PCA 1)
Table 2: Rotated Component Matrix (PCA 2)
Table 3: Rotated Component Matrix (PCA 3)
Factor 1 Factor 2 Factor 3
Physical health .830 .108 -.078
Daily living .783 .087 .182
Control and choice .633 .069 .533
Safety .494 .341 .348
Social networks .049 .893 -.033
Emotional wellbeing -.008 .612 .568
Contribution .393 .596 -.014
Finance .115 -.061 .886
Factor 1 Factor 2
Control and choice .811 .158
Daily living .734 .176
Physical health .623 .191
Finance .601 -.010
Safety .563 .405
Social networks -.078 .891
Contribution .248 .632
Emotional wellbeing .246 .632
Factor 1 Factor 2
Daily living .792 .112
Physical health .780 .068
Control and choice .766 .182
Safety .578 .389
Social networks .010 .861
Emotional wellbeing .158 .732
[image:32.595.41.388.508.625.2]