IMPACT OF NON-PERFORMING ASSETS (NPA) ON WORKING OF
PUBLIC SECTOR BANKS’: A BANK-WISE CASE STUDY
Avani Ojha1, Hem Chandra Jha2
1
Corresponding Author & Ph.D. Research Scholar, University Department of Commerce & Business Administration, Lalit Narayan Mithila University, Darbhanga-846004, Bihar,
2
Associate Professor, Department of Commerce, Ganesh Dutt College, Begusarai-851101, Bihar, INDIA
ABSTRACT
To determine impact of NPA on working of public sector banks’ (PSBs), a research project
was undertaken during FY 2016-17 and thereafter it was concluded that all public sector banks’ had witnessed unprecedented growth in substandard, doubtful and loss assets. Gross
advances were reduced and such downsized the credit-deposit ratio of the PSBs. Repayments
of advances were poor and this had bad impact on net interest income and net interest
margin (%) of PSBs. Moreover, the gross and net NPAs (in volume and percentage) of PSBs
were increased and to combat this problem, banks’ had to make more provisions for NPA
which increased total expenses of PSBs. Accordingly, Yield average on advances (%) and
average return on assets (%) had declined those resulted in very poor per employee profit as
₹-0.51 lacs. Ultimately, in comparison to net loss worth ₹ -16133 crores during last year
2015-16, PSBs earned a net profit worth ₹ 3435 crores this year 2016-17. However, keeping
in view the huge total business had by these 21 PSBs during 2016-17 worth ₹ 1,29,59,113
crores, such a low net profit is never acceptable. Therefore, certainly this reflects the impact
of NPA on working and profitability of PSBs.
Keywords: Impact, NPA, performance indicators, public sector banks’, working
International Research Journal of Management and Commerce ISSN: (2348-9766) Impact Factor- 5.564, Volume 4, Issue 9, September 2017
Website- www.aarf.asia, Email : editor@aarf.asia , editoraarf@gmail.com
Introduction
Non-Performing Assets
In the general term, an asset is classified as Non-performing Assets (NPA), if interest or installment payment of principal remain due and unpaid for more than 180 days. However, since March 2004, default status had to be given to a borrower, if dues are not paid for 90 days. If any advance or credit facility granted by a bank to a borrower becomes non-performing then the bank will have to treat all the advances and credit facilities granted to that borrower as non-performing regardless existence of some performing advances or credit facilities. As per guidelines of the RBI (1992), banks’ in
India must adopt the international banking norms on Income Recognition, Asset Classification, Provisioning and Capital Adequacy (Basu, 2005).
Public Sector Banks’ in India
In term of businesses, the public sector banks’ now have a dominant position. They
amounted for 70.5% of assets, 73.9% of deposits, 72.7% of advances and 69.9% of investments of all scheduled commercial banks’ as on 31st
March 2017. The 21 nationalized banks’ had 85018 offices all over the country. In recent years, in order to meet credit needs of weaker sections, artisans, small and marginal farmers’ etc., regional rural banks’ were set-up in different parts of the country. On June 30, 2017 their branches
numbered to 24,524 (RBI, 2017).
The public sector banks’ (PSBs) in India have made significant contribution to almost
all the sectors of the Indian economy such as agriculture, industries of various categories, trade, employment and infrastructure. The ever increasing trends in deposits and credits represents the performance of banks’ in India. With over ₹ 7573085 crores as deposits and over ₹ 5237045 crores as loans on March 2017, the public sector banks’ commands the
heights of the Indian economy (RBI, 2017).
However, Non-Performing Assets (NPA) in credit portfolios in PSBs have become a serious issue since last two decades. NPA have not only affected the productivity and the profitability of banks’ but also damaged the image of the Indian banking and a drain on the
valued system of the society. Hence, the all-round cry is over the volume of NPA those have risen to an alarming level of over ₹ 330322 crores on March 2017 and this caused mainly
Review of Literature
The non-performing assets (NPAs) engrossed the attention of researchers in the late 1980’s when the necessity to transform the banking sector was felt in Indian economy.
Naidu, B.R. and Naidu, A.P.S. (2004) assessed the impact of NPA on the profitability of PSBs. The authors identified the diversion of funds as the number one reason for the NPA in the banking sector.
Gopalakrishnan, T.V. (2004), explained that NPA pose significant blow on the balance sheets and profitability of PSBs and high level of NPAs in bank books is a great risk to bank’s health, stability, viability and soundness.
Basu, P. (2005) recommended various banking reforms, integration of best practices from abroad and the development of capital market to counteract the threat of financial distress.
Shiralashetu and Akash (2006) reported that the priority sector, in particular the SSI sector contributed NPA significantly and PSBs accounts for 91.07% of the total NPA of priority sector.
Chakrabarti, R. (2006) discussed the major contemporary issues on public sector bank performance, and the nature and management of NPAs in Indian commercial banking. The author briefed that Indian banking sector is suffering from considerable NPAs in their asset portfolio.
Vallabh, et al., (2007) examined the impact of NPA on banks’ macroeconomic factors and bank-specific parameters. The other notable observation is that the banks' exposure to priority sector lending reduces the NPA.
Rajeev (2008) analyzed the level of NPA and its relationship with key performance indicators in Indian banking. Inference based on analysis revealed that rural branches contribute more NPA in SSI sector. Regarding the generation of the NPA, the study pointed out that inadequate funds and higher amounts of accumulated NPAs resulted in the creation of the more NPA in SSI.
Dash, M.K. and Kabra, G. (2010) concluded that the commercial banks’ that are aggressive and charge relatively higher interest rates incurred greater NPAs.
Prasad and Veena, D. (2011) recommended revitalizing the PSBs and incorporating the best practices in operations, technology and management to improve financial performance.
Siraj, K.K. and Pillai, P.S. (2011) recommended improvements in the management of the loan portfolio to withhold the impact created by the financial crisis.
Yadav, M.S. (2011) explained that the level of the NPAs of PSBs affected fifty percent profitability of the banks and its impact has increased at very large extent with other strategic banking variables in terms of business per employee and operating profit per employee.
Siraj, K.K. and Pillai, P.S. (2012) recognized that NPA remains a major threat and the incremental component explained through additions to NPA poses a great question mark on the efficiency of credit risk management practices of banks’ in India.
Ahmad, et al., (2013) concluded the causes for NPA in public sector banks’. Secondary data was collected for a period of five years and analysed by CAGR, average, ANOVA and banks’ ranking. Banks’ were ranked according to their performance to manage the NPA’s.
Arora, N. and Ostwal, N., (2014) concluded that the NPA’s are a big issue for the
banks’. According to them, the financial companies and public sector banks’ have higher NPA’s as compared to Private sector banks’.
Satpal (2014) has made the proper definition of NPA and the factors responsible to NPAs, reasons for high values of NPA’s and their impact on various banking systems.
Kavitha, et al., (2016) concluded that the extent of NPA is comparatively very high in public sector banks’ as compared to private banks’.
Singh, V. R., (2016) concluded that Non-Performing Assets have always created a big problem for banks’ in India and the NPAs level of our banks’ is still high as compared to the foreign banks’.
Statement of the problem
Adherence to newly defined prudential norms of accounting saw a heavy build-up of NPA portfolios in books of many banks’. In 1992, NPA were alarmingly high for most of the public sector banks’ accounting for more than 80% of the banking business in the
2007). As per latest report of the RBI, “Trends and Progress of Banking in India 2016-17” the Gross NPA of public sector banks’ have increased from ₹5,02,068 (9.83%) crores
in 2016 to ₹5,89,502 (11.82%) crores in 2017. So after publication of the Narasimham Committee Report (1991) profitability and its related issues including reduction of NPA received priority in the agenda of all public sector banks’ in the country. (Joshi and
Little, 1996).
Objectives of the study
The main objectives of the present study are under the following heads:
1. To undertake study regarding working mechanisms of Public Sector Banks’.
2. To study the impact of NPA on working of Public Sector Banks’.
3. To make analyses of the profitability of Public Sector Banks’.
Research Methodology
To achieve the stated objectives, data have been collected from various sources and include:- (1) Research reports, published articles, news reports and conference proceedings available in both national and international level related to NPA. The information obtained from these sources have been used for critical evaluation of the subject and identify research gap in the area of study.
(2) Statistical Data on NPA, bank-specific and economic indicators during 2015-16 to 2016-17, have been collected mainly from the RBI and the SBI websites, websites of other public sector banks, Indian Banks Association, India Stat and Ministry of Finance.
(3) Unpublished reports on the above topic.
Results and Discussion
1.1: Impact of NPA on public sector banks’ (2015-16 to 2016-17) Table-1 represents various performance indicators as below:
Table-1: Overall performance of Public Sector Banks' (2015-16 & 2016-17)
Sl. Performance indicators 2015-16 2016-17 %
Change
1 Total Number of Branches 82764 85018 2.72
2 Total Number of Employees 775476 790204 1.89
3 Total Assets (₹ in Crores) 7819575 8849658 13.17
4 Total Business (₹ in Crores) 12438512 12959113 4.18
5 Per Employee Business Average (₹ in
Crores) 15.64 15.82 1.15
6 Capital Adequacy Ratio (%) Average
(Basel-III) 11.36 11.73 0.37
7 Total Deposits (₹ in Crores) 6988889 7573085 8.35
8 Cost of Deposit (%) Average 6.65 6.03 -0.62
9 Credit-Deposit Ratio (%) Average 79.9 70.59 -3.31
10 Total Gross Advances (₹ in Crores) 5464223 5237045 -4.15 11 Total Priority Sector Advances (₹ in Crores) 1502271 1589374 5.79 12 Total Substandard Assets (₹ in Crores) 465099 469164 0.87 13 Total Doubtful-1 Assets (₹ in Crores) 384113 518077 34.87 14 Total Doubtful-2 Assets (₹ in Crores) 366671 637426 73.84 15 Total Doubtful-3 Assets (₹ in Crores) 53370 99681 86.77
16 Total Loss Assets (₹ in Crores) 46617 53087 13.87
17 Total Gross NPA (₹ in Crores) 519778 623867 20.02
18 Gross NPA (%) Average 9.51 12.32 2.81
19 Total Net NPA (₹ in Crores) 280419 330322 17.79
20 Net NPA (%) Average 6.08 7.7 1.62
21 Total Provisions for NPA (₹ in Crores) 143110 152386 6.48
22 Total Income (₹ in Crores) 679457 713163 4.96
23 Total Net Interest Income (₹ in Crores) 457790 423802 -7.42
24 Net Interest Income (%) Average 8.25 7.4 -0.85
25 Total Other Income (₹ in Crores) 85882 114790 33.66
26 Other Income (%) Average 1.57 1.7 0.13
27 Total Expenses (₹ in Crores) 622502 637823 2.46
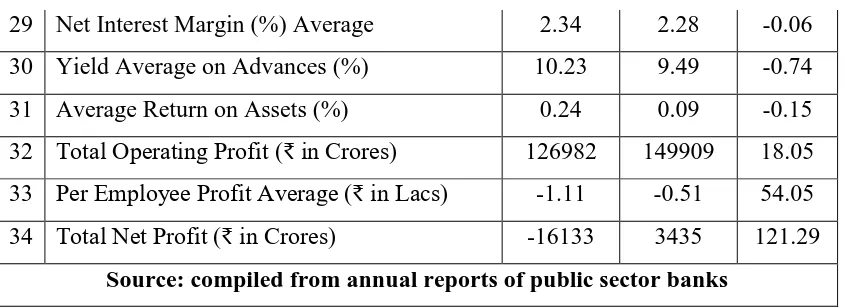
29 Net Interest Margin (%) Average 2.34 2.28 -0.06
30 Yield Average on Advances (%) 10.23 9.49 -0.74
31 Average Return on Assets (%) 0.24 0.09 -0.15
32 Total Operating Profit (₹ in Crores) 126982 149909 18.05 33 Per Employee Profit Average (₹ in Lacs) -1.11 -0.51 54.05
34 Total Net Profit (₹ in Crores) -16133 3435 121.29
Source: compiled from annual reports of public sector banks
crores, Loss assets as 13.87% from ₹ 46617 crores to ₹ 53087 crores and Substandard assets as 0.87% from ₹ 465099 crores to ₹ 469164 crores.
Accordingly the situation of NPA has become more terrible. Gross NPA has been increased as 20.02% from ₹ 519778 crores to ₹ 623867 crores, Gross NPA (%) increased as 2.81% from 9.51 to 12.32, Net NPA increased as 17.79% from ₹ 280419 crores to ₹ 330322
crores, Net NPA (%) increased as 1.62% from 6.08 to 7.7. Due to such bad loans, Provisions for NPA has been increased as 6.48% from ₹ 143110 crores to ₹ 152386 crores. [8]
This all hampered the overall working of PSBs as Credit-Deposit ratio (%) has been decreased as -3.31% from 79.9 to 70.59, Gross advances decreased as -4.15% from ₹ 5464223 crores to ₹ 5237045 crores, Net interest income decreased as -7.42% from ₹ 457790 crores to ₹ 423802 crores, Net interest income (%) decreased as -0.85% from 8.25 to 7.4, Net
interest margin (%) decreased as -0.06% from 2.34 to 2.28, Yield average on advances (%) decreased as -0.74% from 10.23 to 9.49, Average return on assets (%) decreased as -0.15% from 0.24 to 0.09.
Overall due to such negative impacts, total expenses of PSBs increased as 2.46% from ₹ 622502 crores to ₹ 637823 crores which adversely effected the per employee profit as ₹ -0.51 lacs. However, Net profit have increased as 121.29% from ₹-16133 crores to ₹ 3435 crores, but keeping in view such a large transactions made by these 21 public sector banks’
such a low cumulative net profit is not acceptable and this shows a picture of bad impacts of NPA on public sector banks’ in India.
1.2: Impact of NPA on Allahabad Bank (2015-16 to 2016-17) [1] Table-2A & 3A represents various performance indicators as below:
[image:7.595.68.490.31.185.2]Doubtful-2 assets increased by 48.63% (PSBs 73.84%), Doubtful-3 assets increased by 280.89% (PSBs 86.77%) and Loss assets increased by 234.5% (PSBs 13.87%).
Accordingly, the position of NPA had become more drastic as Gross NPA increased by 34.47% (PSBs 20.02%), Gross NPA (%) increased by 3.33% (PSBs 2.81%), Net NPA increased by 30.51% (PSBs 17.79%), Net NPA (%) increased by 2.16% (PSBs 1.62%), similarly provisions for NPA has been increased by 16.67% (PSBs 6.48%).
This all hampered the overall working of the bank as total business of the bank had decreased by 0.45% (PSBs 4.18%), CreditDeposit ratio (%) decreased by 0.4% (PSBs -3.31%), Net interest income decreased by -4.19% (PSBs -7.42%), Net interest income (%) decreased by -0.92% (PSBs -0.85%), Net interest margin (%) by -0.11% (PSBs -0.06%), Yield average on advances (%) decreased by -0.83% (PSBs -0.74%), Average return on assets (%) decreased by -0.20% (PSBs -0.15%).
TABLE-2A: PERFORMANCE INDICATORS OF PUBLIC SECTOR BANKS (2015-16)
Performance
indicators
ALB ANB BOB BOI BO
M
CAN CBI CO
R
DB IB
Number of Branches 2962 2803 5330 4920 1895 5849 4624 2440 1846 2565 Number of Employees 2274 2 1865 6 5123 7 4618 0 1195 7 5400 8 3768 5 1956 9 1390 6 2014 0 Total Assets (₹ in
Crores) 2404 57 2026 87 2274 95 6099 13 1609 57 5842 15 3066 21 1139 90 1334 41 1347 80 Total Business (₹ in
Crores) 3599 74 3106 73 9578 08 8709 35 2502 30 8045 06 4563 36 3454 93 2032 42 3109 18 Per Empl. Business (₹
in Cr.)
14.8 5
15.1 2
16.8 17.9 6 18.1 8 14.4 4 11.9 5 18.7 9 14.6 2 15.3 1 CAR % (Basel-III) 11.0
2 11.5 8 13.1 7 12.0 1
11.2 11.0 8
10.4 1
10.5 6
11 13.2
Total Deposits (₹ in Crores) 2006 44 1743 02 5740 38 5130 05 1389 90 4797 92 2661 84 2051 70 1174 31 1782 86 Cost of Deposit (%) 6.61 7.18 5.08 5.25 6.75 6.31 6.86 7.51 7.2 6.76 Credit-Deposit Ratio
(%)
79.4 3
78.2 78.2 9 72.8 5 80.0 3 68.6 6 71.4 4 68.3 9
69.1 73.3 5 Gross Adv. (₹ in Cr.) 1577
Priority Sector Adv. (₹ in Cr.)
6269 5 2437 3 9217 8 8923 2 4148 5 1455 8 8277 1 5755 4 3411 7 4649 0 Substandard Assets (₹
in Cr.)
5356 9
3337 1156 9 1439 56 5342 6 1749 7 9396 3
6379 2104 2527
Doubtful-1 Assets (₹ in Cr.)
3617 2
2566 2576 6
1497 60
2280 9
8116 5377 2
1183 9
3488 2482
Doubtful-2 Assets (₹ in Cr.)
5479 6
4328 1654
29
2126 2
6237 5775 3
1928 3482
Doubtful-3 Assets (₹ in Cr.)
2465 1169 1929
9
917 0 1773 5
658 211
Loss Assets (₹ in Cr.) 1843 2599 3186 2433 1
5442 0 3983 111 378 122
Gross NPA (₹ in Cr.) 1538 4 1144 4 4052 1 5178 1 1038 5 3163 7 2272 1 1454 4
8560 8827
Gross NPA (%) 9.76 8.39 9.99 13.0 7
9.34 9.4 11.9 5
9.98 9.98 6.66
Net NPA (₹ in Cr.) 1029 2
6035 1940 6
2799 6
6832 2096 7
1324 2
9160 5230 5419
Net NPA (%) 6.76 4.61 5.06 7.79 6.35 6.42 7.36 6.53 6.35 4.2 Provisions for NPA (₹
in Cr.)
4180 5394 1376 6
1410 1
3425 9608 4913 5378 1181 2926
Total Income (₹ in Cr.)
994 1919 9 4196 0 4576 4 1407 2 4889 7 2782 5 2114 6 1136 3 1825 1 Net Interest Income (₹
in Cr.)
4436 5320 4406 1 1172 4 1305 2 4402 2 2588 7 1941 1 1064 6 1624 4 Net Interest Income
(%)
8.49 7.7 6.31 9.98 8.71 8.11 8.85 8.23 8.25 8.13
Other Income (₹ in Cr.)
6557 1564 4999 3653 1019 4875 1938 7035 717 1781
Other Income (%) 0.86 8.15 0.72 1.54 0.68 0.9 0.66 8.21 0.68 0.89 Total Expenses (₹ in
Cr.) 2172 6 1523 9 5445 5 5209 9 1172 7 4175 1 2518 3 1805 1 1043 7 1499 3 Cost to Income Ratio
(%)
47.0 6
42.4 9
50.3 39.1 52.1 2
50.6 5
70.6 5
48.2 71.0 3
51.3 5 Net Interest Margin
(%)
Yield Average on Adv. (%)
9.24 10.7 1
11.5 6
8.28 7.06 8.11 10.0 9 10.2 3 10.0 5 9.63
Average Return on Assets (%)
-0.33 0.28 -0.78 0.94 0.07 -0.52 -0.48 -0.23 -0.75 0.36
Operating Profit (₹ in Cr.)
4134 3960 8816 6036 2345 7147 2642 3095 925 3032
Per Employee Prof.(₹ in Lacs)
-3.08 2.89 -0.1 -12.2 0.73 -5 -3.76 -3 -2.35 3.53
Net Profit/Loss (₹ in Cr.)
-743 540 -5396
-6089
101 -2813
-1418
-506 -935 711
Compiled from annual reports of public sector banks'
TABLE-3A: PERFORMANCE INDICATORS OF PUBLIC SECTOR BANKS (2016-17)
Performance
indicators ALB ANB BOB BOI BOM CAN CBI COR DB IB
Number of Branches 3246 2908 5422 5016 1897 6083 4714 2517 1874 2682
Number of Employees 2394
4
1938
0 52420 4775 0 1297 4 5571 7 3174 4 1966 7 1398 5 2092 4
Total Assets (₹ in
Crores) 2379 62 2254 46 69487 5 6263 09 1593 32 5961 58 3334 01 1274 90 1296 23 1446 10
Total Business (₹ in
Crores) 3583 52 3396 73 10132 66 9338 20 2405 90 8372 84 4496 79 3609 16 1914 81 3146 54
Per Empl. Business (₹
in Cr.) 15.03 16.61 17.49 19.4 18.54 14.42 11.81 19.58 13.69 14.88
CAR % (Basel-III) 11.45 12.38 12.24 12.14 11.18 12.86 10.95 11.32 11.39 13.64
Total Deposits (₹ in
Crores) 2018 17 1954 41 60167 5 5400 32 1390 53 4952 75 2966 71 2205 59 1139 43 1825 09
Cost of Deposit (%) 5.94 6.43 4.82 4.84 6.05 5.59 6.2 6.74 6.43 6.03
Credit-Deposit Ratio
(%) 79.03 73.8 71.86 68.91 73.02 68.38 51.57 63.64 66.95 72.4
Gross Adv. (₹ in Cr.) 1581
03 1442 32 38325 9 2803 02 1015 37 3420 09 1530 08 1403 56 7753 8 1321 45
Priority Sector Adv. (₹
in Cr.) 6537 8 2664 3 10407 6 9817 5 4038 8 1602 6 8808 5 6060 4 3699 2 5376 5
Substandard Assets (₹
in Cr.)
5808
3 6611 8804
1086 26 5284 2 8081 9 6033
Doubtful-1 Assets (₹ in
Cr.)
5179
1
3692
3 29186 1249 52 6644 1 1424 1 8855
6 7991 2212 2042
Doubtful-2 Assets (₹ in
Cr.) 8144 6 6259 7 2361 46 4604 4 1202 4 9087
6 4371 5334
Doubtful-3 Assets (₹ in
Cr.) 9389
1047
6
2770
8 4774 0
2592
4 1091 285
Loss Assets (₹ in Cr.)
6165 590 4729
2530
7 1783 586 6824 173 562 40
Gross NPA (₹ in Cr.) 2068
7
1767
0 42719 5204 4 1717 9 3420 2 2725 1 1704 5 1261
9 9865
Gross NPA (%) 13.09 12.25 10.46 13.22 16.93 9.63 17.81 11.7 16.27 7.47
Net NPA (₹ in Cr.) 1343
3
1035
4 18080 2530 3 1123 0 2173 8 1421 8 1169
2 7735 5606
Net NPA (%) 8.92 7.57 4.72 6.9 11.76 6.33 10.2 8.33 10.66 4.39
Provisions for NPA (₹
in Cr.) 4877 7302 7679
1167
2 5794 7437 6216 3860 1743 3788
Total Income (₹ in Cr.)
1330 2033
6 48957 4640 4 1357 0 4894 2 2753 7 2256 1 1143 7 1802 5
Net Interest Income (₹
in Cr.) 4250 5531 13513
1182 6 1206 1 4138 7 2466 1 1947 1 1018 2 1604 0
Net Interest Income (%) 7.57 8.38 6.27 2.03 7.55 7.35 8.1 9.81 7.87 7.67
Other Income (₹ in Cr.) 1222
9 2308 6758 6772 1508 7554 2876 3090 1251 2211
Other Income (%) 1.13 1.07 1 1.45 0.94 1.34 0.94 13.7 0.97 1.06
Total Expenses (₹ in
Cr.)
2085
7
1594
8 47574 4799 8 1174 3 4002 8 2444 8 1812 2 1004 2 1425 0
Cost to Income Ratio
(%) 51.25 44.03 45.86 76.38 60.98 48.85 67.31 41.13 62.01 45.62
Net Interest Margin (%) 2.54 3.07 2.19 2.6 1.99 2.23 2.51 2.12 2 2.59
Yield Average on Adv.
(%) 8.41 9.77 8804 7.98 8.42 7.35 9.01 9.85 8.98 9.17
Average Return on
Assets (%) -0.13 0.08 0.2 -0.24 -0.86 0.2 -0.8 0.23 -0.67 0.67
Operating Profit (₹ in
Cr.) 3867 4388 10975 9733 1827 8914 3089 4439 1390 4001
Per Employee Prof.(₹ in
Lacs) -1.3 1 0.26 -3.2
-10.58 2 -6.49 3 -6.18 6.72
Net Profit/Loss (₹ in
Cr.) -314 174 1383 -1558 -1373 1122 -2439 561 -863 1406
Overall due to such negative impacts, cost to income ratio (%) had increased as 4.19% (PSBs -0.53%), operating profit of the bank decreased by -6.45% (PSBs 18.05%), per employee profit decreased as ₹ -1.3 Lacs (PSBs ₹ -0.51 Lacs) and ultimately to the net profit of the bank as ₹ -314 Crores. This all reflects bad impact of NPA on workings of Allahabad Bank.
1.3: Impact of NPA on Andhra Bank (2015-16 to 2016-17) [2] Table-2A & 3A represents various performance indicators as below:
Table elaborates that quality of assets have been deteriorated in the bank during this period. Credit-Deposit ratio (%) had declined by –4.4% (PSBs -3.31%), when substandard assets increased by 98.11% (PSBs 0.87%), Doubtful-1 assets increased by 1338.93% (PSBs 34.87%), Doubtful-2 assets increased by 1346.32% (PSBs 73.84%), Doubtful-3 assets increased by 796.15% (PSBs 86.77%) and Loss assets increased by 77.29% (PSBs 13.87%).
Accordingly, the position of NPA had become more drastic as Gross NPA increased by 54.4% (PSBs 20.02%), Gross NPA (%) increased by 3.86% (PSBs 2.81%), Net NPA increased by 71.56% (PSBs 17.79%), Net NPA (%) increased by 2.96% (PSBs 1.62%), similarly provisions for NPA has been increased by 35.37% (PSBs 6.48%).
This all hampered the overall working of the bank as other income (%) of the bank had decreased by -7.08% (PSBs 0.13%), total expenses increased by 4.65% (PSBs 2.46%), Net interest margin (%) decreased by -0.11% (PSBs -0.06%), Yield average on advances (%) decreased by -0.94% (PSBs -0.74%), Average return on assets (%) decreased by -0.20% (PSBs -0.15%).
Overall due to such negative impacts, cost to income ratio (%) had increased as 1.54% (PSBs -0.53%), per employee profit decreased as -65.39% (PSBs 54.05%) and ultimately to the net profit of the bank was decreased by -67.77% in comparison to the previous year 2015-16. This all reflects bad impact of NPA on workings of Andhra Bank.
1.4: Impact of NPA on Bank of Baroda (2015-16 to 2016-17) [3] Table-2A & 3A represents various performance indicators as below:
However, the bank was quite successful to retain its NPA on comfortable levels, but amount of Gross NPA increased by 5.42% (PSBs 20.02%), gross NPA (%) increased by 0.47% (PSBs 2.81%).
Overall due to such negative impacts, Net interest income of the bank was decreased by 69.33% (PSBs 7.42%), Net interest income (%) was decreased by 0.04% (PSBs -0.85%), Yield average on advances (%) decreased by -2.7% (PSBs -0.74%). This all reflects bad impact of NPA on workings of Bank of Baroda.
1.5: Impact of NPA on Bank of India (2015-16 to 2016-17) [4] Table-2A & 3A represents various performance indicators as below:
Table elaborates that during the period the bank was having the largest quantity of bad quality assets among all public sector banks around 1/4th in quantity. During 2016-17 the bank had substandard assets as ₹ 108626 crores, Doubtful-1 assets as ₹ 124952 crores,
Doubtful-2 assets as ₹ 236146 crores, Doubtful-3 assets as ₹ 27708 crores, and loss assets as ₹ 25307 crores.
Due to such heavy amount of bad assets, costdeposit ratio (%) had decreased by -0.41% (PSBs -0.62%), Credit-Deposit ratio (%) decreased by -3.94% (PSBs -3.31%), and gross advances decreased by -21.68% (PSBs -4.15%).
However, the bank was quite successful to retain its NPA on comfortable levels, but amount of Gross NPA increased by 0.5% (PSBs 20.02%), gross NPA (%) increased by 0.15% (PSBs 2.81%).
This all hampered the overall working of the bank as Net interest income (%) decreased by -7.95% (PSBs -0.85%), Yield average on advances (%) decreased by -0.3% (PSBs -0.74%), Average return on assets (%) decreased by -1.18% (PSBs -0.15%), other income (%) decreased by -0.09% (PSBs 0.13%) where cost to income ratio (%) was increased by 37.28% (PSBs -0.53%).
Overall due to such negative impacts, per employee profit of the bank was noted as ₹
-3.2 lacs in 2016-17 accordingly the net profit of the bank in the same year as ₹ -1558 crores which reflects bad impact of NPA on workings of Bank of India.
1.6: Impact of NPA on Bank of Maharashtra (2015-16 to 2016-17) [5] Table-2A & 3A represents various performance indicators as below:
Accordingly, the position of NPA had become more drastic as Gross NPA increased by 65.42% (PSBs 20.02%), Gross NPA (%) increased by 7.59% (PSBs 2.81%), Net NPA increased by 64.37% (PSBs 17.79%), Net NPA (%) increased by 5.41% (PSBs 1.62%), similarly provisions for NPA has been increased by 69.16% (PSBs 6.48%).
This all hampered the overall working of the bank as total business of the bank had decreased by 3.85% (PSBs 4.18%), CreditDeposit ratio (%) decreased by 7.01% (PSBs -3.31%), Gross advances decreased by -8.72% (PSBs -4.15%), priority sector advances decreased by -2.64% (PSBs 5.79%), total income decreased by -3.56% (PSBs 4.96%), Net interest income decreased by 7.59% (PSBs 7.42%), Net interest income (%) decreased by -1.16% (PSBs -0.85%), Net interest margin (%) by -0.6% (PSBs -0.06%), Average return on assets (%) decreased by -0.93% (PSBs -0.15%).
Overall due to such negative impacts, cost to income ratio (%) had increased as 8.86% (PSBs -0.53%), total expenses had increased by 0.13% (PSBs 2.46%), operating profit of the bank decreased by -22.08% (PSBs 18.05%), per employee profit decreased as ₹ -10.58 Lacs (PSBs ₹ -0.51 Lacs) and ultimately to the net profit of the bank decreased as ₹ -1373 Crores.
This all reflects bad impact of NPA on workings of Bank of Maharashtra. 1.7: Impact of NPA on Canara Bank (2015-16 to 2016-17) [6]
Table-2A & 3A represents various performance indicators as below:
Table elaborates that quality of assets have been deteriorated in the bank during this period. As substandard assets increased by 361.9% (PSBs 0.87%), Doubtful-1 assets increased by 7.54% (PSBs 34.87%), Doubtful-2 assets increased by 92.78% (PSBs 73.84%), and Loss assets increased by ₹ 586 crores.
Accordingly, the position of NPA had become more drastic as Gross NPA increased by 8.1% (PSBs 20.02%), Gross NPA (%) increased by 2.44% (PSBs 2.81%), Net NPA increased by 3.67% (PSBs 17.79%).
This all hampered the overall working of the bank as per employee business of the bank had decreased by -0.13% (PSBs 1.15%), Credit-Deposit ratio (%) decreased by -0.28% (PSBs -3.31%), Net interest income decreased by -5.98% (PSBs -7.42%), Net interest income (%) decreased by 0.76% (PSBs 0.85%), Yield average on advances (%) decreased by -0.76% (PSBs -0.74%). This all reflects bad impact of NPA on workings of Canara Bank. 1.8: Impact of NPA on Central Bank of India (2015-16 to 2016-17) [7]
Table-2A & 3A represents various performance indicators as below:
by 57.35% (PSBs 73.84%), Doubtful-3 assets increased by 46.17% (PSBs 86.77%) and Loss assets increased by 73.58% (PSBs 13.87%).
Accordingly, the position of NPA had become more drastic as Gross NPA increased by 19.93% (PSBs 20.02%), Gross NPA (%) increased by 5.86% (PSBs 2.81%), Net NPA increased by 7.37% (PSBs 17.79%), Net NPA (%) increased by 2.84% (PSBs 1.62%), similarly provisions for NPA has been increased by 26.52% (PSBs 6.48%).
This all hampered the overall working of the bank as total business of the bank had decreased by -1.45% (PSBs 4.18%), per employee business decreased by -1.17% (PSBs 1.15%), Credit-Deposit ratio (%) decreased by -19.87% (PSBs -3.31%),
Gross advances decreased by -19.53% (PSBs -4.15), total income decreased by -1.03% (PSBs 4.96%), Net interest income decreased by -4.73% (PSBs -7.42%), Net interest income (%) decreased by 0.75% (PSBs 0.85%), Net interest margin (%) decreased by 0.27% (PSBs -0.06%), Yield average on advances (%) decreased by -1.08% (PSBs -0.74%), Average return on assets (%) decreased by -0.32% (PSBs -0.15%).
Overall due to such negative impacts, per employee profit decreased to ₹ -6.49 Lacs (PSBs ₹ -0.51 Lacs) and ultimately to the net profit of the bank to ₹ -2439 Crores. This all
reflects bad impact of NPA on workings of Central Bank of India. 1.9: Impact of NPA on Corporation Bank (2015-16 to 2016-17) [8] Table-2A & 3A represents various performance indicators as below:
After going through the figures it appears that there was a little impact of NPA on working of Corporation Bank. CreditDeposit ratio (%) was decreased by 4.75% (PSBs -3.31), Loss assets was increased by 55.85% (PSBs 13.87%)
Accordingly, Gross NPA increased by 17.19% (PSBs 20.02%), Gross NPA (%) increased by 1.72% (PSBs 2.81%), Net NPA increased by 27.64% (PSBs 17.79%), Net NPA (%) increased by 1.8% (PSBs 1.62%).
This all hampered the overall working of the bank as other income of the bank had decreased by -56.07% (PSBs 33.66%), total expenses was increased by 0.39% (PSBs 2.46%), and Yield average on advances (%) was decreased by -0.38% (PSBs -0.74%). Ultimately the bank had net profit as ₹ 561 crores during 2016-17 and keeping in view its large total
business such net profit is not desirable.
1.10: Impact of NPA on Dena Bank (2015-16 to 2016-17) [9] Table-2A & 3A represents various performance indicators as below:
increased by 108.22% (PSBs 0.87%), Doubtful-2 assets increased by 126.71% (PSBs 73.84%), Doubtful-3 assets increased by 65.8% (PSBs 86.77%) and Loss assets increased by 48.67% (PSBs 13.87%).
Accordingly, the position of NPA had become more drastic as Gross NPA increased by 47.41% (PSBs 20.02%), Gross NPA (%) increased by 6.29% (PSBs 2.81%), Net NPA increased by 47.89% (PSBs 17.79%), Net NPA (%) increased by 4.31% (PSBs 1.62%), similarly provisions for NPA has been increased by 47.58% (PSBs 6.48%).
This all hampered the overall working of the bank as total business of the bank had decreased by -5.78% (PSBs 4.18%), per employee business decreased by -6.36% (PSBs 1.15%), Credit-Deposit ratio (%) decreased by -2.15% (PSBs -3.31%),
Gross advances decreased by 9.64% (PSBs 4.15%), Net interest income decreased by -4.35% (PSBs -7.42%), Net interest income (%) decreased by -0.38% (PSBs -0.85%), Net interest margin (%) decreased by -0.16% (PSBs -0.06%), Yield average on advances (%) decreased by -1.07% (PSBs -0.74%),
Overall due to such negative impacts, per employee profit decreased to ₹ -6.18 Lacs (PSBs ₹ -0.51 Lacs) and ultimately to the net profit of the bank as ₹ -863 Crores. This all
reflects bad impact of NPA on workings of Dena Bank.
1.11: Impact of NPA on Indian Bank (2015-16 to 2016-17) [10] Table-2A & 3A represents various performance indicators as below:
Doubtful-2 assets increased by 53.18% (PSBs 73.84%), Doubtful-3 assets increased by 35.07% (PSBs 86.77%). Accordingly, Gross NPA increased by 11.75% (PSBs 20.02%), Gross NPA (%) increased by 0.81% (PSBs 2.81%), Net NPA increased by 3.5% (PSBs 17.79%), Net NPA (%) increased by 0.19% (PSBs 1.62%), similarly provisions for NPA has been increased by 29.46% (PSBs 6.48%).
This all hampered the overall working of the bank as per employee business of the bank had decreased by -2.8% (PSBs 1.15%), Credit-Deposit ratio (%) decreased by -0.95% (PSBs -3.31%), gross advances decreased by -0.36% (PSBs -4.15%). Total income decreased by -1.23% (PSBs 4.96%), Net interest income decreased by -1.25% (PSBs -7.42%), Net interest income (%) decreased by -0.46% (PSBs -0.85%), Yield average on advances (%) decreased by -0.46% (PSBs -0.74%).
This all reflects bad impact of NPA on workings of Indian Bank, however performance of the bank was much comfortable in comparison to other public sector banks’. 1.12: Impact of NPA on Indian Overseas Bank (2015-16 to 2016-17) [11]
Table elaborates that quality of assets have been deteriorated in the bank during this period. Substandard assets increased by 24.61% (PSBs 0.87%), Doubtful-1 assets increased by 15.91% (PSBs 34.87%), and Loss assets increased by 82.57% (PSBs 13.87%).
Accordingly, the position of NPA had become more drastic as Gross NPA increased by 65.43% (PSBs 20.02%), Gross NPA (%) increased by 3.35% (PSBs 2.81%), Net NPA increased by 73.43% (PSBs 17.79%), Net NPA (%) increased by 2.48% (PSBs 1.62%), similarly provisions for NPA has been increased by 48.86% (PSBs 6.48%).
This all hampered the overall working of the bank as per employee business of the bank had decreased by 3.14% (PSBs 1.15%), capital adequacy ratio (%) was decreased by -0.67% (PSBs 0.37%), Credit-Deposit ratio (%) decreased by -1.55% (PSBs -3.31%), gross advances decreased by -1.12% (PSBs -4.15%), other income was decreased by -1.42% (PSBs 33.66%), other income (%) decreased by -0.03% (PSBs 0.13%), total expenses was increased by 9.4% (PSBs 2.46%), Yield average on advances (%) decreased by -0.58% (PSBs -0.74%), Average return on assets (%) decreased by -1.53% (PSBs -0.15%).
Overall due to such negative impacts, operating profit of the bank decreased by -16.88% (PSBs 18.05%), per employee profit decreased to ₹ -1.2 Lacs (PSBs ₹ -0.51 Lacs) and ultimately to the net profit of the bank decreased to ₹ -454 Crores. This all reflects bad
[image:17.595.67.529.462.744.2]impact of NPA on workings of Indian Overseas Bank.
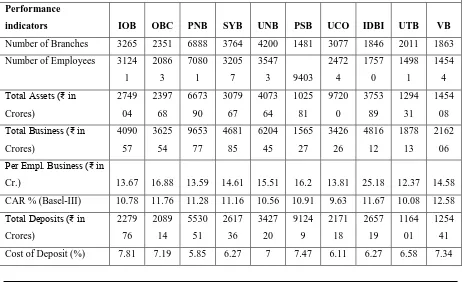
TABLE-2B: PERFORMANCE INDICATORS OF PUBLIC SECTOR BANKS (2015-16)
Performance
indicators IOB OBC PNB SYB UNB PSB UCO IDBI UTB VB
Number of Branches 3265 2351 6888 3764 4200 1481 3077 1846 2011 1863
Number of Employees 3124
1 2086 3 7080 1 3205 7 3547
3 9403 2472 4 1757 0 1498 1 1454 4
Total Assets (₹ in
Crores) 2749 04 2397 68 6673 90 3079 67 4073 64 1025 81 9720 0 3753 89 1294 31 1454 08
Total Business (₹ in
Crores) 4090 57 3625 54 9653 77 4681 85 6204 45 1565 27 3426 26 4816 12 1878 13 2162 06
Per Empl. Business (₹ in
Cr.) 13.67 16.88 13.59 14.61 15.51 16.2 13.81 25.18 12.37 14.58
CAR % (Basel-III) 10.78 11.76 11.28 11.16 10.56 10.91 9.63 11.67 10.08 12.58
Total Deposits (₹ in
Crores) 2279 76 2089 14 5530 51 2617 36 3427 20 9124 9 2171 18 2657 19 1164 01 1254 41
Credit-Deposit Ratio
(%) 70.68 73.61 74.55 78.88 83.69 71.8 65.43 80.73 59.86 69.41
Gross Adv. (₹ in Cr.) 1810
81 1488 79 4123 26 2064 49 2673 54 6527 7 1355 08 2158 93 7141 2 9076 5
Priority Sector Adv. (₹
in Cr.) 5809 0 6225 4 1392 33 6255 2 1025 96 2450 8 4503 2 5517 4 2980 9 3800 3
Substandard Assets (₹ in
Cr.) 5516 8439 6506 3405 1836 5968 1143 2221 3077
Doubtful-1 Assets (₹ in
Cr.) 6734 2425 3659 997 1180 5815 3069 1964 1170
Doubtful-2 Assets (₹ in
Cr.) 3706 3119 1053 7457 2068 1540
Doubtful-3 Assets (₹ in
Cr.) 0 508 154 781 261 224
Loss Assets (₹ in Cr.) 132 130 385 65 4.82 885 0 37 14 Gross NPA (₹ in Cr.)
9020 1470 1 5581 8 1383 2 2417
1 4229 2090
7
2487
5 9471 6027
Gross NPA (%) 4.98 9.57 12.9 6.7 8.7 6.48 15.43 10.07 13.26 6.64
Net NPA (₹ in Cr.)
5658 9932 3542
3 9014 1402
6 2949 1144
3
1464
3 6110 4277
Net NPA (%) 3.2 6.7 8.61 4.48 5.25 4.62 9.09 6.78 9.04 4.81
Provisions for NPA (₹
in Cr.) 2994 3649
1814
5 3638 4655 854 6318 9204 338 1459
Total Income (₹ in Cr.) 2485
3 2193 4 5342 4 2570 7 3583
1 9222 2015
7
3145
3
1192
7 3634
Net Interest Income (₹
in Cr.) 2268 3 2016 8 4742 4 2319 7 3219
9 8744 1856
1
2804
2 2014 2760
Net Interest Income (%) 8.99 8.78 7.02 7.92 8.37 8.91 8.29 8.33 7.92 8.77
Other Income (₹ in Cr.) 2169 1766 6000 2508 3632 478 1596 3410 1467 873
Other Income (%) 0.85 0.77 1.06 0.86 0.94 0.49 0.71 1.01 1.17 0.63
Total Expenses (₹ in
Cr.)
2425
1
1825
2 9972 2590
6
3010
8 8886 1655
4
2608
3 2361 1257
5
Cost to Income Ratio
(%) 63.53 48.44 46.79 60.83 52.1 52.16 47.19 43.47 79.31 57.39
Net Interest Margin (%) 2.05 2.66 2.6 2.28 2.16 1.8 2.16 1.88 2.01 2.27
Yield Average on Adv.
(%) 14.62 13.55 9.1 8.63 9.63 10.7 10.17 12.99 9.93 10.52
Average Return on
Cr.) 9
Per Employee Prof.(₹ in
Lacs) 2.01 0.73 -6 -5.51 16.13 4
-11.29 -21 12.09 3
Net Profit/Loss (₹ in
Cr.) 601 156 -3974 -1643 1352 335 -2799 -3664 -281 381
Compiled from annual reports of public sector banks'
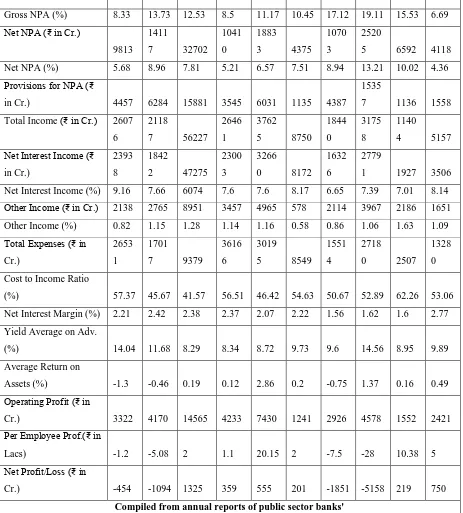
TABLE-3B: PERFORMANCE INDICATORS OF PUBLIC SECTOR BANKS (2016-17)
Performance
indicators IOB OBC PNB SYB UNB PSB UCO IDBI UTB VB
Number of Branches 3381 2376 6937 3933 4282 1500 3100 1896 2053 2031
Number of Employees 3194
7
2155
2 73919
3498
9
3687
7 9400
2462 0 1818 7 1496 2 1567 9
Total Assets (₹ in
Crores) 2856 36 2530 64 72033 1 2990 73 4556 68 9664 3 1003 70 3617 67 1410 53 1548 81
Total Business (₹ in
Crores) 4250 90 3857 77 10411 97 4676 26 6800 76 1458 03 3329 40 4593 63 1974 42 2298 33
Per Empl. Business (₹
in Cr.) 13.24 17.9 14.17 13.51 16.43 15.34 13.48 23.45 13.04 14.17
CAR % (Basel-III) 10.11 11.64 11.66 12.03 11.79 11.05 10.93 10.7 11.14 12.73
Total Deposits (₹ in
Crores) 2460 49 2193 39 62170 4 2605 61 3783 92 8554 0 2012 85 2685 38 1269 39 1330 12
Cost of Deposit (%) 7.84 6.33 5.33 5.86 6.28 6.73 5.83 5.06 6 6.5
Credit-Deposit Ratio
(%) 69.13 75.92 67.47 79.47 81.45 69.15 65.41 76.13 55.54 72.79
Gross Adv. (₹ in Cr.) 1790
41 1577 06 41949 3 2070 65 3016 84 6026 3 1316 55 1908 25 7050 3 9682 1
Priority Sector Adv. (₹
in Cr.) 6363 5 6556 2 14023 9 6726 2 1118 61 2492 8 4208 4 6056 0 3062 3 4059 4
Substandard Assets (₹
in Cr.) 6874 7831 4873 2312 2628 5007 4692 1602 1726
Doubtful-1 Assets (₹ in
Cr.) 7806
1060
6 6171 6311 1681 4530 5924 3343 2480
Doubtful-2 Assets (₹ in
Cr.) 4421 5212 1784 9281 4647 1867
Doubtful-3 Assets (₹ in
Cr.) 0 1204 195 2574 1116 271
2 9 9 2 0 2 2
Gross NPA (%) 8.33 13.73 12.53 8.5 11.17 10.45 17.12 19.11 15.53 6.69
Net NPA (₹ in Cr.)
9813 1411
7 32702
1041
0
1883
3 4375
1070
3
2520
5 6592 4118
Net NPA (%) 5.68 8.96 7.81 5.21 6.57 7.51 8.94 13.21 10.02 4.36
Provisions for NPA (₹
in Cr.) 4457 6284 15881 3545 6031 1135 4387
1535
7 1136 1558
Total Income (₹ in Cr.) 2607
6
2118
7 56227
2646
1
3762
5 8750
1844
0
3175
8
1140
4 5157
Net Interest Income (₹
in Cr.)
2393
8
1842
2 47275
2300
3
3266
0 8172
1632
6
2779
1 1927 3506
Net Interest Income (%) 9.16 7.66 6074 7.6 7.6 8.17 6.65 7.39 7.01 8.14
Other Income (₹ in Cr.) 2138 2765 8951 3457 4965 578 2114 3967 2186 1651
Other Income (%) 0.82 1.15 1.28 1.14 1.16 0.58 0.86 1.06 1.63 1.09
Total Expenses (₹ in
Cr.)
2653
1
1701
7 9379
3616
6
3019
5 8549
1551
4
2718
0 2507
1328
0
Cost to Income Ratio
(%) 57.37 45.67 41.57 56.51 46.42 54.63 50.67 52.89 62.26 53.06
Net Interest Margin (%) 2.21 2.42 2.38 2.37 2.07 2.22 1.56 1.62 1.6 2.77
Yield Average on Adv.
(%) 14.04 11.68 8.29 8.34 8.72 9.73 9.6 14.56 8.95 9.89
Average Return on
Assets (%) -1.3 -0.46 0.19 0.12 2.86 0.2 -0.75 1.37 0.16 0.49
Operating Profit (₹ in
Cr.) 3322 4170 14565 4233 7430 1241 2926 4578 1552 2421
Per Employee Prof.(₹ in
Lacs) -1.2 -5.08 2 1.1 20.15 2 -7.5 -28 10.38 5
Net Profit/Loss (₹ in
Cr.) -454 -1094 1325 359 555 201 -1851 -5158 219 750
Compiled from annual reports of public sector banks'
1.13: Impact of NPA on Oriental Bank of Commerce (2015-16 to 2016-17) [12] Table-2B & 3B represents various performance indicators as below:
Table elaborates that quality of assets have been deteriorated in the bank during this period. Doubtful-1 assets increased by 337.36% (PSBs 34.87%), Doubtful-2 assets was increased by 19.29% (PSBs 73.84%).
[image:20.595.68.531.45.558.2]increased by 42.13% (PSBs 17.79%), Net NPA (%) increased by 2.26% (PSBs 1.62%), similarly provisions for NPA has been increased by 72.21% (PSBs 6.48%).
This all hampered the overall working of the bank as capital adequacy ratio (%) was decreased by -0.12% (PSBs 0.37%), total income was decreased by -3.4% (PSBs 4.96%), Net interest income decreased by 8.65% (PSBs 7.42%), Net interest income (%) decreased by -1.12% (PSBs -0.85%), Net interest margin (%) decreased by -0.24% (PSBs -0.06%), Yield average on advances (%) decreased by -1.87% (PSBs -0.74%), Average return on assets (%) decreased by -0.53% (PSBs -0.15%).
Overall due to such negative impacts, per employee profit decreased to ₹ -5.08 Lacs (PSBs ₹ -0.51 Lacs) and ultimately to the net profit of the bank decreased to ₹ -1094 Crores.
This all reflects bad impact of NPA on workings of Oriental Bank of Commerce. 1.14: Impact of NPA on Punjab National Bank (2015-16 to 2016-17) [13] Table-2B & 3B represents various performance indicators as below:
Performance of the bank was much comfortable in comparison to other public sector banks’ as it was successful to contain the NPA at desired levels. However, the bank had gross
NPA (%) during 12.53% and it was higher than PSBs average of 12.32% similarly Net NPA (%) during this period was as 7.81% which was higher than PSBs average of 7.7% during 2016-17.
During this period net interest income was decreased by -0.31% (PSBs -7.42%), net interest income (%) was decreased by -0.95% (PSBs -0.85%), credit-deposit ratio (%) was decreased by -7.08% (PSBs -3.31%), net interest margin (%) was decreased by -0.22% (PSBs -0.06%) and Yield average on advances (%) was decreased by -0.81% (PSBs -0.74%). This all reflects bad impact of NPA on workings of Punjab National Bank.
1.15: Impact of NPA on Syndicate Bank (2015-16 to 2016-17) [14] Table-2B & 3B represents various performance indicators as below:
Table elaborates that quality of assets have been deteriorated in the bank during this period. Total assets had declined by -2.88% (PSBs 13.17%), when Doubtful-1 assets increased by 68.65% (PSBs 34.87%), Doubtful-2 assets increased by 67.1% (PSBs 73.84%), Doubtful-3 assets increased by 137% (PSBs 86.77.
Accordingly, the position of NPA had become more drastic as Gross NPA increased by 27.3% (PSBs 20.02%), Gross NPA (%) increased by 1.8% (PSBs 2.81%), Net NPA increased by 15.48% (PSBs 17.79%), Net NPA (%) increased by 0.73% (PSBs 1.62%).
1.15%), total deposits was decreased by -0.44% (PSBs 8.35%), Net interest income decreased by –0.83% (PSBs -7.42%), Net interest income (%) decreased by -0.32% (PSBs -0.85%), Yield average on advances (%) decreased by -0.29% (PSBs -0.74%).
Overall due to such negative impacts, the bank had earned a net profit of ₹ 359 Crores
and keeping in view such a large total business, this net profit is not desirable. This all reflects bad impact of NPA on workings of Syndicate Bank.
1.16: Impact of NPA on Union Bank of India (2015-16 to 2016-17) [15] Table-2B & 3B represents various performance indicators as below:
Table elaborates that quality of assets have been deteriorated in the bank during this period. Doubtful-1 assets increased by 532% (PSBs 34.87%), and Loss assets increased by 563% (PSBs 13.87%).
Accordingly, the position of NPA had become more drastic as Gross NPA increased by 39.47% (PSBs 20.02%), Gross NPA (%) increased by 2.47% (PSBs 2.81%), Net NPA increased by 34.27% (PSBs 17.79%), Net NPA (%) increased by 1.32% (PSBs 1.62%), similarly provisions for NPA has been increased by 29.55% (PSBs 6.48%).
This all hampered the overall working of the bank as Credit-Deposit ratio (%) decreased by 2.24% (PSBs 3.31%), Net interest income (%) decreased by 0.77% (PSBs -0.85%), Net interest margin (%) by -0.09% (PSBs -0.06%), Yield average on advances (%) decreased by -0.91% (PSBs -0.74%), Average return on assets (%) decreased by -3.98% (PSBs -0.15%).
Overall due to such negative impacts, the bank had earned a net profit of ₹ 555 Crores
and keeping in view such a large total business, this net profit is not desirable. This all reflects bad impact of NPA on workings of the Union Bank of India.
1.17: Impact of NPA on Punjab and Sind Bank (2015-16 to 2016-17) [16] Table-2B & 3B represents various performance indicators as below:
Table elaborates that quality of assets have been deteriorated in the bank during this period. Total assets had declined by -5.78% (PSBs 13.17%), when substandard assets increased by 43.13% (PSBs 0.87%), Doubtful-1 assets increased by 42.45% (PSBs 34.87%), Doubtful-2 assets increased by 69.42% (PSBs 73.84%), Doubtful-3 assets increased by 26.62% (PSBs 86.77%) and Loss assets increased by 1456% (PSBs 13.87%).
This all hampered the overall working of the bank as total business of the bank had decreased by -6.85% (PSBs 4.18%), per employee business was decreased by -5.3% (PSBs 1.15%), total deposits was decreased by -6.25% (PSBs 8.35%), gross advances was decreased by -7.68% (PSBs -4.15%), Credit-Deposit ratio (%) decreased by -2.65% (PSBs -3.31%), gross advances was decreased by 7.68% (PSBs 4.15%), total income was decreased by -5.11% (PSBs 4.96%), Net interest income decreased by -6.54% (PSBs -7.42%), Net interest income (%) decreased by -0.74% (PSBs -0.85%), Yield average on advances (%) decreased by 0.97% (PSBs 0.74%), Average return on assets (%) decreased by 0.14% (PSBs -0.15%).
Overall due to such negative impacts, cost to income ratio (%) had increased as 2.47% (PSBs -0.53%), operating profit of the bank decreased by -2.2% (PSBs 18.05%). However, the bank earned per employee profit as ₹ 2.0 Lacs (PSBs ₹ -0.51 Lacs) and ultimately to the net profit as ₹ 201 Crores but keeping in view such a large total business, this net profit is not
desirable. This all reflects bad impact of NPA on workings of the Punjab and Sind Bank. 1.18: Impact of NPA on Uco Bank (2015-16 to 2016-17) [17]
Table-2B & 3B represents various performance indicators as below:
Table elaborates that quality of assets have been deteriorated in the bank during this period. Doubtful-2 assets increased by 24.46% (PSBs 73.84%), Doubtful-3 assets increased by 229.57% (PSBs 86.77%) and Loss assets increased by 29.6% (PSBs 13.87%).
Accordingly, the position of NPA had become more drastic as Gross NPA increased by 7.81% (PSBs 20.02%), Gross NPA (%) increased by 1.69% (PSBs 2.81%). It’s a point to note that the bank was having the quite high level of NPA during the period. Gross NPA (%) was noted as 17.12% in comparison to PSBs average of 12.32% similarly Net NPA (%) was noted as 8.94% in comparison to PSBs average of 7.7%.
Overall due to such negative impacts, cost to income ratio (%) had increased as 3.48% (PSBs -0.53%), operating profit of the bank decreased by -18.78% (PSBs 18.05%). Ultimately, the bank earned a net loss of ₹ -1851 Crores and this is never desirable. This all
reflects bad impact of NPA on workings of the Uco Bank.
1.19: Impact of NPA on IDBI Bank Limited (2015-16 to 2016-17) [18] Table-2B & 3B represents various performance indicators as below:
Table elaborates that quality of assets have been deteriorated in the bank during this period. Total assets was declined by -3.62% (PSBs 4.18%), substandard assets was increased by 310.49% (PSBs 0.87%), and Doubtful-1 assets was increased by 93.02% (PSBs 34.87%).
Accordingly, the position of NPA had become more drastic as Gross NPA increased by 79.9% (PSBs 20.02%), Gross NPA (%) increased by 9.04% (PSBs 2.81%). Net NPA was increased by 72.13% (PSBs 17.79%), Net NPA (%) was increased by 6.43% (PSBs 1.62%), and provisions for NPA was increased by 66.85% (PSBs 6.48%).
It’s a point to note that the bank was having the quite high level of NPA during the
period. Gross NPA (%) was noted as 19.11% in comparison to PSBs average of 12.32% similarly Net NPA (%) was noted as 13.21% in comparison to PSBs average of 7.7%.
This all hampered the overall working of the bank as total business of the bank had decreased by -4.61% (PSBs 4.18%), per employee business was decreased by -6.87% (PSBs 1.15%), gross advances was decreased by -11.61% (PSBs -4.15%), Credit-Deposit ratio (%) decreased by -4.6% (PSBs -3.31%), capital adequacy ratio (%) was decreased by -0.97% (PSBs 0.37%), Net interest income decreased by -0.89% (PSBs -7.42%), Net interest income (%) decreased by -0.94% (PSBs -0.85%), Net interest margin (%) was decreased by -0.26% (PSBs -0.06%).
Overall due to such negative impacts, cost to income ratio (%) had increased as 9.42% (PSBs -0.53%), total expenses was increased by 4.2% (PSBs 2.46%), operating profit of the bank decreased by -14.74% (PSBs 18.05%). Ultimately, the bank earned per employee loss as ₹ -28 lacs (PSBs -0.51 lacs) and a net loss of ₹ -5158 crores and this is never desirable.
This all reflects bad impact of NPA on workings of the IDBI Bank Limited. 1.20: Impact of NPA on United Bank of India (2015-16 to 2016-17) [19] Table-2B & 3B represents various performance indicators as below:
Accordingly, the position of NPA had become more drastic as Gross NPA increased by 15.63% (PSBs 20.02%), Gross NPA (%) increased by 2.27% (PSBs 2.81%). Net NPA was increased by 7.88% (PSBs 17.79%), Net NPA (%) was increased by 0.98% (PSBs 1.62%), and provisions for NPA was increased by 236.09% (PSBs 6.48%).
This all hampered the overall working of the bank as gross advances was decreased by -1.27% (PSBs -4.15%), Credit-Deposit ratio (%) decreased by -4.32% (PSBs -3.31%), total income was decreased by 4.38% (PSBs 4.96%), Net interest income decreased by -4.31% (PSBs -7.42%), Net interest income (%) decreased by -0.91% (PSBs -0.85%), Net interest margin (%) was decreased by -0.41% (PSBs -0.06%), Yield average of advances (%) was decreased by -0.98% (PSBs -0.74%).
Overall due to such negative impacts, total expenses was increased by 6.18% (PSBs 2.46%), operating profit of the bank decreased by -14.3% (PSBs 18.05%). Ultimately, the bank earned per employee profit as ₹ 10.38 lacs (PSBs -0.51 lacs) and a net profit of ₹ 219
crores. This all reflects bad impact of NPA on workings of the United Bank of India. 1.21: Impact of NPA on Vijya Bank (2015-16 to 2016-17) [20]
Table-2B & 3B represents various performance indicators as below:
Table elaborates that quality of assets have been deteriorated in the bank during this period. Doubtful-1 assets was increased by 111.96% (PSBs 34.87%), Doubtful-2 assets increased by 21.23% (PSBs 73.84%), Doubtful-3 assets increased by 20.98% (PSBs 86.77%) and Loss assets increased by 157.14% (PSBs 13.87%).
Accordingly, the Gross NPA increased by 5.89% (PSBs 20.02%), Gross NPA (%) increased by 0.05% (PSBs 2.81%) and provisions for NPA was increased by 6.78% (PSBs 6.48%).
This all hampered the overall working of the bank as Net interest income (%) decreased by 0.63% (PSBs 0.85%), Yield average of advances (%) was decreased by -0.63% (PSBs -0.74%).
Overall due to such negative impacts, total expenses was increased by 5.6% (PSBs 2.46%), and the bank earned a net profit of ₹ 750 crores. However, performance of the bank was much better in comparison to other public sector banks’ but keeping in view its huge
Conclusion
Commercial banks’ especially the PSBs in India have heightening contribution to the
development of the economy. The wide-spread branch network, increasing volume of deposits and credit deployment have significant contribution to the economy. However, the mounting pressure of NPA on workings of banks’ has attained an alarming position since last
two decades. The NPA have affected adversely the profitability, liquidity, capital adequacy norms, risk-management strategies, financial performance and working results of banks’, especially to the PSBs in the country. Banking Reforms in two phases have suggested guidelines for improvement of the situations. The RBI have taken serious steps in this matter and directed to banks’ to improve the situation of NPA in their workings and keep their
operational efficiency at par with the international standards.
Acknowledgements
Authors are thankful to Shri Rajeev Kumar Das (Assistant General Manager to State Level Bankers Committee, Bihar) for providing all the necessary and updated data regarding Non-performing Assets and performance indicators of SBI & other public sector banks’. We are
also thankful to Prof. B.B.L. Das (Head of the University Department of Commerce & Business Administration, Lalit Narayan Mithila University, Darbhanga) for his everlasting kind co-operation.
References
1. Ahmad, Z., Jegadeeshwaran, M. (2013). “Comparative Study on NPA Management of Nationalized Banks”. International Journal of Marketing, Financial Services and Management Research, 2 (8): 66-78.
2. Aravanan, S. and Vijayakumar, N. (2007). Impact of NPAs on Performance of Banks. Indian Economic Panorama, Vol.17, No. 3, pp.18-21.
3. Arora, N. and Ostwal, N. (2014). “Unearthing the Epidemic of Non-Performing Assets: A Study of Public and Private Sector Banks”. SMS Varanasi, Vol. X, No. 1.
4. Basu, P. (2005). How distress is India’s Banking System? India’s Financial Sector- Recent Reforms, Future Challenges. First Edition (Reprint), McMillan India Limited. 5. Chakrabarti, R. (2006). Banking in India – Reforms and Reorganization. United Nations
6. Dash, M.K. and Kabra, G. (2010). The Determinants of Non-Performing Assets in Indian Commercial Bank: An Econometric Study. Middle Eastern Finance and Economics, Issue 7 (2010).
7. Faizanuddin, Md. and Mishra, R.K. (2011). Non-Performing Assets in Indian Banks, First Edition, APH Publishing Corporation, New Delhi.
8. Gopalakrishnan, T.V. (2004). Management of Non Performing Advances – A Study with reference to Public Sector Banks. Northern Book Centre Publications.
9. Joshi, Vijay and Little I.M.D. (1996). India’s Economic Reforms (1999-2000), Oxford University Press, New Delhi.
10.Kavitha N.A. and Muthumeenakshi, M. (2016). “A Comparative Study of Non- Performing Assets of Public and Private Sector Banks”. IJMTST, 2 (3): 37-40.
11.Naidu, B.R. and Naidu, A.P.S. (2004). Impact of Non-Performing Assets on the Profitability of Public Sector banks. Paper presented in UGC funded National Seminar on Non-Performing Assets, Department of Commerce, Sri Venkateswara University, Tirupathy.
12.Prasad, V.B. and Veena, D. (2011). NPAs Reduction Strategies for Commercial Banks in India. International Journal of Management & Business Studies, 1 (3):47-53.
13.Rajeev, R. (2008). Asset as Liability: NPAs in the Commercial Banks of India, South Asia Network of Research Institutes.
14.RBI. Annual Reports of the Reserve Bank of India (2007-17). https://rbi.org.in (accessed 10-12 June 2017).
15.RBI. Report on the Trend and progress of Banking in India (2007-17). https://rbi.org.in (accessed 10-12 June 2017).
16.Satpal, (2014). “A Comparative study of Non-Performing Assets in Public and Private Sector Banks in the New Age of Technology”. International Journal of Current
Engineering and Technology, pp. 2468-2475.
17.Shiralashetu and Akash (2006). Management of Non-Performing Assets in Commercial Banks- Some Issues, Journal on Banking and Finance, February 2006, pp 14-16.
18.Singh, V.R. (2016). “A Study of Non-Performing Assets of Commercial Banks and it’s recovery in India”. Annual Research Journal of Symbiosis Centre for Management
Studies, Vol. 4, pp.110-125.
20.Siraj, K.K. and Pillai, P.S. (2012). Management of NPAs in Indian SCBs: Effectiveness of SARFAESI Act, DRT & Lok Adalat during 2004-2011. International Journal for Business and Management Tomorrow, Vol.2, No. 4.
21.Vallabh, G., Bhatia, A. and Mishra, S. (2007). Non-Performing Assets of Indian Public, Private and Foreign Sector Banks: An Empirical Assessment, ICFAI Journal of Bank Management, 6 (3):7-28.
22.Yadav, M.S. (2011). Impact of Non-Performing Assets on Profitability and Productivity of Public Sector Banks in India. AFBE Journal, Vol. 4, No. 1.
Reports
1. Annual Report of the Allahabad Bank (2015-17). 2. Annual Report of the Andhra Bank (2015-17). 3. Annual Report of the Bank of Baroda (2015-17). 4. Annual Report of the Bank of India (2015-17).
5. Annual Report of the Bank of Maharashtra (2015-17). 6. Annual Report of the Canara Bank (2015-17).
7. Annual Report of the Central Bank of India (2015-17). 8. Annual Report of the Corporation Bank (2015-17). 9. Annual Report of the Dena Bank (2015-17). 10.Annual Report of the Indian Bank (2015-17).
11.Annual Report of the Indian Overseas Bank (2015-17). 12.Annual Report of the Oriental Bank of Commerce (2015-17). 13.Annual Report of the Punjab National Bank (2015-17). 14.Annual Report of the Syndicate Bank (2015-17). 15.Annual Report of the Union Bank of India (2015-17). 16.Annual Report of the Punjab and Sind Bank (2015-17). 17.Annual Report of the Uco Bank (2015-17).