RISK, RETURN AND VOLATILITY OF INDIAN FMCG EQUITIES:
AN EXPERIENCE OF GST IMPLEMENTATION
Dr. K. Ramesh
UGC-NET-JRF, Assistant Professor, Accounting and Finance, Khammam Institute of Technology and Sciences, Khammam, Telangana, India;
ABSTRACT
Goods and Services Tax (GST) plays a vital role in encouraging the economy of the country
positively. It provides a simple tax structure instead of a complexity of more than 15 indirect
taxes. FMCG Sector influenced by several new tax regime in India due to changing the slab
rates from existed 23 – 25% to 18%. The present study gives the solutions to those who are going
to invest in FMCG Sector regarding GST implementation. So, the present paper analyzed the one
month period of pre and post implementation day (July 1st, 2017), i.e., from June – 2017 to July
– 2017. This paper is trying to expose the Risk, Return and Volatility of the six equities
(Britannia, Godrej, Colgate, Dabur, HUL and ITC) for five years period, which segregated to 1
month, six months, one year, 2 years, 3 years, 4 years and 5 years respectively. The paper
concluded that Britannia (5.88%), Dabur (5.08%) and HUL (5.28%) gave positive returns.
Colgate (-4.75%) and ITC (-16.72%) given negative returns. ITC is the high-risk stock in June
(6.13%) and July (14.21%). All equities have a greater risk than NSE Nifty 50. Dabur has the
lowest risk in June (3.57%) and July (3.91%). ITC is the high beta stock in June (1.22) and in
July (4.88). ), benchmark NSE Nifty 50; Negative beta values for Dabur (-0.16) in June, NSE
Nifty 50; Britannia (-0.36), Colgate (-0.51) and HUL (-0.46) in July, the benchmark is NSE
FMCG.
International Research Journal of Management and Commerce ISSN: (2348-9766) Impact Factor- 5.564, Volume 4, Issue 8, August 2017
Website- www.aarf.asia, Email : editor@aarf.asia , editoraarf@gmail.com
KEYWORDS: Risk, Return, Volatility, GST, NSE Nifty 50 and NSE FMCG Index
1. Introduction
Goods and Services Tax (GST)which is likely to play a vital role in boosting the growth of the
Indian Economy, which is the third largest in Asia. The GST rates for 1,211 products do not
show any major deviation from the current effective tax rates except in the case of few consumer
products in which the council tried to minimize inflationary impact. The single tax replaces 17
indirect tax levies which improve the tax efficiency. Most of the goods are placed under four
slabs, i.e., 5, 12, 18 and 28. The slab „0‟is meant for exempted from the taxation and the slab
„3‟covers particularly gold related aspects. Some of the products are excluded from the GST like
petroleum and beverages due to the decision is pending whether these products to be included or
not.
Indian economy is the fastest growing one in 2017, which may declare 7.1% in 2016-17
from 7.6% the previous year. The reason for decreasing is an industrial slowdown and the
demonetization effect. ICRA believes that the focus on digital transactions and the introduction
of Goods and Services Tax (GST) will likely to reduce the competitiveness of the unorganized
sector. So, the healthy atmosphere will rise in the related sectors. The government is trying to
achieve its fiscal deficit with the target of 3.5% of the Gross Domestic Product (GDP) for the
year ending March 2017. The Consumer Price Index (CPI) inflation, the rate has reduced to 4.5%
in 2017, where as it is 4.9% in 2016 due to the monsoon reports, impact of GST on goods and
services, commodity price movements and rupee-dollar exchange rate.
GST Rate Structure in India as on 31st, July 2017 Tax
Rates
Products
0% Milk Kajal
Eggs Educations Services
Curd Health Services
Lassi Children‟s Drawing & Colouring Books
Unpacked Foodgrains Unbranded Atta
Gur Besan
Unbranded Natural
Honey
Prasad
Fresh Vegetables Palmyra Jaggery
Salt Phool Bhari Jhadoo
5% Sugar Packed Paneer
Tea Coal
Edible Oils Raisin
Domestic LPG Roasted Coffee Beans
PDS Kerosene Skimmed Milk Powder
Cashew Nuts Footwear (< Rs.500)
Milk Food for Babies Apparels (< Rs.1000)
Fabric Coir Mats, Matting & Floor Covering
Spices Agarbatti
Coal Mishti/Mithai (Indian Sweets)
Lifesaving drugs Coffee (except instant)
12% Butter Computers
Ghee Processed food
Almonds Mobiles
Fruit Juice Preparations of Vegetables, Fruits, Nuts or
other parts of Plants including Pickle
Murabba, Chutney, Jam, Jelly
Packed Coconut Water Umbrella
18% Hair Oil Capital goods
Toothpaste Industrial Intermediaries
Soap Ice-cream
Pasta Toiletries
Corn Flakes Computers
Soups Printers
28% Small cars (+1% or 3%
cess)
Consumer durables
such as AC and fridge
Beedis not included
Luxury & sin items like BMWs, cigarettes
and aerated drinks (+15% cess)
Source: https://cleartax.in/s/gst-rates
Indian economy is the fastest growing one in 2017, which may declare 7.1% in 2016-17
from 7.6% the previous year. The reason for decreasing is an industrial slowdown and the
demonetization effect. ICRA believes that the focus on digital transactions and the introduction
of Goods and Services Tax (GST) will likely to reduce the competitiveness of the unorganized
sector. So, the healthy atmosphere will rise in the organised sectors. The government is trying to
achieve its fiscal deficit with the target of 3.5% of the Gross Domestic Product (GDP) for the
year ending March 2017. The Consumer Price Index (CPI) inflation, the rate has reduced to 4.5%
in 2017, where as it is 4.9% in 2016 due to the monsoon reports, impact of GST on goods and
services, commodity price movements and rupee-dollar exchange rate.
The sectors like FMCG, Pharma and Healthcare, Consumer Durables, Airlines, Brokers
and Equity Investments, Cement, Telecom, Automobiles and auto ancillaries; and Real Estate
profoundly influenced by the implementation of Goods and Services Tax (GST) due to variations
in the tax slabs. But, the FMCG and Dairy Industry get more benefit from the GST.
Chart No. 1: Indices Chart for the 3 months period (1st May 2017 to 31st July 2017)
Source: www.finalaya.com
NSE FMCG
The above chart 1 indicates the benchmarks NSE Nifty 50 and NSE FMCG Index. The
benchmark NSE FMCG shows more volatile than that of the NSE Nifty 50 for the period June –
July 2017.
2. Literature Review
i) GST Related Studies
Agogo Mawuli (2014) concluded that GST is not suitable for low-income countries, it does not
provide broad based growth to developing countries by studying “Goods and Service Tax-An
Appraisal.” The rate of the GST should be less than 10% of the growth if country is
implementing necessarily the new tax regime.
Pinki, Supriya Kamma and Richa Verma (2014), in their study, “Goods and Services Tax –
Panacea for Indirect Tax System in India” concluded that the NDA Government is very positive
towards the GST implementation and it would be very beneficiary to Central, State Governments
and ultimate consumers in the long run.
Nitin Kumar (2014) studied “Goods and Services Tax – A Way Forward”, concluded that this
GST is very useful for India to remove the economic distortion and expected familiar tax
structure, which is unbiased one without geographical variations.
Dr. R. Vasanthagopal (2011) studied the role of GST in India and concluded that switching to
GST from current Indirect Tax System will be a positive step for growing economy of the
country. The success of GST will lead to its acceptance by more than 130 countries in the world
and will be a new tax regime in Asia also.
Ehtisham Ahmed and Satya Poddar (2009) explored that GST introduction will provide a
simpler and transparent tax system, which helps in increasing the productivity of economy in
India in their study “Goods and Service Tax Reforms and Intergovernmental Consideration in India”.
ii) Risk, Return and Volatility Related Studies
Kalava Ramesh (2017) observed Risk (), Return and Volatility (β) of the selected funds along
fund schemes and he concluded that majority of schemes are highly volatile when compared with
the respective benchmarks.
A.K.Dubey (2014) observed the results that the betas are more or less instable for various stocks
at various investment horizons. The study revealed that the time scale dependent estimates of
systematic risk involved in various stocks and the tools used in the present study would provide
the practitioners while their portfolio planning.
Harish S.N. and T.Mallikarjunapa (2014) studied 14 years stock data to test the stability of
Beta values by constructing three portfolios. Finally, they concluded that the impact of individual
stocks was very high so that the stability of beta on the portfolio was adverse.
Murthy Jogalapuram (2012) found that among the various return interval periods, half year
return shows low risk and high return.
Balakrishnan & Rekha Gupta (2012) showed that most of the portfolio betas were not
regressed to the value one and also they proved the individual securities beta and portfolio betas
are not related to each other.
Soumya Guhadeb & Sagarika Misra (2011) found that there was evidence of instability of
betas especially in the shorter period and the instability was reduced when the beta estimation
period increased. In addition to that, the extreme betas showed the higher stability than the
intermediate range of betas.
Gupta (1981) found share price data between the periods of 1960-76, a total 606 equity shares
for one or more holding periods were taken into consideration, from Bombay, Calcutta and
Madras Stock Exchanges. The long term rates on equities were found to be less than that of
company deposits, debentures, long term bank deposits and preference shares indicating that
equities providing a hedge against inflation were considered to be redundant and the study posed
a question of doubt about the validity of CAPM in Indian capital market.
Sharpe & Cooper (1972) produced evidence regarding stability concerning individual security
betas by way of taking US samples from 1931 to 1967 with the help of applying transition matrix
approach and concluded that individual security betas showed stability over the period.
Baesel (1971) showed that the individual security betas were stable on the ground of increasing
the length of the estimation period. He proved that beta stability had shown more improvement
when the estimation period was larger.
Nerlov (1968), found the factors influencing the return of the scrip by taking 800 companies
study such as sales, retained earnings and growth in earnings were regressed with return of the
scrip for witnessing the influence of such factors on the return and it was found that dividend and
leverage had strong influence on market return in long run whereas asset growth, inventory
turnover, cash flows and liquidity did not exert any influence on the return of the scrip. It seemed
that those variables were proved to be redundant.
3. Research Methodology
i) Statement of the Problem
Usually, the stock market is susceptible; the present study focused the impact of GST
implementation on the volatility of FMCG Equities. The high volatility situated during the pre
and post implementation day of GST. FMCG goods are large beneficiary sector among the other
sectors, which influenced by GST regime. Beta values are changing day by day hugely. To
identify the high and low volatility of the respective stocks among the 15 NIFTY 50 index
equities is the main motto of the study along the risk and returns involved in the respective
securities over the period.
ii) Objectives of the Study
To identify the volatility between Index Returns and Selected FMCG Equity Return.
To observe the Risk – Return variations in the Selected FMCG Equities
iii) Research Design
Research Design is the set of methods and procedures used in collecting and analyzing measures
of the variables specified in the research problem statement. The concept of research design
states that a blueprint has to be prepared for obtaining information to conduct the study. This
study is based on objective evidence and supported by theory. The objective evidence was
gathered by studying various literature based on Risk, Return and Volatility; and GST from
secondary sources.
a) Research Strategy
The Research Strategy means the orientation of researching practically. This
particular project adopts the Quantitative Research Strategy. So, the 5 years daily
b) Research Type
Research Type is the method of carrying the project with a specified objectives which provide
information about conditions, situations and events that occur in the present. The current study
follows the Descriptive study.
c) Tools used for Data Analysis
The present study used tools to analyze the secondary data. Mean Returns, Standard Deviation
(σ) and Beta (β). The overview of those above-said tools is explained below briefly.
d) Sample Size
6 companies were chosen for the study namely Britannia Industries Limited, Colgate Palmolive
(India) Limited, Dabur India Limited, Godrej Industries Limited, Hindustan Unilever Limited
and ITC Limited which listed in NSE FMCG Sector out of the 15 companies. Two benchmarks
followed by the particular study namely, NSE Nifty 50 and NSE FMCG Index. So that the
researcher can compare the volatility easily.
e) Sampling Technique
Purposive Sampling technique has been adopted for the study. The selection of equities based on
listed and traded on National Stock Exchange and the availability of the data.
f) Sources of Data
The present study is based on Secondary data analysis only. The data were collected from NSE
official website and the respective company‟s websites.
g) Period of the Study
The period of the study is concentrated majorly at the time of GST Implementation (pre and post
implementation day of the GST), i.e., from June 1st, 2017 to July 31st, 2017. But, beyond the particular the researcher trying to brief about the Risk and Returns along with Price Volatility.
iv) Limitations of the Study
The present study has certain limitations
It covers only six companies listed on NSE
NSE Nifty 50 and NSE FMCG Index haven been taken as the benchmarks
Post implementation period of GST may not be sufficient to predict volatility
The present study under go with the constraint of all factors are constant, other than GST
4. Data Analysis and Interpretation
[image:10.792.80.753.166.369.2]1. Risk Return Analysis
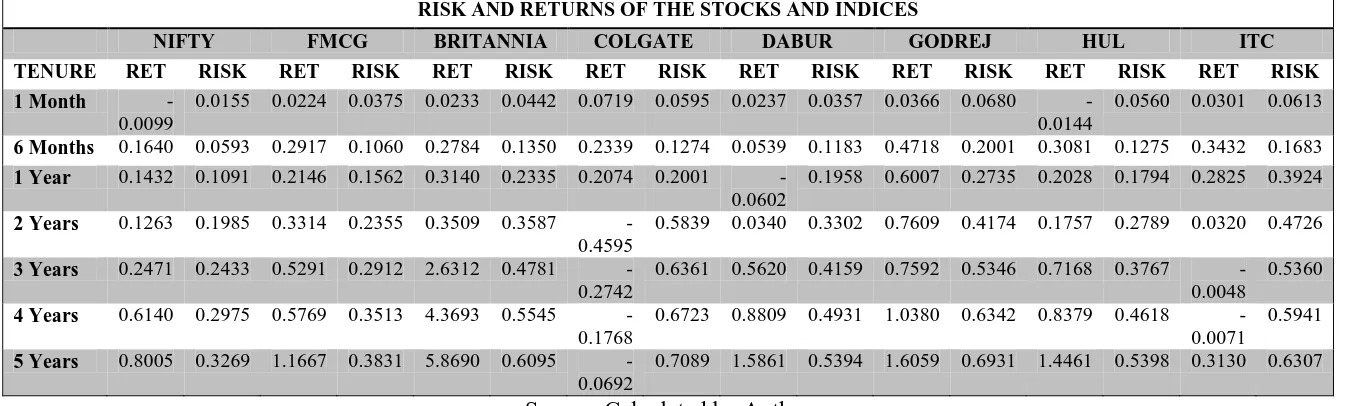
Table No. 1: Risk and Returns – Stocks and Indices
RISK AND RETURNS OF THE STOCKS AND INDICES
NIFTY FMCG BRITANNIA COLGATE DABUR GODREJ HUL ITC
TENURE RET RISK RET RISK RET RISK RET RISK RET RISK RET RISK RET RISK RET RISK
1 Month -0.0099
0.0155 0.0224 0.0375 0.0233 0.0442 0.0719 0.0595 0.0237 0.0357 0.0366 0.0680 -0.0144
0.0560 0.0301 0.0613
6 Months 0.1640 0.0593 0.2917 0.1060 0.2784 0.1350 0.2339 0.1274 0.0539 0.1183 0.4718 0.2001 0.3081 0.1275 0.3432 0.1683
1 Year 0.1432 0.1091 0.2146 0.1562 0.3140 0.2335 0.2074 0.2001 -0.0602
0.1958 0.6007 0.2735 0.2028 0.1794 0.2825 0.3924
2 Years 0.1263 0.1985 0.3314 0.2355 0.3509 0.3587 -0.4595
0.5839 0.0340 0.3302 0.7609 0.4174 0.1757 0.2789 0.0320 0.4726
3 Years 0.2471 0.2433 0.5291 0.2912 2.6312 0.4781 -0.2742
0.6361 0.5620 0.4159 0.7592 0.5346 0.7168 0.3767
-0.0048
0.5360
4 Years 0.6140 0.2975 0.5769 0.3513 4.3693 0.5545 -0.1768
0.6723 0.8809 0.4931 1.0380 0.6342 0.8379 0.4618
-0.0071
0.5941
5 Years 0.8005 0.3269 1.1667 0.3831 5.8690 0.6095 -0.0692
0.7089 1.5861 0.5394 1.6059 0.6931 1.4461 0.5398 0.3130 0.6307
NSE Nifty 50
The NIFTY 50 index is a well-diversified 50 company‟s index reflecting overall market
conditions. NIFTY 50 Index is computed using free float market capitalization method. NIFTY
50 can be used for a variety of purposes such as benchmarking fund portfolios, launching of
index funds, ETFs and structured products.
From the Table No 1, NSE Nifty has the highest return with 80% for 5 years and the
lowest return with 12.63% for 2 years. The risk level is very high for 5 years with 32.69% and
10.91% for 1 year.
NSE FMCG Index
The NIFTY FMCG Index is designed to reflect the behavior and performance of FMCG (Fast
Moving Consumer Goods) which are non-durable, mass consumption products and available off
the shelf. The NIFTY FMCG Index comprises of 15 stocks from FMCG sector listed on the
National Stock Exchange (NSE).
From the Table No. 1, the FMCG Index returns are quite better than the NSE Nifty for
the entire period other than 4 years period. This index has the highest return rate for 5 years
period with 116.67% mean value and the low mean value with 21.46% for 1 year. The risk levels
are also high comparatively with NSE Nifty with highest of 38.31% (5 years) and the lowest of
21.46% (1 year).
Britannia Industries Limited
In the present conditions, the Britannia may play the big role in leading the stock market due to
shifting the tax structure to nearer one, in between 18% and 23%. It also the primary player of
the businesses like Toothpaste, Hair oil & Soaps and Dairy milk related products. From the
Table No. 1, The Britannia has the huge returns in FMCG sector among all companies. This
company provided 586.90% spectacular returns from the past 5 years, which is in boom ever for
the respective study period followed by 31.40% lowest mean returns from the last year. Risk
levels are also very high for the last 5 years period with 60.95% when compared to the
Colgate Palmolive (India) Limited
The clear benefits would be taken for the products of cigarettes, toothpaste and soaps. The
present company is the market player in the above-mentioned consumer goods like toothpaste
and soaps. The present slab (25-26%) may change to 18% slab rate, so that it can be more
benefited from the implementation of GST. Apart from the above mentioned companies, from
the Table No. 1, the Colgate Company did not get more profits, Contrary; this company provided
negative returns for the whole period except from past 1 year. The risk levels are very high. So,
in fact, 70.89% is the highest risk involved for the past 5 years period.
Dabur India Limited
The majority of the soaps and hair oil segment will come under the slab rate of 18%,
comparatively with the present tax rates in between 26% and 28%. The most beneficiary product
from this company is „honey, which is under exempted category. As we observe from the Table
No. 1, The Dabur gives the positive returns from the past 5 years with the 158.61% mean returns
except the past year. Moreover, it has given negative returns from the past year with 6.02%. The
highest risk level is with the percentage of 53.94%.
Godrej Industries Limited
The company has reported positive returns in the present Quarter April 1st to June 30th, 2017. The main reason behind this would be the Consumer and Chemicals businesses. The GST
implementation will enhance the momentum of stock for a while due to the better economic
environment and consumer demand. Table No.1 indicates that this company has given positive
returns for the entire period. 160.05% returns gained by the company from the past 5 years,
where as 60.07% returns gained by the company with the lowest returns for the last 1 year
period. The risk levels are also high for the entire period, especially 69.31% from the past 5
years.
Hindustan Unilever Limited
HUL is expected to gain market share with the implementation of GST as business is going to
shift from unorganized sector to organized sector. The slab rate will be under 18% and the major
benefits from the implementation of GST due to Innovative Pipeline, Portfolio of Brands, Robust
Distribution Network and the Government encouragement with the intension of enhancing the
rural economy. In the long run, the present company HUL also gave positive returns, especially
with the 144.61%. But, the company performed lower returns from past 2 years, i.e., 15.57%.
The return for the present year 2016-17 is 20.28% from the Table No. 1. The risk levels are also
somewhat moderate when compared with the rest of the companies in FMCG Sector.
ITC Limited
The anxiety of the new tax regime and its implications may show a positive impact on this stock
for a while. Some of the factors like lower incidences of taxes, leadership position in cigarette
category, efforts in building the brand by investing and innovations in FMCG Sector, which
contribute the stock‟s performance. Surprisingly from the Table No. 1, the ITC Company has not
given expected returns; it performed 31.30% returns for the past 5 years, which is the lowest
return for the entire study. For the period of 3 and 4 years, the returns are negatively responded.
The risk level is also high in this particular equity, with the 63.07% for the 5 years period.
[image:13.612.68.549.409.585.2]2. Beta Analysis
Table No. 2: Volatility of the Stocks – NSE Nifty 50 and NSE FMCG Indices
BETA VALUES OF THE STOCKS – BENCHMARKS ARE NIFTY AND FMCG INDICES
BRITANNIA COLGATE DABUR GODREJ HUL ITC
TENU RE NIFT Y FMC G NIFT Y FMC G NIFT Y FMC G NIFT Y FMC G NIFT Y FMC G NIFT Y FMC G 1 Month
0.947 0.615 0.565 0.659
-0.167
0.417 2.366 0.438 0.259 0.287 1.230 1.486
6 Months
0.744 0.465 0.212 0.291 0.503 0.380 0.903 0.219 0.731 0.509 0.996 1.503
1 Year 0.907 0.591 0.490 0.415 0.670 0.561 1.057 0.488 0.600 0.577 0.851 1.151
2 Years 0.763 0.603 0.384 0.358 0.626 0.627 1.098 0.634 0.562 0.627 0.843 1.266 3 Years 0.688 0.559 0.456 0.406 0.606 0.600 1.197 0.625 0.531 0.625 0.790 1.295
4 Years 0.577 0.497 0.438 0.442 0.549 0.606 1.124 0.577 0.573 0.707 0.801 1.278 5 Years 0.545 0.456 0.416 0.426 0.518 0.575 1.070 0.550 0.541 0.763 0.781 1.270
Source: Calculated by Author
From the Table No. 2, the beta values for five years, followed benchmarks are NSE Nifty
50 and NSE FMCG are as follows: Britannia Industries Limited 0.545 and 0.456, Colgate
Industries Limited 1.070 and 0.550, Hindustan Unilever Limited 0.541 and 0.763; and ITC
Limited 0.781 and 1.270.
Beta between 0 and 1 – companies with volatilities lower than the market have a beta
value of less than 1 (but more than 0). Usually, the benchmark‟s volatility will be the 1, in this
present paper the author compared with two benchmarks, namely, NSE Nifty 50 and NSE
FMCG. Almost all of the companies fall under this category, other than Godrej and ITC.
Negative beta (less than 0) which would indicate an inverse relationship to the respective
benchmark. Dabur Company has the negative beta values for the 1 month period. That means,
the particular stock reflects negatively when comparing to the NSE Nifty 50 and NSE FMCG
Index.
Beta values more than 1 will be the high volatility stocks. The present paper identified
highest beta values for Godrej Equity comparing with NSE Nifty 50 and ITC Ltd comparing
with NSE FMCG Index.
3. Risk, Return and Volatility – June 1st, 2017 to July 31st, 2017
Table No. 3: Risk, Return and Volatility of the Stocks/ Indices for the Period June – July,
2017
STOCK/ INDEX
RETURNS RISK BETA
NIFTY FMCG
JUNE JULY JUNE JULY JUNE JULY JUNE JULY NIFTY -0.0099 0.0481 0.0155 0.0196
FMCG INDEX 0.0224 -0.0735 0.0375 0.0771
BRITANNIA 0.0233 0.0588 0.0442 0.0322 0.9469 0.1302 0.6151 -0.0361
COLGATE 0.0719 -0.0475 0.0595 0.0318 0.5645 0.4862 0.6593 -0.0514
DABUR 0.0237 0.0508 0.0357 0.0391 -0.1666 0.7599 0.4170 0.1916
GODREJ 0.0366 0.0265 0.0680 0.0484 2.3662 0.1434 0.4381 0.0770
HUL -0.0144 0.0528 0.0560 0.0382 0.2588 0.1776 0.2870 -0.0468
ITC 0.0301 -0.1672 0.0613 0.1421 1.2298 4.8875 1.4864 1.8303
Source: Calculated by Author
From the Table No.3; Risk, Return and Volatility of the stocks and indices are explained
for June and July, 2017 due to a comparison of values pre and post GST implementation day.
NSE Nifty returns are somewhat better in July, where as in June it is outperformed negatively.
[image:14.612.97.515.397.575.2]negatively. Positive and high returns in July for particular stocks like Britannia, Dabur, Godrej
and HUL. But two stocks Colgate and ITC are given negative returns for the month of July,
2017. All of the six companies outperformed the benchmark returns both NSE Nifty and NSE
FMCG Index in June month, other than HUL (NSE FMCG Index). Three companies Britannia,
Dabur and HUL have outperformed the benchmark NSE Nifty Index in July month, whereas,
Colgate and ITC are negatively reacted; and Godrej has given low returns. But, Britannia, Dabur,
Godrej and HUL are outperformed the NSE FMCG Index in July; Colgate and ITC are
negatively higher than the NSE FMCG Index.
Risk levels are high for all the stocks in June than the benchmark NSE Nifty 50, whereas,
only Dabur has the lowest risk comparing with the NSE FMCG; All six companies have
high-risk levels when comparing with NSE Nifty 50 in June and Dabur and ITC have the high-high-risk
values when comparing with NSE FMCG Index in July month, rest of the companies are
low-risk values.
Beta values are more than 1 for Godrej and ITC, means these are high volatile stocks
when compared with the Nifty in June and Britannia is also nearer to 1 (0.9469); Colgate and
HUL are low volatile stocks in June. Dabur has responded negatively, means of adverse reaction
to particular benchmark NSE Nifty 50. Whereas ITC has the more volatile stock ever in July
when compared with NSE Nifty 50, rest of the stock‟s volatility is positive.
ITC is more volatile when comparing the NSE FMCG Index in both the months June and
July. Britannia and Colgate are more volatile than that of Dabur, Godrej and ITC in June;
Britannia, Colgate and HUL are responded negatively to the NSE FMCG Index; whereas Daur
and Godrej are little volatile in July month.
5. Conclusion
GST in India will play a vital role in enhancing the economic growth of the country. The
majority of the sectors and companies are getting benefits due to the implementation of GST.
Risk, Return and Volatility of the stocks for the five years period have been studied and
concluding that stocks Britannia (586.90%) gave highest returns ever for every financial year.
Whereas, Colgate (-6.92%) has given negative returns. In terms risk, Colgate (70.89%) has more
risk than the rest of the stocks followed by Godrej and ITC. Godrej (1.070) and ITC (1.27) have
the highest beta values more than 1, compared with NSE Nifty 50 and NSE FMCG Index
Comparing Risk, Return and Volatility for pre and post implementation day of GST is
very interesting NSE Nifty 50 (4.81%) performed positively, NSE FMCG Index (-7.35%)
performed negatively in July, compared with June. Britannia (5.88%), Dabur (5.08%) and HUL
(5.28%) gave positive returns. Colgate (-4.75%) and ITC (-16.72%) given negative returns. ITC
is the high-risk stock in June (6.13%) and July (14.21%). All equities have a greater risk than
NSE Nifty 50. Dabur has the lowest risk in June (3.57%) and July (3.91%). ITC is the high beta
stock in June (1.22) and in July (4.88), benchmark NSE Nifty 50; in June (1.48%) and in July
(1.83), benchmark NSE FMCG Index. Godrej (2.36) also have a high beta value in June. HUL is
the low beta stock for June (0.25) and July (0.17), NSE Nifty 50 benchmark; and June (0.28),
NSE FMCG Index. Negative beta values for Dabur 0.16) in June, NSE Nifty 50; Britannia
(-0.36), Colgate (-0.51) and HUL (-0.46) in July, the benchmark is NSE FMCG.
REFERENCES
1. Azariadis, C., 1981, “Self-Fulfilling Prophecies,” Journal of Economic Theory, 25, 380–396.
2. Mankiw, N. G., D. Romer, and M. Shapiro, 1985, “An Unbiased Reexamination of Stock
Market Volatility,” Journal of Finance, 40, 677–687.
3. Paul, J., 1994, “Information Aggregation without Exogenous „Liquidity‟ Trading,” Working
paper, University of Michigan.
4. Wang, J., 1994, “A Model of Competitive Stock Trading Volume,” Journal of Political
Economy, 11, 127–168. 5. Bhushan, R., D. Brown, and A. Mello, 1997, “Do Noise Traders
„Create Their Own Space‟?” forthcoming in Journal of Financial and Quantitative Analysis.
6. Romer, D., 1993, “Rational Asset-Price Movements without News,” American Economic
Review, 83, 1112– 1130.
7. Knight (F.) (1921): “Risk Uncertainty and Profit” Reprint Chicago, the Chicago University
Press 1971.
8. Schwert (G.) (1989), “Why Does Stock Market Volatility Change over Time?”, Journal of
Finance, volume XLIV, December, p. 1115-1151.
9. Schwert (G.) (1998), “Stock Market Volatility: Ten Years after the Crash”, National Bureau of