AN ALTERNATIVE CLASSIFICATION FOR HUMAN
DEVELOPMENT OF ASIAN COUNTRIES BY USING WARD’S
CLUSTERING ALGORITHM
Tugba Altintas,
Faculty of Business Administration, Istanbul Aydin University, Istanbul, Turkey.
ABSTRACT
In this study, Asian countries have been classified to obtain development clusters
UNDP’s Human Development Index indicators have been used as independent variables. Ward’s clustering algorithm as a hierarchical clustering method has been applied for
classification. The main goal of this research is to compare clusters and memberships of
ward’s method to the development groups based on HDI rankings. In this way, it has been
tested whether cluster memberships of Asian countries changed or not. It has been seen that
some countries could relocate due to the applied clustering algorithm. Then, the study
represents another quantitative choice to classify countries.
Keywords: Welfare and social development, human development index, Ward’s Clustering, development classification, Asian countries.
INTRODUCTION
The Human Development Index (HDI) has been reported in theUnited Nations
DevelopmentProgramme’s (UNDP) Human Development Reports (HDRs) was created in
1990 (Böhringer and Jochem, 2007; Wilsonet al., 2007). The UNDP has published a series of
annual HDRs in which the human development index (HDI) is computed for each country
(Sagar, 1998). Depending on the deficiency of income (GDP) used for measuring human
development, HDI consisting of new indicators as well as income,was created as a new
concept(Aguna, andKovacevic, 2010).The first HDR correctly recognizes that ―development is much more than just the expansion of income and wealth‖ and defines human development as ―the process of enlarging people's choices‖ (UNDP, 1990).Today, the HDI examines three
basic dimensions to determine a country's growth and achievements in human
development.The first is health, which is measured by life expectancy at birth. Those with
dimension measures a country's overall knowledge level via the literacy rate among adults
over 25 years combined with the gross enrolment ratio of students from primary school
through university. The third and final dimension is a country's standard of living, measured
as the gross domestic product per capita in purchasing power parity terms, based on the
United States dollar (Hou et al., 2014).
The breakthrough for the HDI was the creation of a single statistic which was to serve
as a frame of reference for both social and economic development and to allow cross-country
comparison (OPHI, 2011).The HDI was created for each dimension by setting each indicator
on a scale of 0–1 using maximum and minimum scaling values. Since the variables included
in the HDI have different units,scaling and normalization of values are required. Life
expectancy is in years, adult literacy rate is in percentages, and the GDP per capita is in
PPP$. Then, normalization removes the heterogeneity of units by converting them into pure
numbers(Hou et al., 2014).
Starting with the 2010 Human Development Report the HDI combines three
dimensions(UNDP, 2013):
A long and healthy life: Life expectancy at birth
Education index: Mean years of schooling and Expected years of schooling
A decent standard of living: GNI per capita (PPP US$)
1. Life Expectancy Index (LEI) = 𝐿𝐸−20
85−20
2. Education Index (EI)= 𝑀𝑌𝑆𝐼 −𝐸𝑌𝑆𝐼
2
2.1 Mean Years of Schooling Index (MYSI) = 𝑀𝑌𝑆
15
2.2Expected Years of Schooling Index (EYSI) = 𝐸𝑌𝑆
18
3. Income Index(II) = ln 𝐺𝑁𝐼𝑝𝑐 −ln (100)
Finally, the HDI is the geometric mean of the previous three normalized indices:
HDI = 3 𝐿𝐸𝐼 ⋅ 𝐸𝐼 ∙ 𝐼𝐼
LE:Life expectancy at birth, MYS:Mean years of schooling (Years that a 25-year-old person or older has spent
in schools), EYS:Expected years of schooling (Years that a 5-year-old child will spend with his education in his
whole life), GNIpc:Gross national income at purchasing power parity per capita
Based on the above calculation, the Asian countries have been grouped as "very high
human development (HDI=0.900)", "high human development (0.800<=HDI<0.900)",
"medium human development (0.500<=HDI<0.800)", and "low human development
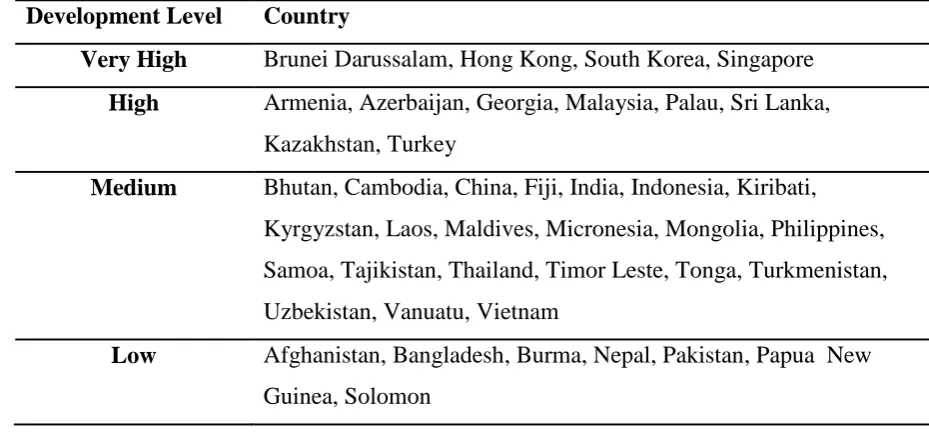
(HDI<0.500)" countries(Ferrer, 2009).Table I shows development classesof Asian countries
[image:3.595.59.524.418.634.2]according to the UNDP 2012 ranking (UNDP, 2012).
Table I. Development Groups of Countries
Development Level Country
Very High Brunei Darussalam, Hong Kong, South Korea, Singapore
High Armenia, Azerbaijan, Georgia, Malaysia, Palau, Sri Lanka, Kazakhstan, Turkey
Medium Bhutan, Cambodia, China, Fiji, India, Indonesia, Kiribati,
Kyrgyzstan, Laos, Maldives, Micronesia, Mongolia, Philippines,
Samoa, Tajikistan, Thailand, Timor Leste, Tonga, Turkmenistan,
Uzbekistan, Vanuatu, Vietnam
Low Afghanistan, Bangladesh, Burma, Nepal, Pakistan, Papua New
Guinea, Solomon
The HDI indicators - life expectancyat birth, mean years of schooling, expected years
of schooling, and GNI per capita-could also be thought as independent variables for some
multivariate statistical methods focused on classification. Since the main goal of this paper is
Clustering Method asa multivariate statistical analysiswas chosen to compare development
groups in terms of memberships.
Similar comparative studies could be found in the literature on human development
index. Aguna,andKovacevicstudied uncertainty and sensitivity of HDI (Aguna, and
Kovacevic, 2010). Guillermo et al. studied on explanation of HD components by using
multivariate statistical analysis (Guillermo et al., 2007). Vázquez, andSumner used cluster
analysis and obtained five development clusters (Vázquez, and Sumner,2012). Vázquez,
andSumneralsousedclusteranalysistobuild a multidimensionaltaxonomy of
developingcountries(Vázquez, andSumner,2013).
MATERIAL AND METHOD
Clustering is a popular techniqueused in manydifferentdisciplinesandthereareseries of
multivariatemethodsthat is usedtofindtruegroups of data. Perhap some of them ostinteresting
features is when unexpected groups are found, as the sereveal some unknown information
about the data. In clustering the object sare grouped so that similar objects fall into the same
class. Objects in one cluster should be homogeneous, with respect to some characteristics
describing the within clusterproperties, and well separated from the elements in other clusters
(Danielsson, 1999).
Ward’s clustering is one of the hierarchical clustering methods. Hierarchical
clustering is a widely used data analysis tool. The idea is to build a binary tree of the data that
successivelymerges similar groups of points. Visualizing this tree provides a useful summary
of the data (Blei, 2008).
Ward's clustering method is also known as the minimum variance method (Hervada
and Jarauta, 2004). It tends produce homogeneous clusters and the clusters are more balanced
in size and tests have shown that Ward’s Methodis good at recovering the cluster structure. In general, Ward’s method almost performs the best in most situations, with the exception of
situations where the data contain one or two very large groups and a few other very small
groups and the method has also the highest accuracy in most situations (Ferreira,
andHitchcock, 2009). Ward's minimum variance technique was superior, in the sense of
giving a larger amount of correct classified observations, to most other methods (Sharma,
1996). Due to these advantages, it has been chosen as a clustering method for counties’
Ward’shierarchicalalgorithm starts with all the data points as a separatecluster. Each
step of thealgorithminvolvesmergingtwoclustersthatarethe most similar. Aftereachmerge, the
total number of clustersdecreasesbyone. Thesesteps can be repeated until the desired number
of clustersis obtainedorthedistancebetweentwoclosestclusters is above a certain threshold
distance(Karypis et al., 1999).
In order for the clusteringalgorithmtowork,the squared Euclidean distance measure
was used, which is one of the most commonly adopted measures (Fovell et al., 1993). It is
also a metric faster than clustering with the regular Euclidean Distance and an efficient tool
for clustering databases(Mouffron et al., 2008).
The squared Euclidean Distance Measure is;
𝑑2 𝑥, 𝑦 = (𝑥
𝑀𝑌𝑆 − 𝑦𝑀𝑌𝑆)2+ (𝑥𝐸𝑌𝑆 − 𝑦𝐸𝑌𝑆)2+ (𝑥𝐺𝑁𝐼 − 𝑦𝐺𝑁𝐼)2+ (𝑥𝐿𝐸− 𝑦𝐿𝐸)2 where:
x =country x; y =country y; MYS = mean years of schooling; EYS = expected years
of schooling; GNI = gross national income; LE = life expectancy.
To determine the number of clusters there are several techniques without
priorknowledge of the number of clusters or any other information about their composition
(Fraley and Adrian, 1998).In this study, number of clusters was taken as four because there
are four categoriesfor development levelsaccording to the HDI. All variables were
standardized as z scoresto eliminatedifferent measuring units. Data for indicators; life
expectancy at birth, mean years of schooling, expected years of schooling and GDP, were
obtained from World Data Bank belong to the year 2012, and attached in Appendix A.
RESULTS AND CONCLUSION
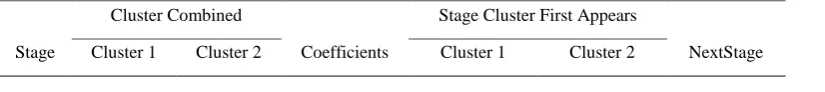
By using Ward’s Clustering Algorithm, four country clusters were obtained.
Agglomeration schedule in Table II and dendrogram in Figure I displaythecasescombined at
eachstage, thedistancesbetweenthecasesbeingcombined, andthelastclusterlevel at which a
[image:5.595.71.484.720.766.2]casejoinedthecluster.
Table II. Agglomeration Schedule
Stage
Cluster Combined
Coefficients
Stage Cluster First Appears
NextStage
1 19 20 ,010 0 0 6
2 15 21 ,027 0 0 10
3 28 29 ,074 0 0 14
4 7 10 ,138 0 0 7
5 24 26 ,228 0 0 15
6 18 19 ,356 0 1 17
7 4 7 ,504 0 4 21
8 13 23 ,654 0 0 25
9 30 32 ,825 0 0 19
10 14 15 ,997 0 2 17
11 9 11 1,197 0 0 16
12 34 37 1,408 0 0 24
13 2 5 1,630 0 0 21
14 27 28 1,878 0 3 28
15 24 31 2,160 5 0 25
16 9 12 2,450 11 0 31
17 14 18 2,763 10 6 26
18 39 40 3,090 0 0 23
19 30 36 3,428 9 0 30
20 3 6 3,801 0 0 32
21 2 4 4,224 13 7 32
22 22 35 4,750 0 0 33
23 38 39 5,284 0 18 34
24 33 34 5,831 0 12 28
25 13 24 6,387 8 15 29
26 14 25 6,963 17 0 36
27 16 17 7,548 0 0 29
28 27 33 8,239 14 24 30
29 13 16 9,250 25 27 38
30 27 30 10,324 28 19 33
31 8 9 11,509 0 16 35
32 2 3 13,898 21 20 35
33 22 27 16,376 22 30 36
34 38 41 19,430 23 0 39
35 2 8 23,880 32 31 37
37 1 2 36,730 0 35 40
38 13 14 47,008 29 36 39
39 13 38 93,720 38 34 40
40 1 13 160,000 37 39 0
The cluster of low human development countries is on the bottomof dendrogramand
their HDI values are within 0.37and 0.58.The cluster of high human development countries is
on the top and their HDI values are within 0.62and 0.79.The cluster of medium development
countries is on the upper middle side and their HDI values are within 0,69 and 0,72. On the
lower middle side very high development countries occurs and their HDI values are within
0.86 and 0.91. It has been thought that the clusters and HD groups include almost same countries. Only a few medium human development countries’ memberships are inconsistent
according to the HDI groups. Clusters and memberships obtained from Ward’s Method have
been listed in Table III.
Table III. Ward’s Cluster Memberships Development Level Country
Very High Brunei Darussalam, Hong Kong, South Korea, Singapore
High Armenia, Azerbaijan, Georgia, Malaysia, Palau, Sri Lanka, Kazakhstan, Fiji, Kiribati, Kyrgyzstan, Micronesia, Mongolia,
Philippines, Samoa, Tajikistan, Tonga, Turkmenistan, Uzbekistan
Medium China, Indonesia, Maldives, Thailand, Vanuatu, Vietnam, Turkey
Low Afghanistan, Bangladesh, Burma, Nepal, Pakistan, Papua New
Guinea, Solomon, Bhutan, Cambodia, India, Laos, Timor Leste
If we compare very high developed countries, HDI list and Ward’s consist of same
countries. Brunei, Hong Kong, Korea, Singapore.
Ward’s Methodconsists more high developed countries than HDI list. These are
additionally Fiji, Kiribati, Kyrgyzstan, Micronesia, Mongolia, Philippines, Samoa,
Tajikistan,Tonga,Turkmenistan andUzbekistanwhich are the medium developed countries in
HDI list.
If we look at themedium developed countries,there arelesscountries in the Ward’s
cluster than HDI list. These are China, Indonesia, Maldives, Thailand, Vanuatu, Vietnam and also Turkey. The Ward’s Clustering Method made change either by relocating from medium
to low or from medium to high. But, only Turkey changed membership from high to medium
between them with 5% level of significance. Then, mean years of schooling in Turkey
issignificantly lower than the high developed countries. This could be the reason why
Turkey’s membership has been changed.
Low developed countries Afghanistan, Bangladesh, Burma, Nepal, Pakistan, Papua,
Solomon are commonfor both Ward’s Method and HDI. But according to the Ward’s,Bhutan,
Cambodia, India, Laos and TimorLesteare clustered in the low developed group.
This paper aimed at studying how would development classes be in case of using cluster analysis instead of UN’s HDI ranking. It was compared thatthe Asian countries’
development groups accordingto HDI distribution to anaturalclassification based on cluster
analysis.The component indicators (variables) without any additional variables were used in the analysis. In order to obtain development groups Ward’s Hierarchical Clustering Analysis
was applied. All variables were standardized as z scores to eliminate the effect of outliers and variables’ different measuring units. The Squared Euclidean Distance Measure waschosen as
a dissimilarity measure. It was found that the classification into four groups is very
stable.Very high developed countries didn’t change, but the low, middle and high
developedcountrieswere regrouped.According to the HDI list, most of the countries were in the medium developed class when Ward’s method separates them relatively in a more
balanced way. That means, geometric mean used for HDI calculation rates all medium developed countries with similar scores, when Ward’s Method move some of them to another
cluster because of the algorithm even if same indicators are used.
Overall, the results have shown that the clustering analysis could also be used as a
robust choice to group countries in terms of HD indicators.In addition, it is hoped that this
study would contribute to the future studies about development and could be of use for both
References
1. Böhringer, C.,Jochem, P.E.P., (2007)Measuringtheimmeasurable—a survey of
sus-tainabilityindices. Ecol. Econ. 63 (1), 1–8.
2. Wilson, J.,Tyedmers, P., Pelot, R.,
(2007)Contrastingandcomparingsustainabledevelopmentindicatormetrics. Ecol.
Indicat. 7 (2), 299–314.
3. Sagar., A.N., (1998) "Thehumandevelopmentindex: a criticalreview."
Ecologicaleconomics, 25.3, p. 249-264.
4. Aguna, C.,Kovacevic M., (2010) "Uncertaintyandsensitivityanalysis of
thehumandevelopmentindex." Human Development ResearchPaper, p.11.
5. UNDP (1990), Human Development Report, United Nations DevelopmentProgramme.
6. Hou, J.,Walsh, P. P., &Zhang, J. (2014)Thedynamics of Human Development Index. TheSocialScienceJournal.
7. OPHI, (2011) http://www.ophi.org.uk/wp-content/uploads/OPHI-RP-29a.pdf?0a8fd7
8. UNDP, (2013) ―Human Development Report 2013, Technical Notes, Retrieved 28
November, 2013
fromhttp://hdr.undp.org/sites/default/files/hdr_2013_en_technotes.pdf
9. Ferrer, E., (2009) "ICT policyandperspectives of humandevelopment in Latin America: thePeruvianexperience." Journal of technologymanagement&innovation4.4,
p. 161-170.
10.UNDP, (2013)Human Development Index (HDI) - 2012 Rankings, Retrieved 14 January, 2014 from http://hdr.undp.org/en/statistics/
11.Guillermo, P.,Cartea, M.E., Ordás, A., (2007) "Comparison of
severalclusteringmethods in grouping kale landraces." Journal of
theAmericanSocietyforHorticulturalScience132.3, p. 387-395.
12.Vázquez, S.T.,Sumner, A., (2012) "Beyond LowandMiddleIncomeCountries:
WhatifThereWereFiveClusters of DevelopingCountries?." IDS WorkingPapers
2012.404, p. 1-40.
13.Vázquez, S.T.,Sumner, A., (2013) "RevisitingtheMeaning of Development: A MultidimensionalTaxonomy of DevelopingCountries." Journal of Development
14.Danielsson, Åsa, et al.(1999) "Spatialclustering of metals in thesediments of theSkagerrak/Kattegat." AppliedGeochemistry14.6: 689-706.
15.Blei, David M. (2008) "Hierarchicalclustering." LectureSlides, February
16.Hervada-Sala, C.,&Jarauta-Bragulat, E. (2004) A program
toperformWard'sclusteringmethod on severalregionalizedvariables.
Computers&geosciences, 30(8), 881-886.
17.Ferreira, L., Hitchcock, D.B., (2009) ―A Comparison of Hierarchical Methods For
Clustering Functional Data‖, Communications in Statistics—
SimulationandComputation, 38.9, p. 1925-1949.
18.S. Sharma, S., (1996)AppliedMultivariateTechniques, John WileyandSons, New York.
19.Karypis, G.,Eui-Hong, H., Vipin, K., (1999) "Chameleon:
Hierarchicalclusteringusingdynamicmodeling." Computer32.8, p. 68-75.
20.Fovell, R. G.,andFovell M.Y.C. (1993)ClimateZones of theConterminous United StatesDefined Using Cluster Analysis. J.Climate, 6, 2103-2135.
21.Mouffron, M.,Frederic R., Huafei Z., (2008) "SecureTwo-PartyComputation of SquaredEuclideanDistances in the Presence of MaliciousAdversaries." Information
Security andCryptology. Springer Berlin Heidelberg.
22.Fraley, Chris, andAdrian E. Raftery. (1998) "How manyclusters?
Whichclusteringmethod? Answersvia model-basedclusteranalysis."