Journal of Chemical and Pharmaceutical Research
__________________________________________________
ISSN No: 0975-7384 CODEN(USA): JCPRC5
J. Chem. Pharm. Res., 2011, 3(3):563-571
A Validated RP-HPLC Method for Simultaneous Estimation of
Bronopol in Lactulose Solution USP
Sukanto Paul*, Kaushal K. Chandrul and Krishan R. Bhadu
School of Pharmaceutical Sciences, Jaipur National University, Jaipur, Rajasthan, India ______________________________________________________________________________
ABSTRACT
A validated reverse phase high performance liquid chromatography method has been developed for the simultaneous determination of Bronopol in Lactulose Solution USP. Chromatography was
carried out on a BDS Hypersil C18 (4.6 mm × 250 mm, 5 µm) using Water:Acetonitrile:
Phosphate Buffer in the ratio of 94.5:5:0.5 (v/v/v) as the mobile phase at a flow rate of 1.0 mL/min and eluents were monitored at 214 nm. The average retention time of Bronopol was found to be 8.160 min. The method was validated for specificity, linearity, precision, accuracy,
robustness and solution stability. The calibration curve was linear (R2≥0.9998) over the range of
4.0-12.0 µg/mL.
Key words: Bronopol, Lactulose Solution USP, RP-HPLC, Validation.
______________________________________________________________________________
INTRODUCTION
Bronopol (2-bromo-2-nitropropane-1,3-diol) is one of the most advanced bactericides available in the market for odour control. The Minimum Inhibitory Concentrations (M.I.C.) of Bronopol are typically 12.5 –25ppm for a wide range of Gram negative and Gram positive bacteria, including Staphylococcus epidermidis, Klebsiella aerogenes, and Escherichia coli. Bronopol was recommended as suitable for the preservation of oral medicament. The molecular structure of Bronopol is shown in figure 1.
Figure 1.Structure of Bronopol O
H OH
Lactulose Solution USP contains Bronopol as preservative and its concentration in solution is 0.00667% (w/v).
It operates through a unique dual action mechanism. Firstly, it has a powerful biocidal action that controls the microorganisms (e.g. E.coli) that are present in human waste. Secondly, it reacts with thiol containing groups that cause bad odours e.g. hydrogen sulphide, mercaptans and organic sulphides to form more complex, less odorous compounds.
The objective of this work was to develop simple and rapid RP-HPLC method which would be accurate and precise.
The methods were validated according to ICH guidelines. The linearity of response, accuracy, and intermediate precision of the described methods has been validated.
EXPERIMENTAL SECTION
Chemicals and Materials
Bronopol working standard (purity, 99.81%) was provided by Aster Industries Ltd., Andra Pradesh, India and Lactulose Solution were provided by Albert David Ltd., Kolkata, India. Acetonitrile (HPLC grade) and orthophosphoric acid (analytical grade) were purchased from Fisher Scientific. The water used in HPLC and for sample preparation was produced with a Super Purity Water System. Sodium Hydroxide pellets (analytical grade) used for adjusting the pH of mobile phase were purchased from RFCL Pvt. Ltd. Lactulose (RS) used for specificity was purchased from Sigma Industries Ltd.
Instrumentation
The chromatographic system used to perform development and validation of this assay method was comprised of a UV detector and a auto-sampler (Dionex-Ultimate 3000) connected to a Multi-instrument data acquisition and data processing system (Chromeleon software solutions).
[image:2.595.168.444.522.635.2]HPLC Conditions
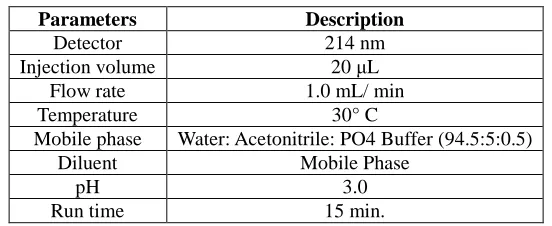
Table 1.HPLC Conditions
Parameters Description
Detector 214 nm
Injection volume 20 µL
Flow rate 1.0 mL/ min
Temperature 30° C
Mobile phase Water: Acetonitrile: PO4 Buffer (94.5:5:0.5)
Diluent Mobile Phase
pH 3.0
Run time 15 min.
1. Method development by RP-HPLC
1.1 Mobile phase preparation
A mixture of 94.5ml of Distilled water, 5ml of Acetonitrile and 0.5ml of a 10% v/v solution of Orthophosphoric acid, adjusting the pH to 3.0 using 2M sodium hydroxide.and allowed to sonicate for 30 minutes.
1.2 Standard preparation
to volume with mobile phase. 1ml of standard stock solution was pipetted out to 100ml volumetric flask and volume was adjusted with mobile phase. The solution was filtered through 0.22 µ Membrane filter; and filtrate was collected after discarding first few ml.
0.0 2.0 4.0 6.0 8.0 10.0 12.0 15.0 -2,000
5,000 10,000 15,000
18,000 BRONOPOL STANDARD # 3
A b s o rb a n c e [ µ A U ]
Retention Time [min]
8 .1 0 0 B r o n o p o
[image:3.595.166.437.126.282.2]l WVL:214 nm
Figure 2.Standard chromatogram
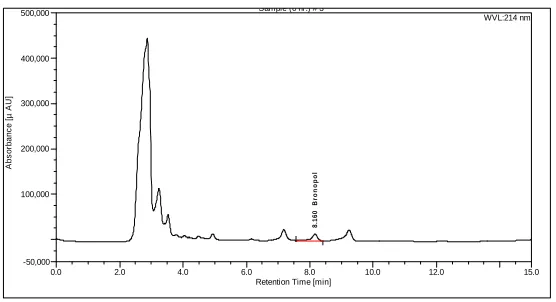
1.3 Sample preparation
Transfer 13g to 13.5g of sample to a 50mL volumetric flask and add about 25ml of mobile phase, mix. Dilute to 50ml with mobile phase. The prepared solution was filtered through 0.22 µ
membrane filter and filtrate was collected after discarding first few ml.
0.0 2.0 4.0 6.0 8.0 10.0 12.0 15.0 -50,000
100,000 200,000 300,000 400,000
500,000 Sample (6 hr.) # 3
A b s o rb a n c e [ µ A U ]
Retention Time [min]
[image:3.595.167.445.380.531.2]8 .1 6 0 B ro n o p o l WVL:214 nm
Figure 3.Sample chromatogram
1.4 Blank Chromatogram
Mobile phase used as diluent in the assay preparation was injected before and after the sample injection
1.5 Calculation for estimation of bronopol content in lactulose solution
Peak area of sample Std. taken (g) 1 % purity of std Wt. per ml (g)
Bronopol content = ___________________ x ___________ x ____ x _____________ x 50 x _______________ x 100 % (w/v)
Peak area of std 50 100 100 Wt. of sample taken (g)
2. Method Validation
2.1 Linearity of detection response and range
The linearity within 40% to 120% of the expected concentration range were determined. The responses were plotted as a function of analyte concentration. Regression line by method of least square was calculated and correlation coefficient (R2) was determined.
Standard stock solution preparation
Weigh accurately about 25mg of Bronopol WS in a 100ml volumetric flask, dissolve it and dilute to volume with mobile phase.
Following dilution table was followed to get expected concentration of analyte.
Table 2.Dilution table
Volume of Standard stock solution taken (ml) Diluted to (ml) Concentration (µg/ml) % Test concentration
1.6 100 4 40
2 100 5 50
2.4 100 6 60
2.8 100 7 70
3.2 100 8 80
3.6 100 9 90
4 100 10 100
4.4 100 11 110
4.8 100 12 120
2.2 Precision
Analyzed a particular homogeneous sample making a set of six separate samples in each time by different analyst for different days using the same instrument and subsequent evaluation of the result for Standard Deviation (SD) & Relative Standard Deviation (RSD).
2.3 Accuracy
Accuracy was calculated as the percentage of recovery by the assay of the known added amount of analyte (API) in the sample in variable quantities (80%, 100% and 120%).
Preparation of spiking solution
Dilute 10ml of standard stock solution to 100ml with mobile phase.
Set –1 (Assay Preparation for 80 % standard addition)
Set –2 (Assay Preparation for 100 % standard addition)
Transfer 13 g to 13.5 g of sample to a 100 ml volumetric flask; add 7 ml of spiking solution and add about 50 ml of mobile phase, and mix. Dilute to 100ml with mobile phase.
Set –3 (Assay Preparation for 120 % standard addition)
Transfer 13 g to 13.5 g of sample to a 100 ml volumetric flask; add 8.4 ml of spiking solution and add about 50 ml of mobile phase, and mix. Dilute to 100ml with mobile phase.
2.4 Specificity
By spiking the drug substance with 50%, 100% & 150% of excipients (i.e. Placebo blend) and demonstrating the assay result is unaffected by the presence of these impurities.
Standard solution preparation for specificity
Weigh accurately about 50mg of Bronopol WS in a 50ml volumetric flask, dissolve it and dilute to volume with mobile phase. Dilute 1ml of standard stock solution to 100ml with mobile phase.
Assay Preparation (for addition of 50% of Lactulose)
Transfer 1ml standard stock solution into a 100ml volumetric flask and add 10g of Lactulose in about 50ml of mobile phase and mix. Dilute to 100ml with mobile phase.
Assay Preparation (for addition of 100% of Lactulose)
Transfer 1ml standard stock solution into a 100ml volumetric flask and add 20g of Lactulose in about 50ml of mobile phase and mix. Dilute to 100ml with mobile phase.
Assay Preparation (for addition of 150% of Lactulose)
Transfer 1ml standard stock solution into a 100ml volumetric flask and add 30g of Lactulose in about 50ml of mobile phase and mix. Dilute to 100ml with mobile phase.
Separately injected 20 mL of the standard preparation and all the assay preparations into the chromatograph, chromatograms were recorded and measured the peak responses for the major peaks.
2.5 Stability of Analyte in solution
The stability of solution for test preparation was evaluated. The solution was stored at ambient temperature and tested at interval of 2, 4, and 6 h. The responses for the aged solution were evaluated using a freshly prepared standard solution.
2.6 Ruggedness
Effect of change in reagent manufacturer on assay value was studied.
RESULT AND DISCUSSION
1. System suitability
Table 3.System suitability study of bronopol
Injection Area Plate Count Tailing factor
1 135495.974 5385 0.91
2 136055.950 5427 0.92
3 136931.142 5465 0.92
4 137441.358 5482 0.93
5 137497.094 5508 0.93
6 138485.674 5461 0.94
Mean 136984.532 5454.67 0.93 %RSD 0.79%
RSD=Relative standard deviation
2. Linerity and range
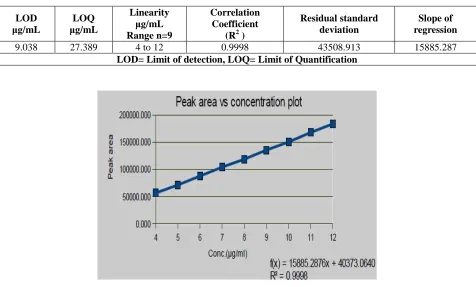
The plot of peak area responses against concentration is shown in Figure 5. It can be seen that plot is linear over the concentration range of 4 to 12 µg/mL for Bronopol with a correlation coefficient (R2 ) 0.9998. The results of linearity, limit of detection and limit of quantification
[image:6.595.69.545.348.635.2]were presented in Table 4.
Table 4.Characteristics of the analytical method derived from the standard calibration curve
LOD
µg/mL
LOQ
µg/mL
Linearity
µg/mL Range n=9
Correlation Coefficient
(R2 )
Residual standard deviation
Slope of regression
9.038 27.389 4 to 12 0.9998 43508.913 15885.287
LOD= Limit of detection, LOQ= Limit of Quantification
Figure 5.Standard calibration curve
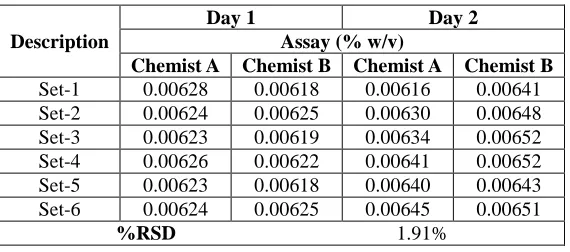
3. Precision
[image:6.595.161.451.399.632.2]Table 5.Evaluation data of precision study
Description
Day 1 Day 2
Assay (% w/v)
Chemist A Chemist B Chemist A Chemist B Set-1 0.00628 0.00618 0.00616 0.00641 Set-2 0.00624 0.00625 0.00630 0.00648 Set-3 0.00623 0.00619 0.00634 0.00652 Set-4 0.00626 0.00622 0.00641 0.00652 Set-5 0.00623 0.00618 0.00640 0.00643 Set-6 0.00624 0.00625 0.00645 0.00651
%RSD 1.91%
4. Accuracy
The HPLC area responses for accuracy determination are depicted in Table 6. The results shown that best recoveries (97.07-99.02%) of the spiked drug were obtained at each added concentration, indicating that the method was accurate.
Table 6.Evaluation data of accuracy study
Description Amount of Bronopol added (mg) Observed concentration (mg) % Recovery
Set-1 (80%) 0.57232 0.55450 97.07
Set-2 (100%) 0.71540 0.69496 97.33
Set-3(120%) 0.85848 0.84849 99.02
5. Specificity
The assay result was unaffected by spiking the drug substance with 50%, 100 & 150% of excipients. The results of specificity study are shown in Table 7. The developed method was found to be specific as the %RSD for specificity studies was 1.14 %, which confirms that method was specific.
Table 7.Evaluation data for specificity study
Description Area Content (mg) Assay-1 (50%) 139523.757 0.95058 Assay-2 (100%) 138755.940 0.94535 Assay-3 (150%) 136482.727 0.92986
Mean value (mg) 0.94 %RSD 1.14%
6. Solution Stability
Table 8 shows the results obtain in the solution stability study at different time intervals for test preparation. It was concluded that the test preparation solution was found stable at ambient temperature as during this time the result was not decrease below the minimum percentage.
Table 8.Evaluation data for solution stability study
Intervals Assay (%w/v)
Initial 0.00604
Sample (2 hr) 0.00610
Sample (4 hr) 0.00613
Sample (6 hr) 0.00616
7. Ruggedness
By using the different reagent manufacturer in the analysis of the drug substance, the assay result of the test sample was unaffected. Results of ruggedness were shown in Table 9.
Table 9.Evaluation data for ruggedness
[image:8.595.85.528.259.376.2]Description Assay (%w/v) Manufacturer-A 0.00647 Manufacturer-B 0.00634 Manufacturer-C 0.00630 %RSD 1.41%
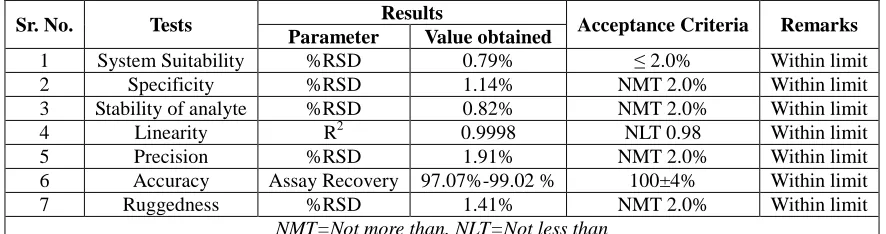
Table 10.Summary of validation parameters of RP -HPLC method for Simultaneous estimation of bronopol in lactulose solution USP.
Sr. No. Tests Results Acceptance Criteria Remarks
Parameter Value obtained
1 System Suitability %RSD 0.79% ≤ 2.0% Within limit
2 Specificity %RSD 1.14% NMT 2.0% Within limit
3 Stability of analyte %RSD 0.82% NMT 2.0% Within limit
4 Linearity R2 0.9998 NLT 0.98 Within limit
5 Precision %RSD 1.91% NMT 2.0% Within limit
6 Accuracy Assay Recovery 97.07%-99.02 % 100±4% Within limit
7 Ruggedness %RSD 1.41% NMT 2.0% Within limit
NMT=Not more than, NLT=Not less than
CONCLUSION
A new analytical method has been developed to be routinely applied to determine bronopol in lactulose solution USP. The standard deviation and % RSD calculated for the proposed method is low, indicating high degree of precision of the method. The results of the recovery studies performed show the high degree of accuracy of the proposed method. Hence, it can be concluded that the developed RP-HPLC method is accurate, precise and selective and can be employed successfully for the estimation of bronopol in lactulose solution. The developed procedure has been evaluated over the specificity, linearity, accuracy, precision and ruggedness in order to ascertain the stability of the analytical method. It has been proved that it was specific, linear, precise and accurate. Hence, the method is recommended for routine quality control analysis and also stability sample analysis.
REFERENCES
[1] Snyder LR; Kirkland JJ, Practical H.P.L.C. Method Development, 2ndedition, John Wiley and Sons Inc., USA, 2000, 542-574.
[2] Skoog Douglas A; West Donald M; Holler F. James; Crouch Stanley R, Fundamental of pharmaceutical analysis, 8th edition, Thomson Learning, 2001, 947-950; 973-975; 996; 1003. [3] FDA Q2B: Validation of Analytical Procedures and Methods Validation, August 2000. [4] ICH Q2B: Validation of Analytical Procedures: Methodology, May 1997
[5] International Conference on the Harmonization of Technical Requirements for the Registration of Pharmaceutical for Human Use (ICH) Q2B 1996. Validation of Analytical Procedures, Methodology.
[6] Rita Sešķēna; Līga Jankevica, Acta Universitatis Latviensis, 2007, 723, 171.
[8] Khan Azam Mir; Iqbal Zafar; Jan Mohammad Rasul; Shah Jasmin; Ahmad Wagar; Haq Zia Ul; Obaidullah A, J. Ana. Chem., 2004, 61, 32.
[9] Massimo Luzzana; Dario Agnellini; Paola Cremonesi; Giancarlo Caramenti; Silvia De Vita,
J. Lait., 2003, 83, 409.
[10] Tommaso R. I. Cataldi; Massimiliano Angelotti; Sabino A. Bufo, J. Ana. Chem., 1999, 71, 4919.