Journal of Chemical and Pharmaceutical Research
__________________________________________________
ISSN No: 0975-7384 CODEN(USA): JCPRC5
J. Chem. Pharm. Res., 2011, 3(1):145-153
Modeling of Adsorption Compression for Supercritical Carbon Dioxide
P Sumanatrakul1, C Sangwichien1, G Aranovich2 and M D Donohue2
1
Department of Chemical Engineering, Faculty of Engineering, Prince of Songkla University, Songkhla, Thailand
2
Department of Chemical and Biomolecular Engineering, Johns Hopkins University, Baltimore, Maryland, USA
______________________________________________________________________________
ABSTRACT
This paper is reporting new finding in the field of adsorbate-adsorbate interaction for supercritical carbon dioxide adsorption by One-Kondo model analysis. Adsorption isotherms for supercritical carbon dioxide on activated carbon Filtrasorb 400 and on zeolite 13X have been evaluated and shown to demonstrate adsorption compression phenomenon at high pressure end just as in subcritical systems. Experimental isotherms for adsorption of supercritical carbon dioxide are plotted in Ono-Kondo coordinates with the Henry’s constant estimated based on results of modeling as well as calorimetric and chromatographic measurements. The linear sections of the results show the range of applicability of the classical Ono-Kondo model with constant energies of interactions. The slopes of these linear sections represent values and signs of these energies: negative slopes indicate repulsive interactions in adsorbed phase due to adsorption compression. Switching interactions from attractive to repulsive with an increase in the pressure for supercritical adsorption suggests that adsorbed phase has two regions. One is an attractive region at low-pressures and the other is a repulsive region at high pressures. It can be indicated that the shape of isotherms in Ono-Kondo coordinates can help to understand adsorbate-adsorbate energies; the slope of the line in Ono-Kondo coordinates gives the sign and magnitude of the energy as a function of adsorbate density.
Keywords: Supercritical carbon dioxide, adsorbate-adsorbate interactions, adsorption
compression, Ono-Kondo model.
______________________________________________________________________________
INTRODUCTION
diffusion coefficient and low viscosity imply that it can have good transport properties [1]. Therefore, supercritical carbon dioxide is becoming an important commercial and industrial solvent due to its role in chemical processes in addition to its non-toxic, non-flammable, relatively unreactive, rapid reaction, inexpensive, less solvent residues in products, environmental friendly, and small solvent disposal costs [2-5].
Supercritical carbon dioxide is widely used in extraction [6-7], purification (especially in pharmaceutical) [8-9], polymerization [10-11], fuel storage [12-13], nanotechnology [14], and biotechnology [15]. However, the required properties of supercritical carbon dioxide generally are neither available for all components nor available at all operating conditions of interest. Thus need to be estimated by thermodynamic models. One area where both data and models are needed desperately concerns with the adsorption-desorption behavior of supercritical fluids. Adsorption process is a phenomenon that can be seen phase equilibrium between fluid phase and adsorbent.
It has been found that experimental errors can be largely ruled out, it is concluded that the initial assumptions are not valid for high-pressure carbon dioxide adsorption on various adsorbents. One of the causes is that high repulsive forces between nearest-neighboring adsorption sites resist a full occupation and a corresponding increase of the adsorbed phase density [16].
[image:2.595.192.423.552.695.2]This work is based on ideas originally proposed by Ono and Kondo [17] for density gradients at fluid-solid interfaces. The Ono-Kondo model is able to predict a wide variety of behavior including multilayer adsorption [18], hysteresis in micropores [19], and adsorption in supercritical systems [20]. It also has been discussed for a phenomenon of compression in adsorbed phases at subcritical conditions [21]. In compressed systems, molecules adsorb to highly attractive surface to reach densities greater than in a normal liquid. Strong attractions to the surface can cause more molecules to pack in the fast layer than in a normal liquid and therefore create highly repulsive interactions among nearest neighbors. Thus compression is introduced by having repulsive nearest neighbor interactions [22]. This phenomenon has various demonstrations, including compression of molecules sitting on neighboring active sites of a solid surface, compression of adsorbed surface layers, and compression in nanopores [23-25]. In this paper, we consider a new aspect of compression behavior for supercritical carbon dioxide adsorption by using Ono-Kondo lattice model to allow analysis of adsorbate-adsorbate interactions in the adsorbed phase from adsorption isotherms.
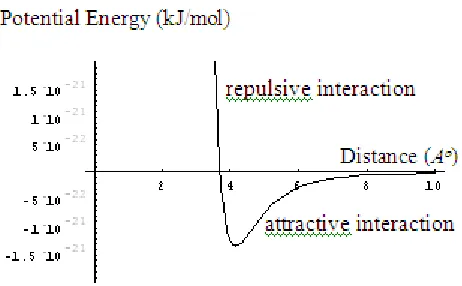
Figure 1 Lennard–Jones potential function of fluid
potential function as shown in Figure 1. These interactions can be occurred between adsorbed molecule and surface of adsorbent, or can be occurred between adsorbed molecule and other adsorbed molecules. One of interactions is an attractive (positive slope) and another one is repulsive (negative slope) interaction.
MODELING
To derive the adsorption isotherm, this applies concepts first proposed for lattice systems by Ono and Kondo [17]. Consider taking an adsorbate molecule from the surface and moving it to an empty volume between molecules in the bulk (far from the surface). This is equivalent to the exchange of the molecule with a vacancy that it fills
b M s V b V s
M + = +
(1)
Where Ms is the adsorbate molecule on the surface, Mb is the adsorbate molecule in the bulk, Vs
is the vacancy on the surface, and Vb is the vacancy in the bulk.
If this exchange occurs at equilibrium, then;
0 = ∆ −
∆U T S (2)
Where
∆
U and∆
S are the internal energy and entropy changes and T is the absolute temperature.The value of
∆
S can be represented in the form;
(
)(
)
(
m)
bb m x a a x a a k S / 1 1 / ln − − = ∆ (3)
Where k is Boltzmann’s constant, xb is the density of adsorbate in the bulk, a is the density
(number of adsorbed molecules per square meter) and am is the maximum density of adsorbate
molecules that can be on the surface.
The change in internal energy is:
g f
s U U
U= + −
∆ ϕ (4)
Where
ϕ
s is an average energy of the molecule-surface interaction, Uf is the energy of interactionbetween a central molecule and surrounding molecules in the 2-D fluid, and Ug is the energy of
interaction between a central molecule and surrounding molecules in the 3-D gas.
Substituting equations (3) and (4) into equation (2)
(
)(
)
(
1 /)
01 /
ln + + + =
− − g f s b m b m U U x a a x a a k ϕ (5)
For soft molecules (real molecules and Lennard-Jones molecules), can be defined the energy of interaction between a central molecule and surrounding molecules in the 2-D fluid as:
( )
r*a Uf =
λ
ϕ
(6) Where
λ
is a coefficient (<1) which accounts for the fact that each neighbor can belong to several clusters,λ
= 2π
r*2g0, g0 is the positive coefficient not depending on distance (in the mean-field,adsorbed phase critical point occurs at 2
π
g0 = 6), a is the density in the 2-D fluid (number offrom two cases as: = densities high for ) ( densities low for 2 * 0 6 / 1 a r r σ (7)
r0 is the average distance between molecules in the dense monolayer. And can be written the
energy of interaction between a central molecule and surrounding molecules in the 3-D gas in a similar form
( )
/ / * r xUg =λ bϕ
(8) Where
λ
/ and r*/ are 3-D analogs ofλ
and r* for gas phase. And plugging equations (6) and (8) into equation (5)(
)(
)
(
1 /)
( *) ( * ) 01 / ln / / = − + + − − kT r x kT r a kT x a a x a
a s b
b m
b
m
ϕ
λ
ϕ
λ
ϕ
(9)
In the equation (9), the first two terms can be reduced to equation (10). The investigation of supercritical adsorption behavior is reasonable for xb very less than unity, and H is equal to
exponential of (-
ϕ
s/kT). Therefore, equation (9) can be simplified to the following form ofequation (10):
(
)(
)
(
m)
bb m x a a H x a a Y / 1 1 / ln − − = (10) Where the Henry’s constant is,
− = kT
H exp ϕs
(10a) Therefore, equation (9) can be represented in the following form:
kT r x a kT r x Y b b ) * ( *)
( λ/ϕ /
λϕ +
− =
(11)
When plotted Y/xb versus a/xb can get the value of
λϕ
(r*)from the slope of the graph. The signof
λϕ
(r*) gives information about the sign of adsorbate-adsorbate interactions. Moreover, plotting Y/xb as a function ofa/xb also give the intercept,λ
/ϕ
(r*/), which can be used to verify theassumption that the term of energy of interaction between a central molecule and surrounding molecules in the 3-D gas. Therefore, it can be indicated that the slope of this line gives the value of coefficient and the sign of coefficient gives information about the character of adsorbate-adsorbate interactions.
RESULTS AND DISCUSSION
Adsorption isotherms for supercritical carbon dioxide in Ono-Kondo coordinates with variable H
We considered equation (11) to analyze adsorption isotherms with H being a variable parameter. In principle, the value of H can be estimated from the slope of the isotherm at small pressures. It has been found that values of Hfor carbon dioxide on Filtrasorb 400 vary over the range from 30 to 300. However, for carbon dioxide on zeolite 13X, H varies between 3000 and 30000, reflecting significantly stronger interactions with the adsorbent.
constants (dimensionless terms). As shown by Figure 2, increasing of H from 30 to 300 for supercritical carbon dioxide on Filtrasorb 400 changes the shape of the isotherms in Ono-Kondo coordinates; in particular, the slope at low pressure end changes from positive to negative.
(a)
-300 -200 -100 0 100 200 300 400 500
0 200 400 600 800 1000
a/xb
Y/xb
H = 30 H = 50 H = 100 H = 150 H = 200 H = 300 (b)
-20000 -16000 -12000 -8000 -4000 0 4000 8000
0 5000 10000 15000 20000 25000 30000 35000 40000
a/xb Y/xb
[image:5.595.74.521.129.273.2]H = 3000 H = 5000 H = 10000 H = 15000 H = 20000 H = 30000
Figure 2 Adsorption isotherms in Ono-Kondo coordinate with variable H: (a) for carbon dioxide on activated carbon Filtrasorb 400 at 318.2 K (calculated from ref. [26]) and (b) for carbon dioxide on zeolite
13X at 308 K (calculated from ref. [27]).
However, for supercritical carbon dioxide on zeolite 13X, switching from positive slope to negative at low pressure end occurs over significantly higher range of H – from 3000 to 30000. As mentioned earlier, this is because adsorption affinity of carbon dioxide to zeolite 13X is much larger than to Filtrasorb 400 and much larger than affinity of nitrogen and methane to these adsorbents.
As seen from Figure 2, at the high pressure end (at small a/xb), all slopes become negative. This
indicates that the adsorbate - adsorbate interactions become repulsive as pressure goes up, which is consistent with the concept of adsorption compression observed in subcritical systems [21-25]. To analyze transition to adsorption compression, in the next section we plot isotherms in coordinates of equation (11) with estimated values of H.
Adsorption Isotherms for Supercritical Carbon Dioxide in Ono-Kondo Coordinates with Estimated H
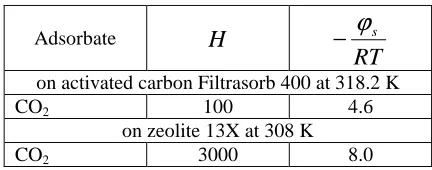
To analyze the transition to adsorption compression, we plot isotherms in coordinates of equation (11) with estimated values of H in Table 1. It is well known that the value of H can be estimated from the slope of the isotherm at the small pressures. However, we present estimates for normalized H which are in a reasonable ranges in terms of results known from statistical modeling and from chromatographic and adsorption measurements [28-30]. Tables 1 also gives values of
RT
s ϕ
− calculated from H by using equation (10a).
Table 1 Dimensionless Henry’s constants for carbon dioxide adsorption on different adsorbents [28-30]
Adsorbate H
RT
s ϕ −
on activated carbon Filtrasorb 400 at 318.2 K
CO2 100 4.6
on zeolite 13X at 308 K
[image:5.595.197.413.664.749.2]Figure 3 shows adsorption isotherms in Ono-Kondo coordinate with estimated H for supercritical carbon dioxide on activated carbon Filtrasorb 400 and on zeolite 13X. These isotherms have similar shapes: going down to a minimum and then going up. This shape is consistent with interpretation of the derivative of this function representing potential function for adsorbate-adsorbate interactions. The reason for such a behavior is adsorption compression arising from competition between attraction of the adsorbate to the adsorbent surface and repulsions between/among neighboring adsorbate molecules [21, 24].
Note that at low pressure, neighbors in adsorbate attract each other. As pressure goes up, the distance between adsorbate molecules can become less than in a normal liquid and nearest neighbors repel each other. This is possible because the decrease of free energy due to attraction to the adsorbent is greater than the increase of free energy due to repulsions between adsorbate molecules. At the point where the adsorbate-adsorbate interactions go from attractive to repulsive, the average adsorbate-adsorbate energy is zero and this point corresponds to minimum in isotherms shown in Figure 3.
(a)
0 20 40 60 80 100 120
0 100 200 300 400 500 600 700 800 900
a/xb
Y/x
b (b)-1000 -500 0 500 1000 1500 2000 2500
0 4000 8000 12000 16000 20000
a/xb
Y/x
bFigure 3 Adsorption isotherms in Ono-Kondo coordinate with estimated H: (a) for carbon dioxide on activated carbon Filtrasorb 400 at 318.2 K (calculated from ref. [26]) and (b) for carbon dioxide on zeolite
13X at 308 K (calculated from ref. [27]).
(a1)
0 20 40 60 80 100 120
0 100 200 300 400 500 600 700 800 900
a/xb
Y/xb (a2)
y = -0.0812x + 24.02, R2 = 0.9840
0 5 10 15 20
50 100 150 200 250 300
a/xb
[image:6.595.75.512.538.728.2](b1)
-600 -400 -200 0 200 400 600 800
200 1200 2200 3200 4200 5200 6200 7200 8200 9200 a/xb
Y/xb (b2)
y = -0.3853x + 59.428, R2 = 0.9788
-200 -150 -100 -50 0
200 300 400 500 600 700
a/xb
[image:7.595.75.533.66.263.2]Y/xb
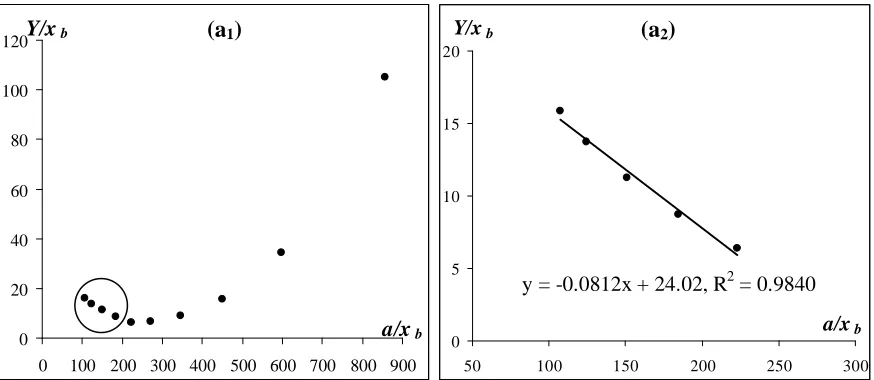
Figure 4 Adsorption isotherms for (a) carbon dioxide on activated carbon Filtrasorb 400 at 318.2 K (calculated from ref. [26]) and (b) carbon dioxide on zeolite 13X at 323 K (calculated from ref. [27]). Circles
indicate high pressure ends, and right frames show high pressure ends in larger scale.
Figure 4 shows adsorption isotherms for carbon dioxide in Ono-Kondo coordinates on various adsorbents. In this Figure, high pressure ends are marked by circles and right frames give high pressure ends in much larger scales. These graphs allow estimates of energies of adsorbate-adsorbate repulsions in supercritical systems. Comparison of frames (a) and (b) indicates that adsorption compression of carbon dioxide in pores of zeolite is much stronger than in pores on Filtrasorb 400.
0.2
0.3
0.4
0.5
0.6
0.7
0.0
0.1
0.2
0.3
0.4
0.5
0.6
ρρρρ
bulkGibbs adsorption
(mmol/g)
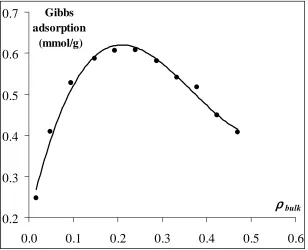
Figure 5 Gibbs adsorption isotherms: line curve is theoretical isotherms are obtained from Ono-Kondo equation [20] at λλλλϕϕϕϕ(r*)/kT value that gets from Figure 4 for supercritical carbon dioxide; and point curve is
experimental isotherms for supercritical carbon dioxide adsorbed on activated carbon at T = 318.2 K (used data from ref. [26]).
[image:7.595.153.461.411.661.2]point is that Ono-Kondo coordinates allow interpretation of intermolecular forces of adsorbate molecules from Figure 4.
CONCLUSION
The adsorption isotherms for supercritical carbon dioxide showed both negative and positive slopes. The negative slopes of lines (positive interaction energies) indicate repulsions between adsorbate molecules on the surface. These isotherms indicate the transition from attraction to repulsion between molecules of the adsorbate. The positive values of interaction energy are not surprising because of the very strong Lennard-Jones repulsion between adsorbed molecules on nearest neighbor adsorption sites. This also suggests that the repulsive part of adsorbate-adsorbate interactions is the dominant contribution to the average intermolecular interaction at high densities. With estimated values of H, adsorption isotherms in Ono-Kondo coordinates show deviations from behavior of compression phenomenon at high pressure end. The slopes of these linear sections represent values and signs of these energies: negative slopes indicate repulsive interactions in adsorbed phase due to adsorption compression. This result also should have an effect on solidification of the adsorbed layer and on the rates of reaction on catalyst surfaces.
Acknowledgement
The authors acknowledge support by the Graduate School and faculty of Engineering, Prince of Songkla University for providing a scholarship to study and pursue this paper. Appreciation is extended to the Johns Hopkins University for their assistance during my time in the United States.
REFERENCES
[1] Y. P. Sun, Supercritical Fluid Technology in Materials Science and Engineering: syntheses, properties, and applications, (2002), Marcel Dekker, USA.
[2] C. M. Wai, A. S. Gopalan, H. K. Jacobs, ACS Symposium Series, (2003), 860, 2-8. [3] G. Brunner, Journal of Food Engineering, (2005), 67, 21-33.
[4] S. P. Nalawade, F. Picchioni, L. P. B. M. Janssen, Progress in Polymer Science, (2006), 31, 19-43.
[5] I. Pasquali, R. Bettini, F. Giordano, European Journal of Pharmaceutical Sciences, (2006), 27, 299-310.
[6] O. Boutin, E. Badens, Journal of Food Engineering, (2009), 92, 396-401.
[7] S. Machmudah, Y. Kawahito, M. Sasaki, M. Goto, The Journal of Supercritical Fluids, (2007), 41, 421-428.
[8] Y. Iwai, M. Higuchi, H. Nishioka, Y. Takahashi, Y. Arai, Ind. Eng. Chem. Res., (2003), 42, 5261-5267.
[9] B. Liau, C. Shen, F. Liang, S. Hong, S. Hsu, T. Jong, C. J. Chang, The Journal of
Supercritical Fluids, (2010), 55, 169-175.
[10] P. A. Charpentier, J. M. DeSimone, G. W. Roberts, ACS Symposium Series, (2002), 819, 113-135.
[11] K. Matsuyama, K. Mishima, The Journal of Supercritical Fluids, (2009), 49, 256-264. [12] M. Mazzotti, R. Pini, G. Storti, The Journal of Supercritical Fluids, (2009), 47, 619-627. [13] N. Siemons, A. Busch, International Journal of Coal Geology, (2007), 69, 229-242. [14] H. Wakayama, Y. Fukushima, Ind. Eng. Chem. Res., (2006), 45, 3328–3331.
[15] A. C. Mitchell, A. J. Phillips, M. A. Hamilton, R. Gerlach, W. K. Hollis, J. P. Kaszuba, A. B. Cunningham, The Journal of Supercritical Fluids, (2008), 47, 318-325.
International Journal of Coal Geology, (2002), 51, 69-92.
[17] S. Ono, S. Kondo, Molecular theory of surface tension in liquids, Encyclopedia of Physics, (1960), Springer-Verlag, Berlin.
[18] G. L. Aranovich, M. D. Donohue, J. Colloid. Interface. Sci., (1997), 189, 101-108. [19] G. L. Aranovich, M. D. Donohue, J. Colloid. Interface. Sci., (1998), 205, 121-130. [20] G. L. Aranovich, M. D. Donohue, J. Colloid. Interface. Sci., (1996), 180, 537-541. [21] G. L. Aranovich, M. D. Donohue, Langmuir, (2003), 19, 2722-2735.
[22] G. L. Aranovich, T. E. Wetzel, M. D. Donohue, J. Phys. Chem. B, (2005), 109, 10189-10193.
[23] G. L. Aranovich, C. Sangwichien, M. D. Donohue, J. Colloid. Interface. Sci., (2000), 227, 553-560.
[24] G. L. Aranovich, M. D. Donohue, Colloid and Surfaces A: Physicochemical and
Engineering Aspects, (2001), 187-188, 95-108.
[25] G. L. Aranovich, M. D. Donohue, J. Colloid. Interface. Sci., (2005), 292, 202-209.
[26] M. Sudibandriyo, Z. Pan, J. E. Fitzgerald, R. L. Robinson, K. A. M. Gasem, Langmuir, (2003), 19, 5323-5331.
[27] S. Cavenati, C. A. Grande, A. E. Rodrigues, J. Chem. Eng. Data., (2004), 49, 1095-1101. [28] H. M. McNair, E. J. Bonelli, Basic Gas Chromatography, (1968), Varian Aerograph, USA. [29] C. J. Cowper, A. J. DeRose, The Analysis of Gases by Chromatography, (1983), Pergamon Press, Oxford.