CHAPTER 1
INTRODUCTION
1.1 Project Background
Food industry is the key of development that led to the rise of human civilization. Meat
industry is very important in the food industry as it contributes to the increase of
consumers apply. This husbandry of domesticated animal and plants creates food
surpluses that enabled the development of more densely populated and stratified
societies. This field of food study is very important to improve the quality of human
being. The color of fresh meat is a sensory indicator of which effects the consumers
behavior, especially the consistency of meat color and musculature. Other factors that
influence consumers to purchase include security, nutrition and taste.
Recently, there has been no report to grade the meat freshness in the process of
meat delivery. Before this, most of the meats freshness is grading manually by using the
human eyesight at the meat’s color and quantity of fats. A parameter to show the
freshness of meat has only been analyzed manually using a human’s eyes. This is some
kind of difficult method to make a right decision when choosing whether the meat is
fresh or not. Meat grading is a method to show the mathematical calculation on the
change of color and using online learning Neural Network in the process of meat
classification. This study focus on designing a grading system based on time when
selecting the fresh meat. This study had found that color changing significantly with the
time, and this was proven after calculation. For the concentrations of bacteria, it can be
By doing a test on the selected number of samples using a photoelectric
technology, an effectiveness method for grading system using a vision feature with an
image processing may help in the selection of the fresh meat using the grading system.
The results obtained using the proposed method were confirmed to agree well with the
judgments of a grader.
1.2 Problem Statement
This project has become the interest to the researcher when system grading for meat
detection is develop to ease human and also to improve their quality of life. The main
objective of this project is to ease consumers how to choose a good quality of meat
when buying or purchasing the fresh meat. The targeted users are huge, whether persons
in charge at the restaurants, hotels or domestic consumers, which always use meat as
their dishes. Meat freshness has become an issue when consumers purchase a meat
while the color of fresh meat is acted as sensory indicator of which effect the consumer
behavior, especially the consistency of meat color and musculature. The other factors
that affected this kind of issue are various factors such as farm management,
pre-slaughtering process, pre-slaughtering, refrigeration and processing.
The purposes of grading meat and carcass classification are to set up a standard
system to estimate the characteristics of carcasses and to determine the carcass value by
these characteristics. A good standard and system classification not only reflect as the
need of the market, but also will urge the meat producers to improve the quality of meat
carcass and lastly it will become an approved design of meat quality grading based on
the result investigated.
In this study, the image processing technique and color recognition method are
used to analyze the samples images. A sample image is collected by photoelectric
technology. Image processing method for recognition of the color is applied for grading
3
1.3 Project Objectives
The main objectives of this research constitute of:
1. To develop a grading system for selecting the fresh meat and show the quality of
meat freshness based on meat color using unsupervised neural network.
2. To develop an online learning algorithms with the image processing and color
recognition process.
3. To develop MATLAB Graphical User Interface (GUI) as the centerpiece in the
recognizing colors system.
1.4 Scope of Project
This project consists of four main tasks which include:
1. The system grading is focused on detection of the meat freshness based on meat
color.
2. Introducing a visual-based color classification using machine vision system for
meat grading.
3. Designing the system grading for detection of the fresh meat using MATLAB
Graphical User Interface (GUI).
4. Hardware and software in this project are consist of:
Camera: Logitech webcam, resolution 1600x1200@30fps, 8mm
fixed focus, 2 Megapixel.
Personal Computer: windows operating system, processor Intel Core 2
Duo with 1.66Hz, 2GB memory, 160 hard disk and
Other: Two lamp shelves, tripod for webcam and USB cable.
1.5 Project Outline
The project is organized into five chapters. The outline is as follows:
First outline of the research is introduction. The introduction is describing what
this project is all about. Aside from that, there are also definition of proposed objectives
and scopes for this project, deciding the methods to conduct the study and developing
the plan of the project.
Chapter II deals with the literature review of the project. It describes the
definition, concepts, principles and tool used in this project. Literature review provides
a background of this project and also gives guidelines and direction in this research.
Chapter III is a research methodology. This chapter will describe the detailed
method that is used to conduct this research. There are also some explanations on how
the image processing is process and collection of current data.
Chapter IV is for the result and discussion. This chapter will highlight the
overall of the research outcomes with the results of the neural network. The results
consist of histogram, mean value of RGB and HSI image. The mean value is calculated
from the results of the RGB histogram. From this calculation, the meat grading system
can be simplified. The meat freshness then can be classified using the histogram and
mean value.
Chapter V consists of conclusion for this study. It also describe the problem
CHAPTER 2
LITERATURE REVIEW
2.1 Overview
This chapter is based on the reviews from the selected journal, articles, technical papers
and website. It will focus on the machine vision and using the MATLAB Graphical
User Interface (GUI) for classification and grading meat freshness.
2.2 Introduction
The possession and consumption level of meat product is a measure of a states and
important indicators of the quality of people life. The quality of meat product is
growing forward by grading it with the quality standards. Because of the change of idea
to life, people claim about health is becoming stronger. The desire to choose or instance
of fresh meat and green healthy food has become important.
Currently when buying a meat or carcass at a market, mostly freshness degree of
meat is grading manually by looking at the color of meat or a fat include on it. The first
impression consumers have on any meat product is its color thus color is the most
important aspect. In Malaysia, meat or carcass is subjectively graded by certified
inspectors from the government. The primary factor is to determine the quality of meat
and carcass according to the consumers.
The grading system for meat or carcass is by quantity of fat and a color.
carcass. This happens because of a practical system to inspect and grading a meat does
not yet exist. In order to help the food industry analyze and object the subjective
decisions of human testers, several devices had appeared and designed especially for
that purpose. The disadvantage with this alternative type of testing is what human’s
interpretation such as tastes and smells, machines will interpret them in a more
complicated and difficult way. The aim of this research is to devise a system such as
image processing and neural network which capable of interpreting the analyses made
by an electronic device and making the results of those analyses more easily
understandable for human experts.
Topology of freshness meat levels is according to the color of the meat itself.
System grading by rule algorithm is dividing the freshness level with pattern such as
very fresh, fresh, semi fresh, half-fresh and defective meat by color intensity at a meat
itself. The freshness level of meat is classified by a level of histogram and also a mean
value of image.
2.3 Meat Recognition and Image Processing
The detection methods of meat fresh degree are includes as following method: the
sensory detection, all kind of physiochemical detection, sanitation or microorganism
detection etc. Several researches have been carried out by Japanese students on
describing a method of determining meat quality using the concept of marbling score. A
research based on describing a method to determine a meats quality using the concept of
“marbling score” and texture analyses had been carried out before (Kazuhiko and his
team mates, 2000).
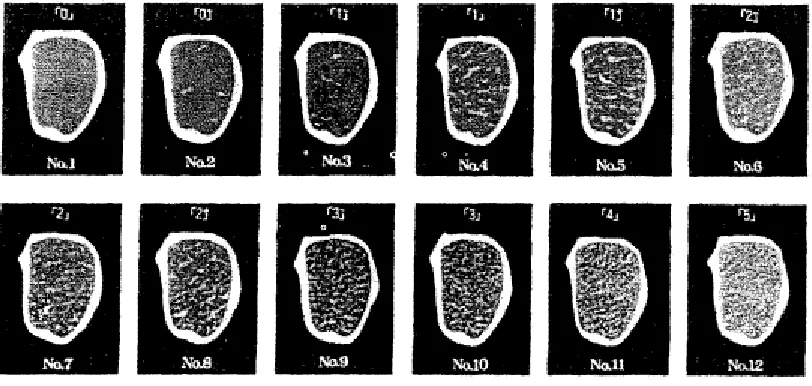
The study of marbling score is a measure of the distribution density of fats in the
rib-eye region. The system considered the marbling of meat as a texture pattern. They
use a grey level occurrence matrix as a texture pattern and make a standard texture
feature vector for each grade using it. In the grading by the marbling score, the
comparison of the meat with the standard images is the fundamental step. The marbling
7
rib eye region. From figure 2.1 shown the design of marbling concept, 12 standard
images which represent 12 grade of marbling. Professional graders decide the grade of
actual meat by comparing it with the standard images. The disadvantage using
“marbling score” or texture pattern recognition is when the grading is performed in a
refrigerator at a low temperature, this will make it difficult for grader to make a
[image:9.612.136.542.233.426.2]decision.
Figure 2.1: Beef marbling standard
According to this paper, the researchers have used the image processing with the
neural network technique and multiple regression analysis to examine the kind of image
input to the grading system and clarify that 4-bit monochromatic image that is sufficient
for accurate grading. Besides that, a method of binarization of the 4-bit meat image
using a three layer neural network developed on the basis of input given by a grader had
been proposed and a multiple regression equation for the determination of the grade
using the feature obtained with multiple regression analysis also had been formulated.
From the experiment result showed the proposed method to be effective and the
application of texture analysis for grading meat quality is a suitable example of the
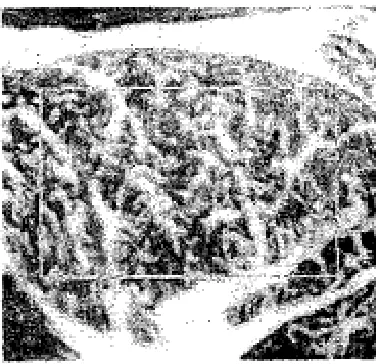
application of texture analysis. The researchers also used a “fat-pixel” and the
muscle has become a problem to the meat grading without a fats. Color of meat then
become more important judging with the grading system characteristic. Figure 2.2
[image:10.612.242.430.178.360.2]shows the 4-bit monochromatic image of Hough transform.
Figure 2.2: An example of 4-bit monochromatic image
Pattern recognition is one of the image processing methods which may help the
researches on finding the solution in grading the meat freshness. The author using
digital image processing technique to detect the plaque bacteria that taking Hough
Transform to extract complete outline of fat cell based on mathematical morphology
method (Guo peiyuan, Xiao hongbing, 2010). Sample image is collected for image
processing method to analyze the sample. As the sample is placed in the glass, the
sample is lighted from the bottom to avoid the result which reflection and refraction
from the glass effect image acquisition.
The Hough transformation is a kind of method that can feature point of the
image onto the parameter space so that the image point can be gained. This method
identifies the geometric figure from images and is widely used. If the shape of region
beforehand is known, Hough transformation is used to get the border and connect the
discontinuous point conveniently. The characteristic of Hough transform that the dish
9
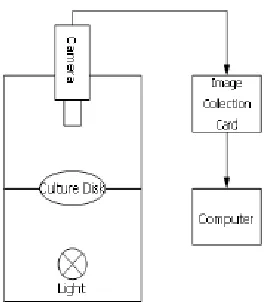
of the length of the entire image after Hough transform. Detection of the principle of the
round is described by the equation (x-x0)2+(y-y0)2=r, which consists of three parameter
[image:11.612.273.407.184.335.2]xn, yn, and r. The structure of image acquisition system is shown in Figure 2.3 below.
Figure 2.3: Image Acquisition System
2.4 Machine Vision
The process of color classification involves image extraction of useful information
concerning the spectral properties of object surfaces and discovering the best match
from a set of know description or class model to implement the recognition task (Ferhad
Sahin,1997). It is useful to simplify a monochrome problem by improving contrast or
separation. Color has been a great help in identifying objects for many years.
A visual-based color classification system is introduced to overcome the best
match and color identifying objects. This system is used in the industrial manufacturing,
as it can reduce dependency on manpower and hence increase production. Basically,
machine vision system is performing a four basic procedure. The image is capturing and
acquisition and image is processing in the computer centre. Then the image is analyzing
to get the information and will be interpreting to the image processing. The physical
elements in a vision system consist of a camera or sensor, lighting, a computer and
software. A camera is used to take the picture of the object being inspected. Lighting is
exposed. The computer is a key element of the machine vision system; a fast computer
will reduce the time needed for image processing. Machine vision software is used for
creating and executing routines, processing incoming image data and providing a
conclusive result (Ling Mei Chan and team, 2007).
2.5 Graphical User Interface (GUI)
Software development is highly important in this color classification system. The
MATLAB Graphical User Interface (GUI) is used in this study as the centerpiece of the
system in recognizing colors and displaying the results. The main function of the
program developed here is to calculate the histogram of Red, Green, and Blue (RGB)
colors in the captured image and calculate its mean values.
2.6 Color image processing
Color image processing is divided into two major areas: full-color and pseudocolor
processing. For full-color, the color typically is acquired with a full-color sensor.
Pseudocolor is one of assigning a color to a particular monochrome intensity or range of
intensities lighting. Hues is a color attribute that describes a pure color (pure yellow,
orange, or red), whereas saturation gives a measure of the degree to which a pure color
is diluted by white light. Intensity (gray level) is a most useful descriptor if the images
are monochromatic.
There are many different HSI transformations, one of them is given below. The
HSI color model represents a color in term of hue, saturation, and intensity. The RGB
component of an image can be converted to the HSI (Gonzales and Woods). The
intensity is represented by the average grey level normalized to 1:
11
The derivation of the formula for hue and saturation begins by removing intensity from
the RGB values:
(2.2)
(2.3)
(2.4)
In order to have the value for hue in the range from 0 to 360 degrees, it is necessary to
subtract H from 360 when B/I>G/I. It should be noticed that hue feature has an angular
representation from 0 to 255 after normalization. The lower values near 0 or 255
represent red pixels, value near 85 represent green pixels while values near 170
represent blue pixels. It has the property of being relatively unaffected by shadow
caused by the light source. The cosine of hue is:
(2.5)
The saturation is the ratio of the distances, dp/dq. Saturation also measures the degree of
purity of Hue. The formula for saturation is:
2.7 Conclusion
The literature review has shown that meat grading gives important benefit for
consumers and users when purchase or buying a fresh meat with a good quality.
Grading meat using image processing is focusing in color image processing method and
using GUI system that recognizing color and display the result, it become a medium for
grading a meat with an according specification. From this chapter, all the informations
CHAPTER 3
METHODOLOGY
3.1 Introduction
This chapter will gives further explanation about the method and the designing
procedure of this research.
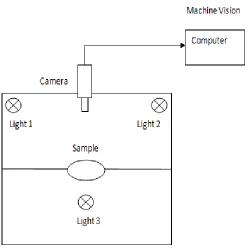
3.2 Experimental Design
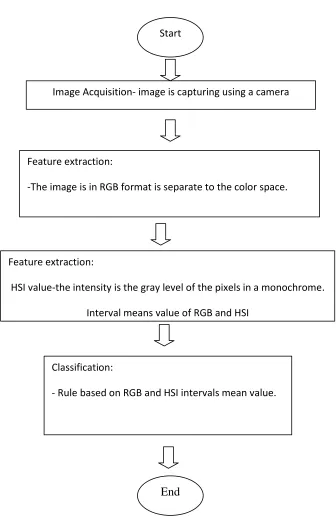
Figure 3.1 shows the flow chart that gives the overview of the grading meat freshness
system.The general design of block diagram for image acquisition using a camera and
computer as a machine vision with a light is shown in Figure 3.2. This design is for
capturing image and collecting data into personal computer. This data then will be
Start
Figure 3.1: Flow chart of system grading meat freshness overview Image Acquisition- image is capturing using a camera
Classification:
- Rule based on RGB and HSI intervals mean value. Feature extraction:
-The image is in RGB format is separate to the color space.
Feature extraction:
HSI value-the intensity is the gray level of the pixels in a monochrome. Interval means value of RGB and HSI
15
Figure 3.2: Block diagram of image acquisition system
3.3 Image Capturing
Webcam camera will be used in acquisition image and also to capture the meat data.
The images of the meat were first acquired using Webcam camera and saved in the lab
using a personal computer equipped with USB (Universal Serial Bus). CMOS camera is
used to capture the image which is detailed and consists of useful data. For this project
the sample is fixed and with additional time to capture an image, it gave benefits for
improving resolution and color accuracy of three shot color. Figure 3.3 below shows
when an image is captured with the image data, it will then be digitized first and sample
Figure 3.3: Image representation and image analysis
The raw images of meat are collected per days and the time periods are 24, 48
and 72hours. This means that there are total of 30 inputs per sample. Since there were 3
samples, the final data collections will be 270. Data are encouraged to be collected as
many as possible in order to make this recognition system more accurate. The raw
images are taken under different condition like the lighting and shadowing conditions
and from different angles. The size of the image taken is 640x480 pixels. The images
are then saved into the computer and will be used in the data analysis for meat
17
3.4 Sample Selection
The database consists of 3sample of meat, where 30 images are captured from them for
24, 48 and 72hour period of time. The total of data 3x30x3 is 270 images. Meat sample
is purchased at Parit Raja market area and has been cut into slices and each weighed
10mg. As the sample is placed in the sample glass, it is lighted from two light bulbs to
avoid the reflection and refraction from the glass that will affect the image acquisition.
The size of the image acquisition is 640 x 480 pixels.
3.5 Image Processing
All the images were transferred to a computer workstation for further processing. The
value of gray degree can be collected through this system during the course of meat
classification. The color and luster are determined by the quantity of muscle-red protein
and also the color of the meat itself because color is the meat’s first impression for
customers. It is best that the meat is Cerise and luster. The color of meat can well
manifest its characters.
During the store of meat, its color and luster will change easily with the
freshness level of meat. Fresh meat is red in color compared to the hypo-fresh meat
which is gray. Degenerative meat is henna and no luster. The change of color and luster
of meat can be reflected through the change of the gray level. The change of freshness
level then can be identified through the change of the gray level. From this gray level,
the characteristic of the freshness is design according to the class of gray level.
3.6 Hue, Saturation and Intensity (HSI) Transform
The hue, saturation and brightness of a light beam are often specified using a
three-dimensional color tree, as shown in Figure 3.4. The vertical axis of the tree specifies the
intensity of the beam, from nothing at the bottom (that is, black) through gray to some
At each level of the tree (which corresponds to a given lightness or brightness),
by drawing a circle whose circumference shows the various pure, fully saturated,
monochromatic colors of the rainbow in wavelength order from red to violet. The points
on a radius line from the center of the tree to some point on the circumference represent
different unsaturated colors formed by mixing some amount of white from the center of
the tree with some amount of the color at the end point of the line. From this three
[image:20.612.271.412.258.437.2]dimensional, the calculation of value HSI is used to convert the value of RGB.
Figure 3.4: Three dimensional color tree
3.7 Meat Classifications
About 270 samples of meat for image analysis were prepared and have been bought
from the market and slaughtered. The test is carried out at area of Parit Raja and Batu
Pahat, Johor. This image analysis has been carried out with two parts, which the first
240 images are used in the color analysis of meat based on histogram of classification
of meat freshness. The second group with the remaining 30 of the images was used for
19
System of image collection
The generally classification of fresh meat is too simple to meet the producers
practice requirement. More detailed according to the meat freshness grade classification
would play a significant guiding or role model in the real application. The system
measures the change of value H, S and I during the idea of meat freshness classification.
This change of the meat color is measured through the picture collection system
based on camera and measured accurately the content of gray level test. The value of H,
S, and I are treated as input signal. The identification of meat freshness is through GUI
system. The flow chart of system is shown in Figure 3.5 below.
Figure 3.5: The identification flow chart of the fresh degree classification
The idea is that under a fixed or control temperature for instance room
temperature. The data is collected once at every half an hour. The experiment is done
repeatedly until the data is complete. The data is imported into GUI system to analyze
the mean values, from this method the freshness level of meat can be known.
Classification of meat freshness Image
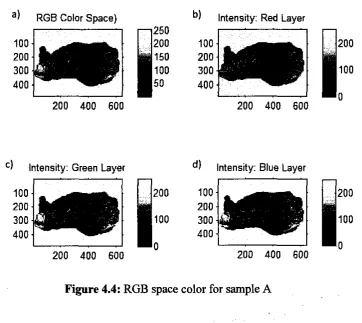
The samples of meat A is selected and is categorized to three days, which the A1 is for the sample to the fust day of images, were captured. A2 represented the data of images captured on second day and A3 is the data sample for images captured on the third. The sample of meat A, then analyze and the results of the experiment have been shown in the figure 4.4. The figure 4.4, represents the example of the images to the RGB after image processing and image extraction is done to get the information kom the images.
a) RGB Color Space) b, Intens~ty: Red Layer
C) lntens~ty Green Layer Intensty. Blue Layer
100 200 100 200
200 200
300 100 300 100
400 400
0 0
200 400 600 200 400 600
Figure 4.4: RGB space color for sample A
[image:26.599.121.484.284.607.2]