Unrestrained Multiple-Sensor System for
Bed-Leaving Detection and Prediction
Hirokazu Madokoro
∗,
Nobuhiro Shimoi
,
Kazuhito Sato
Faculty of Systems Science and Technology, Akita Prefectural University 84–4, Tsuchiya Aza Ebinokuchi, Yurihonjo City, Akita, 015–0055, Japan
Copyright c⃝2015 by authors, all rights reserved. Authors agree that this article remains permanently open access under the terms of the Creative Commons Attribution License 4.0 International License
Abstract
This paper presents an unrestrainedsen-sor system that analyzes predictive behavior patterns that occur when a patient leaves a bed. Our system comprises three sensors: pad sensors installed under a bed mat, a pillow sensor to detect head movements, and a bolt sensor mounted to a bed handrail. We used a triaxial accelerometer for a pillow sensor and piezoelectric elements for the pad sensors and bolt sensor. The salient features of these sensors are their easy installation, low cost, high reliability, and tough-ness. Moreover, we developed a method of recognizing bed-leaving behavior patterns using machine-learning algorithms from signals obtained using the sensors. We evaluated our system by examining ten subjects in an environment representing a clinical site. The mean recognition accuracy for seven behavior patterns was 75.5%. Furthermore, the recognition accuracies for longitudinal sitting, terminal sitting, and left the bed were 83.3%, 98.3%, and 95.0%, respectively. In contrast, falsely recognized patterns remained inside of respective categories of sleeping and sitting. We believe that our system is applicable to an actual environment as a novel sensor system with no restraint of patients.
Keywords
Bed-Leaving, Machine Leaning,Piezo-electric elements, Accelerometer, and Quality of Life
1
Introduction
Along with the longevity of the society, labor short-ages will become severe, especially at nursing-care fa-cilities [1]. Few caretakers must care for numerous aged patients. For this situation, caretakers monitor them in-adequately, especially during sleep at night [2]. Mitadera et al. reported that approximately half of accidents are falling or tumbling among aged patients [3]. Numerous accidents occurred when they leave their bed. More-over, these accidents occurred in a place where caretak-ers are hard to keep their eye on. The accident rates of tumbling and falling were 83.3% and 85.4%,
respec-tively, when they were not supported at the moment of accidents. For protecting these accidents, it requires suitable provision after conducting assessments for re-spective patients. One approach to this problem is to use bed-leaving sensors that signal when patients leave from their beds. They can be used to prevent falling from their beds. The number of hospitals and nursing-care facilities using these sensors has increased [4, 5].
in-stalled on a bed can detect bed-leaving with higher re-liability than other mat sensors. However, existing mat sensors are actuated by a binary response similar to that for clip sensors. Early detection is not realized, espe-cially in the initial stage of bed-leaving behavior.
Using a camera as a bed monitoring sensor can pro-vide a low-cost system. Moreover, it can obtain much information for a subject. However, it is a challenging task to predict behavior patterns obtained from images, even when state-of-the-art computer vision technologies are used. For this method, medical staff members must observe images directly. It is impossible to monitor nu-merous subjects simultaneously with a few operators. Moreover, we must consider aspects of human rights and quality of life (QOL). Especially, it is impossible to recognize behavior patterns related to bed-leaving using only sensor responses, even when detailed analyses are conducted, because behavior patterns differ among peo-ple [9]. Moreover, monitoring using a camera imposes a mental load on patients because they feel as though they are under surveillance all day and all night.
For solving these problems, this paper presents an un-restrained sensor system that analyzes predictive behav-ior patterns that occur when a patient leaves a bed. We developed a machine-learning-based method that obvi-ates the setting of thresholds in advance. Moreover, we developed an integrated system that can send data ob-tained from sensors to a monitoring computer using a close-range wireless module. Our former approach re-mained a problem for reliable detection and prediction because we merely used only pad sensors [10]. For this paper, we propose a novel multiple-sensor system to im-prove accuracy according to a usage of a target. We intend to reduce the amount of data used for predicting and minimizing incorrect recognition given a minimum number of sensors. We evaluated our sensor system in an environment that represents a clinical site. Results show that our method predicted seven behavior patterns related to bed-leaving, especially for longitudinal sitting and terminal sitting.
2
Related Work
Large-scale systems using numerous sensors of various types have been proposed for prediction at the initial stage to measure behavior patterns in detail. Shimizu et al. proposed a bed-leaving detection system using ul-trasonic array sensors [11]. They evaluated their system at a hospital as a demonstration experiment. Hirasawa et al. proposed a method to expose infrared rays to the upper part of the bed as a system to prevent falling acci-dents [12]. Uezono et al. proposed a large-scale monitor-ing system for detectmonitor-ing bed-leavmonitor-ing behavior patterns using 96 strain gauges assigned for a reticular pattern [13]. These large-scale sensor systems can realize higher accuracy and more stable detection than low-cost sen-sors, such as clip sensors or mat sensen-sors, can. However, these sensors are not put into practical use because of their cost. Moreover, high expenditures are necessary to replace a bed or for construction for installation when-ever these systems are improved for practical use in a market.
Hatsukari et al. developed a bed-leaving detection system using strain gauges installed inside of actuators to obtain weight changes of a person on a bed [17]. They embedded sensors and a controller to Paramount beds as a new product of their company Paramount Bed Co. Ltd. The detection accuracies for longitudinal sitting and terminal sitting were, respectively, 87.0% and 98.1% [17]. For their system, three actuators are used in a bed. Each actuator has four biaxial strain gauges installed on diagonal lines. We regard this as the most popular bed-leaving sensor system in practical use currently. It has both high performance and reliability. However, an im-portant limitation of this system is that it is used only for the lifting beds of that company’s products with in-stalled actuators. Moreover, it is necessary to install sen-sors into actuators at the manufacturing phase of beds. Therefore, users must buy it if they need to use this function of bed-leaving detection. These are not casu-ally used sensors that can be installed later. In addi-tion, strain gauges used for this system have uncertain response to thermal changes. For characteristic vari-ation caused by thermal changes, they described that they accommodated it with software. Moreover, this system requires that the weight setting of a person to be selected from three divisions in advance.
Kishimoto et al. proposed a method to predict poses using a capacitance triaxial acceleration sensor to detect transition points in sleeping automatically [18]. For au-tomatic detection of pose transition points, they used threshold-based processing to apply first derivation to sensor outputs. Using k-means as a non-hierarchical clustering method for pose prediction, their method de-tected five behavior patterns: face-up sleeping, right sleeping, left sleeping, face-down sleeping, and sitting. For their evaluation experiment using datasets obtained from 13 subjects, the mean recognition accuracy was 90.96%. However, it is necessary for restriction because this sensor is installed near the epigastric fossa. Regard-ing clinical applications as the conditions of actual use, we consider that it is difficult to assent to wearing the sensor. Moreover, they set thresholds empirically for detecting behavior transition points. We consider that maintaining accuracy while absorbing individual differ-ences is a challenging task.
Regarding quality of sleep (QOS), Imoto et al. mea-sured body motion during sleeping using a watch-shaped triaxial acceleration sensor. Their method detected body motion at one minute intervals in bandpass sig-nals of 2–3 Hz acceleration changes using the thresh-old of ±0.01 G. They evaluated the method for one week using datasets obtained from six subjects in their 50s who were diagnosed as needing daily life guidance. Their method recognized sleeping or arousal for time-series active mass datasets. They used experimentally obtained results for each subject to assess sleeping pa-rameters quantitatively. However, the results failed to demonstrate a global tendency in light of relations to the number of temporary arousals during sleep. Moreover, we regard that this watch-shaped sensor decreases QOS when worn on an arm during sleeping because its use requires that a subject be restrained.
accel-(a) Upper view (b) developed sensors
PET Piezoelectric film +
-
PET Piezoelectric film +
-
[image:3.595.303.533.53.137.2]φ
70
mm
Figure 1. Design and prototype of pad sensors.
eration sensor in a comforter cover [20]. This system was constructed to measure the heart rate of a subject during sleeping. Near the position of the heart in a sub-ject, this sensor was stitched to the surface of a cover on the upper-left chest region. The acceleration sen-sors using piezoelectric ceramics have advanced sensi-tivity. They obtained measurement results resembling the waves of an electrocardiogram (ECG) during face-up sleeping under resting status. The signal peak of acceleration changes was obtained in the corresponding position of the R wave on the ECG. Moreover, the sig-nal peaks, which were similar to peaks of the R wave, were counted to assess the side sleeping behavior. The compact sensor weight was only 4 g. We regard this system as also requiring amplifier circuits and A/D con-vertors to capture signals for processing in a computer, but their paper veiled many details of the system. We regard wiring of the sensor to a comforter cover as a remaining obstacle to practical use of this device.
3
Multiple sensor system
[image:3.595.55.273.54.153.2]High-performance and functional sensors of various types were used for existing bedside monitoring sys-tems for targeting expensive care or medical treatments [11, 12, 13]. Alternatively, it is necessary to attach them to the body to realize steady and long-term monitoring [19, 20]. For this study, we designed a sensor system that is practical, convenient, inexpensive, and simple. We specifically examine the following features: 1) a bed mat to distribute the body weight of a subject directly, 2) a pillow to distribute the weight of the head, and 3) a handrail that a subject can grip while standing imme-diately before leaving. For multiple sensing, our system comprises following three sensors: 1) a pad sensor under the bed mat, 2) a pillow sensor to detect acceleration according to head movements, and 3) a bolt sensor used for a connecting a point of a handrail. We explain fea-tures in each sensor and the overall system architecture as the following.
3.1
Pad sensor
Our originally developed plate-shaped sensors can be installed easily under a bedsheet. Fig. 1(a) depicts the design structure and an overview photo of our prototype sensors [14]. The shape of pad sensors is roundness be-cause it can detect wight changes from all directions. As a prototype, we used piezoelectric piezoelectric films by Measurement Specialties Inc [21]. We fixed a
piezoelec-Battery
Sensor board
Sensor board
(b) Installed in the case (a) Sensor board and battery
Battery Cap
Figure 2. Sensor board, Lithium-ion polymer battery, and their storage capsule. The sensor board and capsule are originally de-veloped for this study.
105 mm φ55 mm
Figure 3. Design of the capsule stored for a microprocessor board with an accelerometer and a battery.
tric film between two polyethylene terephthalate (PET) plates of laminated polyester. The polyester and PET plate sizes were, respectively, 125µm andϕ70×0.5 mm. Figs. 1(b) depicts the design structure and an overview photo of our prototype sensors.
Output voltage is generated from the bent piezoelec-tric films when a subject transfers body weight on the bed.This sensor can measure recursively because the reference potential is offset when the bending stops. Moreover, the strength of weight according to changes of the body is obtainable linearly because the bend of the piezoelectric film and output voltage has a relation of proportionality. Furthermore, piezoelectric films are less troublesome and provide no false operations because they have simple wiring without electric power supply for measurements. Additionally, we can provide a low-cost system requiring no maintenance related to replace-ment of a battery.
3.2
Pillow sensor
For our pillow sensor, we developed a triaxial accelera-tion sensor module MMA7361LC produced by Freescale Semiconductor Inc. Fig. 2(a) depicts the exterior of our original board. Herein, we evaluated basic characteris-tics of this sensor module though our former study of attitude control for a flying robot [15].
Copper Braid Polyethylene OuterJacket
Stranded
Center bore VF2 PiezoelectricFilm (Spiral Wrap)
(a) Inside structure (b) Developed sensor
Figure 4. Design and prototype of bolt sensors.
P ill ow S en so r
Partition
2
1 4
3 5 Handrail
A/D memory
MPU ZigBee Assignment of Sensors
Sensor Board Handrail
[image:4.595.330.534.53.158.2]Bolt Vibration Sensor 6
Figure 5. Block diagram of our proposed system and assign-ment of our developed sensors on the bed. The symbols of 1–6 correspond to the sensor assignment of S1–S6.
3.3
Bolt sensor
We use a bolt sensor for the joint between a bed and a handrail. We assume that this sensor conducts overall sensing of a bed, whereas pad sensors are used for par-tial sensing of a subject. Moreover, this sensor detects weight changes that occur when a subject tries to stand up and grip a handrail. Fig. 4(b) portrays a bolt sen-sor that we developed as a prototype. This sensen-sor was developed originally by Shimoi et al. [16] as a simple sensor to measure bridge strain. This sensor has been commercially available for some time. For this study, we originally developed a sensor with ϕ=10 mm to fit the size of the bolt to the joint of the bed used for our evaluation experiment.
Fig. 4(a) depicts the sensor structure. We inserted a piezoelectric cable into hollow polyurethane resin. Sub-sequently, we attached a bolt-shaped adapter as a cover for the exterior. Using this adapter, the bolt sensor can be connected to a nut. We extracted wires to obtain sensor signals, although no electric power source is nec-essary for piezoelectric cables. The datasheet shows that piezoelectric cables generate voltage linearly according to bending. Moreover, we confirmed this feature through our preliminary experiment and earlier experiments re-ported by Shimoi et al. [16].
[image:4.595.68.294.54.134.2]3.4
system structure
Figure 5 portrays the entire structure of our sensor system that we originally developed for this study. Our system comprises six pad sensors installed over the bed, one bolt sensor mounted on the joint part between a handrail and a frame of the bed, and one pillow sensor: an acceleration sensor installed inside of a pillow.
The assignment of six pad sensors is S1 and S2 for the shoulder part, S3 and S4 for hip part, and S5 and S6 for the terminal part. We assigned these six sensors
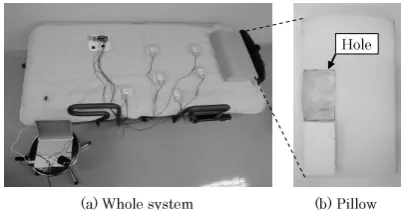
(b) Pillow
(a) Whole system
Hole
Figure 6. Photographs of the bed and pillow used for this study.
referring to the literature related to the development of a monitoring system for users of welfare care beds [4, 5]. We mounted a bolt sensor to the joint of a handrail on one side of the bed. The size of the bed used for this experiment is 210 cm long, 100 cm width, and 70 cm height. This bed has an actuator for reclining the back pannel. For this experiment, we did not use this function.
We used a commercially available pillow for embed-ding the sensor. This low-resilience urethane pillow pur-chased from Nitori Co. Ltd. was 50 cm wide, 31 cm deep, with 9 cm height. We cut out the back side of the pillow shown in Fig. 5(b) to produce a void space to in-sert the sensor case. We fixed the sensor case with three points using a hook and loop fastener to prevent rolling inside the pillow. One advantage of our sensor system is its easy installation as an aftermarket add-on part, although it is necessary to open a pillow and partially empty it during repairs. Moreover, the sensor system requires no calibration. Regarding the place to store the sensor, we were concerned that it would feel uncomfort-able or decrease the feature of cushioning when putting the head to the pillow. Subjects participating in the experiment reported no negative impression from using this pillow.
The primary feature of our system is that it real-izes monitoring using unrestrained sensors. We consider QOL for a patient to live life normally. Our system requires no supervision using infrared cameras or con-straining sensors such as clip sensors. Moreover, we can create a low-cost system using piezoelectric films as sen-sors that can function with little trouble or missed oper-ations, and with remarkable characteristics for pressure resistance. This board obtains output voltage from each sensor for wireless communication. We developed this board using Open Source Hardware ArduinoFIO. With consideration of power consumption, we used short-range wireless communication standard ZigBee commu-nicated with a monitoring terminal computer. Measured signals are displayed to a monitoring computer in real time. We embedded our method based of machine learn-ing to this software for bed-leavlearn-ing prediction.
4
Prediction Method
4.1
Target behavior patterns
be-(1) Face-up sleeping (FU)
(2) Right sleeping (RI)
(3) Left sleeping (LE)
(4) Longitudinal sitting (LO)
(5) Lateral sitting (LA)
(6) Terminal sitting (TE)
(7) Left the bed (LB)
Figure 7. Photographs of target patterns in each body position on the bed.
havior patterns from the responses of six sensors. The sleeping comprises three patterns: face-up sleeping, left sleeping, and right sleeping. The sitting comprises three patterns: longitudinal sitting, lateral sitting, and termi-nal sitting [24]. The total prediction target is to pro-duce seven patterns including leaving. Fig. 7 depicts photographs in each pose for the target behavior pat-terns. The following are features and estimated sensor responses in each pattern.
1. Face-up sleeping (FU): a subject is sleeping on the bed normally to the upper side of the body. 2. Right sleeping (RI): a subject is rolling over on
the bed to the right side.
3. Left sleeping (LE): a subject is rolling over on the bed to the left side. These three patterns occur as sleeping behaviors. The following are the target patterns of bed-leaving prediction.
4. Longitudinal sitting (LO): a subject is sitting longitudinally on the bed after rising.
5. Lateral sitting (LA): a subject is sitting laterally on the bed after turning the body from longitudinal sitting.
6. Terminal sitting (TE): a subject is sitting in the terminal position on the bed trying to leave the bed. Rapid and correct detection are necessary because of the terminal situation for leaving the bed. 7. Left the bed (LB): a subject is left the bed.
Herein, sensor responses disappear in the status of
・・・
(a) Self-Organizing Maps (b) Counter Propagation Networks Input
Layer Mapping Layer
Grossberg Layer
Figure 8. Network architecture of SOMs and CPNs.
losing consciousness or a life crisis such as cardiopul-monary arrest. For such circumstances, monitor-ing devices such as electrocardiographs are used. Therefore, such circumstances are beyond our pre-diction targets.
Longitudinal sitting is just a behavior pattern by which a subject sits up. In numerous cases, subjects will return to sleeping. In lateral sitting, a subject will move to leave from their bed because they move to turn the body to the terminal. Therefore, our system must de-termine lateral sitting immediately to predict a subject leaving the bed. Moreover, rapid and correct detection is necessary because of the terminal situation for leaving the bed if a subject moves to longitudinal sitting. We consider that our system can protect patients from in-jury or accidents caused by falling from the bed because it can detect such phenomena before a subject leaves completely.
4.2
Preprocessing
Actually, original signals include much more noise, which decreases the recognition accuracy and increases calculation costs. As a method to remove noise signals, filters set by thresholds have been used widely for pre-processing. However, calibration or resetting is neces-sary according to a target because thresholds are set subjectively or empirically in most cases. Moreover, it is a difficult task to absorb characteristic variation of sensors used only for fixed thresholds. For targeting hu-mans as a measurement objective, individual variations have strong effects.
To set a body weight of a subject in advance is com-monly used as a solution against this problem [17]. The load changes are strongly related to body weight. We consider that it is insufficient for calibration used only for body weight because behavior patterns vary among sexual and age differences. In contrast, we are aim-ing at developaim-ing an approach for bed-leavaim-ing predic-tion without setting thresholds in advance. For this study, we use machine-learning algorithms dealing with individual differences among subjects. Nakamura et al. described the effectiveness for adaptation of individual differences using machine-learning methods [23]. Simi-larly, our method is necessary without setting thresholds through learning patterns in each subject from original signals obtained using sensors.
of input data through the process of learning. Based on the concept of neighborhood and competitive learning, SOMs create clusters using self-mapping characteristics of unsupervised learning. Using the advanced calcula-tion performance of computers, SOMs have facilitated various applications such as remote sensing, facial im-age processing, and character recognition. For actual applications, SOMs are validated as effective and supe-rior performance through various existing studies [26].
Actually, k-means [27] is widely used for unsupervised-learning based clustering. Vesanto et al. validated that SOMs have superior performance to that of k-means through their experiments [28]. Moreover, Terashima et al. demonstrated that false recognition accuracy of SOMs decreased to the min-imum compared with k-means used for clustering. Therefore, we used SOMs because of these benefits.
Fig. 8(a) depicts a network architecture of SOMs. The network comprises two layers: an input layer and a mapping layer. Units on the input layer are assigned as the number of features of input data. We set two units because we used a triaxial acceleration sensor for this system. The mapping layer consists of units in a low-dimensional space. In our method, we assigned mapping units for one dimension because we used it for vector quantization on clustering. Learning is conducted to burst a unit on the mapping layer when a set of input signals is given.
The learning algorithm of SOMs is the following. wi,p(t) are weights from an input layer uniti(i= 1..., I) to a mapping layer unitp(p= 1..., P) at timet. These weights are initialized randomly before learning. The Euclidean distance dp between xi(t) and wi,p(t) is cal-culated as
dp=
v u u t∑I
i=1
(xi(t)−wi,p(t))2. (1)
The unit for which dp is the smallest is sought as the winner unitc.
c= argmin(dp). (2) The neighborhood regionNp(t) aroundc is defined as
Np(t) =S
( 1− t
O )
. (3)
Therein, S (0 < S ≤ P) is the initial size of Np(t); O is the maximum iteration for training. Subsequently, wi,p(t) ofNp(t) are updated to close input feature pat-terns.
wi,p(t+ 1) =wi,p(t) +α(t)(xi(t)−wi,p(t)). (4) Therein,α(t) is a learning coefficient that has decreasing value with the progress of learning as
α(t) =α(0) (
1− t O
)
, (5)
where α(0) (0< α(0)≤1.0) is the initial value. In the initial stage, the learning speed is fast when the rate is high. In the final stage, the learning converges while the rate decreases.
During the learning phase, the process above is re-peated until O to pick up from training datasets for random sampling. After learning, training datasets are presented again to the network for searching burst units. These units interpret labels against training datasets and share the same labels as clusters. Herein, for our sensor system using piezoelectric elements, output volt-ages near the offset are given when no load is changed. The range around the voltages is mapped to numerous signals. We can estimate the appearance of a unit that corresponds to the maximum number of signals on the category map. Therefore, we can select invalid signals that are necessary for recognition to remove invalid sig-nals corresponding to the unit.
4.3
Recognition method
After removing noise from original signals, we rec-ognize behavior patterns using supervised learning-based methods. The purposes of supervised learning and unsupervised learning are to acquire information representation[31] and to create mapping relations[30]. Popularly used methods for supervised learning are Sup-port Vector Machines (SVMs), which provide advanced performance with mapping to a high dimensional space using a kernel function, or Boosting, which is a method combining numerous weak learning machines. For this study, we use Counter Propagation Networks (CPNs) [32], a supervised learning algorithm to be expanded based on SOMs of unsupervised learning.
We use CPNs, not SVMs or Boosting, because of the following two features. 1) The learning algorithm is easy to implement for inserting a Grossberg layer to SOMs that we used for preprocessing. 2) Relations among sig-nals are visualized though the process of creation of map-ping structures. We describe formulas of the learning algorithms on CPNs in different parts of SOMs. Visu-alization of relations among signals is actualized on a category map [26]. We particularly present visualiza-tion of results obtained using figures at the evaluavisualiza-tion experiment.
The CPNs proposed by Nilsen [32] contain the net-work structure to append a Grossberg layer, which is given teaching signals, as the third layer. Fig. 8(b) depicts the network architecture of CPNs. The input and mapping layers of CPNs are similar to SOMs. The Grossberg layer is assigned to the counter position of the input layer. For this study, we selected the two-dimensional mapping layer for visualization of similarity among features of input data.
The CPN learning algorithm is the following. The algorithm from presenting input data through updat-ing weights after searchupdat-ing the winner unit c consists of the similar procedure of SOMs. However, weights and neighborhood regions are changed respectively to wi,p,q(t)(p = 1..., P, q = 1..., Q) and Np,q(t) because of the use of a two-dimensional mapping layer. Thevj,p,q(t) are weights from a Grossberg layer unit j (j = 1..., J) to a mapping layer unit (p, q) (p= 1..., P;q= 1..., Q) at timet. vi,p,q(t) and its neighborhood units insideNp,q(t) are updated based on the following Grossberg learning algorithm.
whereTj represents teaching signals. Similarly toα(t),
β(t) is a learning coefficient that decreases its value with the progress of learning as
β(t) =β(0) (
1− t O
)
, (7)
whereβ(0) (0< β(0)≤1.0) is the initial value. Finally, as the maximum value ofvj,p,q(t) for the Grossberg layer unitj, label Lj(t) is searched for the following.
Lj(t) = argmax
1≤j≤J
(vj,p,q(t)). (8)
After labeling all units, a category map is created as a learning result. Subsequently, datasets for testing are given to the network. A mapping layer unit is bursted as the minimum of the Euclidean distance in the formula (1). Results of CPNs are presented for corresponding labels.
5
Experimental results
5.1
Experimental setup
[image:7.595.292.539.52.482.2]We set up an experimental environment similar to a clinical site for evaluation of our developed sensor sys-tem. We used a bed depicted in Fig. 7 with a sub-ject. For this study, the number of subjects is ten persons: Subjects A–J. As attribute information, the body weights of the subjects are from 50 kg though 80 kg. They repeated the behavior sequences of seven pat-terns for five times. Therefore, we obtained 35 pattern datasets in each subject. Each behavior is switched in 20 s intervals. We set the sampling rate for capturing signals to 50 Hz. Herein, the number of subjects of our former study was only three persons [14].
Table 1 portrays setting parameters used in SOMs and CPNs. We determined these values based on our former study [33] and the literature by Hosokawa et al. [34]. As an evaluation method, we use leave-one-out Cross Validation (CV) [35]. For this experiment, four datasets and the remaining one dataset were used, respectively, for training and testing. Therefore, we evaluated our method for five combinational patterns in each subject.
5.2
Measured signals
Fig. 9 depicts output values of time-series signals ob-tained from nine sensors. The vertical and horizontal axes respectively depict the output voltage and transi-tion time. The dashed lines depict boundaries of each behavior pattern. Output signal pattens differ in each subject.
For pad sensors, the range of output voltage on S1 though S4 was expanded, especially in the status of face-up, right, and left sleeping. Salient output voltages were given from S5 and S6, although they include some noise. The output voltage on S3 becomes high for longitudinal sitting. We consider that the body weight is concen-trated to the hip area according to the rising behavior. For terminal sitting, the output voltage was given from S5 and S6. No output voltage was given from S1, S2, and S3. Moreover, S4, which is located near S5, gave
-100 -50 0 50 100
0 10 20 30 40 50 60 70 80 90 100 110 120 130 -1.5 -1.0 -0.5 0.0 0.5 1.0 1.5
0 10 20 30 40 50 60 70 80 90 100 110 120 130
-1.5 -1.0 -0.5 0.0 0.5 1.0 1.5
0 10 20 30 40 50 60 70 80 90 100 110 120 130
-1.5 -1.0 -0.5 0.0 0.5 1.0 1.5
0 10 20 30 40 50 60 70 80 90 100 110 120 130
Acc. X
Acc. Y
Acc. Z
FU RI LE LO LA TE [sec]
[m /s 2] LB [m /s 2] [m /s 2] -5.0 -2.5 0.0 2.5 5.0
0 10 20 30 40 50 60 70 80 90 100 110 120 130 140
-5.0 -2.5 0.0 2.5 5.0
0 10 20 30 40 50 60 70 80 90 100 110 120 130 140
-5.0 -2.5 0.0 2.5 5.0
0 10 20 30 40 50 60 70 80 90 100 110 120 130 140
-5.0 -2.5 0.0 2.5 5.0
0 10 20 30 40 50 60 70 80 90 100 110 120 130 140
-5.0 -2.5 0.0 2.5 5.0
0 10 20 30 40 50 60 70 80 90 100 110 120 130 140
-5.0 -2.5 0.0 2.5 5.0
0 10 20 30 40 50 60 70 80 90 100 110 120 130 140 [V ] [V ] [V ] [V ] [V ] [V ] [m V] S3 S5 S6 Bolt S1 S2 S4
Figure 9. Time-series changes of sensor output in each behavior pattern (Subject A, first trial).
output voltage slightly. After leaving the bed, no out-put voltage was given from any sensor.
For the pillow sensor, the Z axis output of the upper and lower directions is greater than that of either the X or Y axis. Apart from the pillow, the output became small during longitudinal sitting after raising of the body of the subject. This tendency is similar to that of lateral sitting. For terminal sitting, the sensor output became wide because the subject tried to stand up at the termi-nal of the bed. We consider that this widening of output results from the behavior by which the subject tried to grip the safety handrail. Moreover, we consider that the weight shift at the bed terminal produces severe shaking all over the bed compared with that occurring around the center.
The signal outputs of the bolt sensor is presented only the terminal sitting. The bolt sensor captures slight strain. The width of output signals is ±0.1 V. The signal-noise rate is high compared with other two sen-sors.
Table 1. Setting values of parameters on SOM and CPN for this experiment.
Method I J P Q S α(0) β(0) O [epoch]
SOM 10 – 10 – 16 0.5 – 1,000,000
CPN 10 7 20 20 16 0.5 0.8 100,000
0 5,000 10,000 15,000 20,000 25,000 30,000
6 10 15 16 18 3 8 5 7 12 2 4 17 13 14 19 9 11 1 0
Burst unit
N
u
m
b
er
of
d
a
[image:8.595.66.286.150.238.2]ta
Figure 10. Histogram of classfication results obtained using SOM.
-0.5 0.0 0.5
0 10 20 30 40 50 60 -0.5
0.0 0.5
0 10 20 30 40 50 60
(b) After removing noise using SOM
(a) Original signal values [sec]
[sec]
[m /s
2]
[m /s
2]
Figure 11. Noise removing result using SOM (Pillow sensor, X axis).
subject and each trial. Therefore, it is a challenging task to set thresholds for removal of noise or for recognition solely from original signals. In contrast, our machine-learning based method can execute the following process automatically.
5.3
Noise removal results
For improving recognition accuracy and to reduce pro-cessing costs together, we removed noise patterns using SOMs. Fig. 10 portrays a clustering result of train-ing datasets ustrain-ing SOMs. The horizontal and vertical axes depict the position of a burst unit and the number of burst iterations, which correspond to the number of datasets in each unit. We sorted a unit’s numbers ac-cording to the maximum of the bursting iterations from the left side. Most output voltages remained near the offset value shown in Fig. 9 because no output voltage when no load change is given without bending.
In Fig. 10, the sixth unit corresponds to this unit. For this case, 25,954 signals were mapped to the unit that corresponded to 74.2% for all data of 34,976 signals. Other signals of 15.8% were mapped to the remaining 19 units, similar to a long-tail shape. We confirmed that this tendency was obtained in other cases when we changed the number of units.
Fig. 11 portrays signal patterns of the X axis from the pillow sensor during the first 70 s period after removing signals mapped into the sixth unit. As the whole ten-dency, noise signals around ±0.1[m/s2] were removed
using our method. However, the signals around 60 s
with higher amplitude were removed, while those with smaller amplitude were remained.
5.4
Recognition results
Fig. 12 depicts category maps of Subjects A, B, and C created as classifiers. The numbers on the category maps correspond to respective behaviors that were la-beled though learning. Distributions of labels differ among subjects. Each category map created clusters of similar labels for similar behaviors.
We divided boundaries of units on the map with thick lines to depict segments of sleeping, sitting, and leav-ing, which are the global changes of behavior patterns. Similar behavior patterns created recognizable regions of behaviors. Units that are assigned to the seventh label as left from the bed are distributed in the cluster of units labeled sitting. We inserted dash marks in this figure to the label each subject. Using CPNs, our method created a classifier in each subject through learning. Moreover, our method enables visual confirmation of the relations among datasets.
Subsequently, we evaluated our method to recognize bed-leaving behaviors from matched labels that corre-spond to burst labels after presenting test datasets to the category maps. Table 2 portrays a result of recogni-tion accuracy. We evaluated five combinarecogni-tions for CV. Herein, we calculated the recognition accuracy as a ratio of the number of ground truths and the number of labels in each behavior pattern that reached the maximum of responses during 20 s.
The mean recognition accuracy for ten subjects is 75.5%. The recognition accuracies of Subjects B and E are, respectively, 88.1% and 59.5% as the highest and the lowest. For respective behaviors, the recognition accu-racy of leaving is 95.0%. The recognition accuaccu-racy of lat-eral sitting remained at 53.3%, although the recognition accuracies of longitudinal sitting and terminal sitting, which are the most important positions for bed-leaving detection, reached 83.3% and 98.3%, respectively. For lateral sitting, the recognition accuracy ofSubject B was
16.7%. We regard lateral sitting as a status that can
ac-commodate diversity among individuals. For sleeping, the recognition accuracy of face-up sleeping is higher than that of right or left sleeping. We regard the body weight as gathered to the two sensors of the left or right sides in sleeping, whereas the load from the upper body is distributed on S1–S4 at the face-up sleeping.
[image:8.595.58.297.287.386.2]3 3 1 1 1 6 6 6 3 3 3 1 1 1 3 3 4 5 4 4 3 3 3 1 1 6 6 6 3 3 3 3 1 1 3 3 5 5 3 3 3 3 3 3 6 6 6 6 1 3 3 3 3 3 3 3 4 5 3 3 2 2 1 1 6 6 6 5 1 1 1 3 3 3 3 3 4 4 3 3 2 2 2 2 6 6 6 5 1 1 1 3 3 3 3 4 4 4 3 3 2 2 2 1 6 6 6 5 1 1 1 1 3 1 1 4 4 4 1 1 2 2 1 1 6 6 6 4 1 1 1 3 3 1 4 4 5 4 1 1 1 1 1 2 2 2 4 4 4 1 1 1 4 2 4 5 2 2 1 1 1 1 2 2 2 4 4 4 4 4 5 5 5 2 2 2 2 2 2 2 4 4 2 2 4 4 4 4 4 5 5 5 5 2 2 4 4 2 2 4 4 4 4 2 4 4 1 1 6 6 6 5 5 2 2 2 4 1 4 4 4 4 4 2 2 2 1 5 6 6 6 6 2 2 2 2 2 1 4 4 4 1 1 2 2 2 1 5 6 6 6 6 2 2 2 4 2 4 4 4 1 1 1 2 2 1 1 5 7 6 6 2 2 2 2 1 4 2 2 4 1 1 2 2 2 4 4 4 5 6 2 2 2 2 2 4 2 2 2 1 1 1 2 2 4 4 4 5 5 5 2 1 1 2 2 4 2 2 4 1 2 2 2 2 4 4 4 4 5 4 1 2 2 2 2 2 4 4 4 4 2 2 2 2 4 4 5 5 4 3 2 2 2 2 2 2 2 4 4 4 2 2 2 2 3 3 5 5 3 3 3 2 2 1 2 1 2 4 1 2 2 2 2 2 2 3 3 3 3 3 3 2 2 2 1 2 1 1 2 2 3 3 1 1 1 6 6 6 3 3 3 1 1 1 3 3 4 5 4 4 3 3 3 1 1 6 6 6 3 3 3 3 1 1 3 3 5 5 3 3 3 3 3 3 6 6 6 6 1 3 3 3 3 3 3 3 4 5 3 3 2 2 1 1 6 6 6 5 1 1 1 3 3 3 3 3 4 4 3 3 2 2 2 2 6 6 6 5 1 1 1 3 3 3 3 4 4 4 3 3 2 2 2 1 6 6 6 5 1 1 1 1 3 1 1 4 4 4 1 1 2 2 1 1 6 6 6 4 1 1 1 3 3 1 4 4 5 4 1 1 1 1 1 2 2 2 4 4 4 1 1 1 4 2 4 5 2 2 1 1 1 1 2 2 2 4 4 4 4 4 5 5 5 2 2 2 2 2 2 2 4 4 2 2 4 4 4 4 4 5 5 5 5 2 2 4 4 2 2 4 4 4 4 2 4 4 1 1 6 6 6 5 5 2 2 2 4 1 4 4 4 4 4 2 2 2 1 5 6 6 6 6 2 2 2 2 2 1 4 4 4 1 1 2 2 2 1 5 6 6 6 6 2 2 2 4 2 4 4 4 1 1 1 2 2 1 1 5 7 6 6 2 2 2 2 1 4 2 2 4 1 1 2 2 2 4 4 4 5 6 2 2 2 2 2 4 2 2 2 1 1 1 2 2 4 4 4 5 5 5 2 1 1 2 2 4 2 2 4 1 2 2 2 2 4 4 4 4 5 4 1 2 2 2 2 2 4 4 4 4 2 2 2 2 4 4 5 5 4 3 2 2 2 2 2 2 2 4 4 4 2 2 2 2 3 3 5 5 3 3 3 2 2 1 2 1 2 4 1 2 2 2 2 2 2 3 3 3 3 3 3 2 2 2 1 2 1 1 2 2 3 3 1 5 5 5 5 4 5 4 4 1 1 1 3 3 3 3 3 3
3 3 3 5 4 4 4 5 5 4 4 1 1 1 3 3 3 3 3 3 3 3 3 3 4 4 5 5 5 5 5 1 1 1 3 3 3 3 3 1 3 3 3 3 3 4 5 5 5 5 5 3 3 3 3 3 3 1 2 2 3 3 3 3 3 3 4 5 5 5 5 3 3 3 3 3 1 1 1 2 1 1 3 3 3 3 5 5 5 5 5 3 3 3 3 1 1 1 1 1 1 1 3 3 3 3 6 6 6 6 6 6 6 1 3 3 3 1 1 1 1 3 3 3 3 3 6 6 6 6 6 6 6 1 1 3 1 1 1 1 6 6 3 3 3 3 6 6 6 6 6 6 2 2 1 3 4 4 2 1 6 6 6 3 3 6 6 6 6 6 6 6 2 2 2 2 2 4 4 2 6 6 6 3 2 3 6 6 6 6 6 6 2 2 2 2 2 4 4 4 6 6 6 3 3 3 4 6 6 6 6 6 2 2 2 2 4 4 2 4 6 6 3 4 4 4 2 2 6 6 6 6 4 4 2 2 2 3 4 4 3 3 1 1 4 4 2 2 2 5 5 5 5 4 4 4 3 2 4 4 3 3 1 1 4 1 2 1 4 5 5 5 5 4 4 4 4 2 4 4 3 3 1 2 2 1 1 4 4 4 5 5 5 4 4 4 4 2 4 4 3 3 4 2 2 1 1 4 4 4 4 5 5 4 4 4 4 2 2 4 3 2 2 2 4 1 4 4 4 4 4 4 5 4 4 4 4 2 2 4 4 4 2 4 1 4 4 4 4 4 4 4 4 5 5 1 1 3 2 2 4 4 4 4 4 4 4 4 4 4 4 4 4 5 5 3 1 1 2 2 3 3 3 1 1 1 1 2 2 2 2 2 1 1 1 1 1 1 1 1
3 3 3 3 1 1 1 2 2 2 2 2 1 1 5 4 4 1 1 1 1 3 3 3 3 1 1 1 2 2 2 2 5 5 5 5 4 3 3 3 1 1 3 3 3 1 1 1 1 1 1 4 4 5 5 4 3 3 3 3 1 1 3 3 3 1 1 1 1 1 1 4 5 4 3 3 3 3 3 3 2 2 2 3 3 3 3 3 3 3 3 4 4 3 3 3 3 4 4 2 2 2 2 2 2 3 3 3 3 3 3 5 5 4 3 3 4 4 1 1 2 2 2 2 2 2 2 3 3 6 5 5 5 5 3 3 3 3 3 2 2 2 2 2 2 2 3 3 6 6 6 6 6 6 6 6 1 3 2 1 2 2 2 2 2 2 2 6 6 6 6 6 6 6 6 6 4 4 1 1 2 2 2 2 2 2 2 6 6 6 6 6 6 6 6 5 4 4 1 1 2 2 2 2 2 2 2 6 6 6 6 6 6 6 5 5 4 4 1 1 2 2 2 2 2 1 3 3 6 6 6 6 6 5 4 4 5 5 4 5 2 2 2 3 1 3 2 3 2 6 6 5 4 4 3 5 5 5 4 4 1 1 3 3 3 3 3 3 3 4 4 1 4 4 3 4 5 5 5 4 1 1 3 3 3 3 3 3 6 4 1 1 1 4 3 3 3 5 4 1 1 1 3 3 1 3 6 6 6 4 4 1 1 1 3 3 3 3 4 1 1 1 3 1 3 6 6 6 6 4 4 3 1 1 4 3 3 3 1 1 1 1 3 3 3 6 6 6 6 1 4 1 1 1 4 3 3 3 1 1 1 3 3 3 3 5 6 6 6 1 1 1 1 1 2 3 3 3 3 1
(a) Subject A
Sleeping
(b) Subject B (c) Subject C
Sitting
Sitting
Sleeping Sleeping
Sitting Sleeping
Sleeping
Sleeping
A'
B'
B' B'
C'
C'
C'
C'
Figure 12. Categrory maps of Subjects A–C. The grids correspond to the units on the mapping layer of CPNs. Lavelts 1–7 denote FU, RI, LE, LO, LA, TE, and LB.
Table 2. Recognition accuracies of respective subjects and positions for seven patterns [%].
Subject FU RI LE LO LA TE LB Average
A 100 83.3 83.3 100 33.3 100 100 85.7
B 100 100 100 100 16.7 100 100 88.1
C 0 66.7 100 100 83.3 100 100 78.6
D 66.7 50.0 33.3 100 66.7 100 100 73.8
E 50.0 83.3 16.7 50.0 33.3 83.3 100 59.5
F 50.0 83.3 66.7 100 66.7 100 100 81.0
G 66.7 66.7 50.0 66.7 50.0 100 83.3 69.0 H 66.7 33.3 83.3 66.7 66.7 100 100 73.8 I 66.7 50.0 66.7 66.7 66.7 100 100 73.8 J 100 66.7 33.3 83.3 50.0 100 66.7 71.4 Ave. 66.7 68.3 63.3 83.3 53.3 98.3 95.0 75.5
Recognition accuracies used solely for a pillow sensor and a bolt sensor were, respectively, 58.3% and 33.3%. During use setting priority to simplicity, we regard that it is possible to use each single sensor except for the bolt sensor. We regard our method for a multiple sensor sys-tem as useful for situations favoring performance over simplicity.
5.5
Discussion
Table 4 portrays the confusion matrix in each method and scene category for analyzing details of classification results. For this matrix, the number of correct images is shown on the diagonal cells that are marked as boiled numbers. Other cells refer the number of incorrect im-ages and its category name shown in the column. The maximum numbers of incorrect categories are marked as underlined.
The recognition accuracy of lateral sitting is the sec-ond lowest. The number of correct recognition is 32 datasets. For this behavior, 20, 5, and 3 datasets are falsely recognized respectively as longitudinal sitting, terminal sitting, and left the bed. The behavior pat-terns of a subject from longitudinal sitting to lateral sit-ting have a large gap because subjects turn their body about 90 deg on the bed. For both sitting positions, the load to be provided pad sensors is concentrated to the hip at the center of the bed. We consider that the false recognition in both behavior patterns results from this feature. For lateral sitting, the load of the legs is
gath-ered to the terminal as an exit of the bed. We consider that false recognition results from unclear boundaries between lateral sitting and terminal sitting. However, we consider that fatal errors of bed-leaving prediction can be avoided because no dataset of lateral sitting was falsely recognized as sleeping or bed leaving.
As shown in the fourth line of Table 4, 12 and 9 datasets of left sleeping were falsely recognized as right sleeping and face-up sleeping, respectively. False recog-nition of left sleeping remains for sleeping except for one dataset. For face-up and right sleeping, four datasets are falsely recognized as longitudinal sitting. We con-sider that this results from the load to be gathered S3 only depending on a subject, although the load on right sleeping is gathered to S1 and S3 normally.
We examined recognition of three patterns: sleeping, sitting, and leaving. Table 5 presents the confusion ma-trix with respective recognition accuracies for this case. The recognition accuracy of sleeping improved to 93.9%. For bed-leaving prediction, these are basic behavior pat-terns. Therefore, we consider that our system, although simple, provides high recognition accuracy of 97.8% for standing.
Table 3. Recognition accuracies used for stand-alone sensor [%].
Sub. FU RI LE LO LA TE LB Average
Pads 35.0 81.7 75.0 90.0 55.0 96.7 91.7 75.0 Acc. 68.0 34.0 46.0 52.0 46.0 74.0 88.0 58.3
[image:10.595.64.291.199.302.2]Bolt 33.3 0 11.1 0 22.2 100 66.7 33.3
Table 4. Confusion matrix of respective positions for seven pat-terns. Underlines show the numbers of correct data.
Position FU RI LE LO LA TE LB
FU 40 3 15 2 0 0 0
RI 5 41 6 2 0 6 0
LE 9 12 38 0 0 1 0
LO 0 0 1 50 7 2 0
LA 0 0 0 20 32 5 3
TE 0 0 0 1 0 59 0
LB 0 0 0 3 0 0 57
Table 5. Confusion matrix with respective recognition accuracies for three patterns
Sleeping Standing Left Acc. [%]
Sleeping 169 11 0 93.9
Standing 1 176 3 97.8
Left 0 3 57 95.0
method, although the experimental environment and the number of subjects differ in the results. Their method remains for three target patterns of longitudinal sitting, terminal sitting, and leaving. Moreover, their method requires setting the body weight of a subject in advance. We consider that our method is superior to their method as a functional aspect without setting it in advance.
6
Conclusion
This paper presented a multiple sensor system for predicting behavior patterns that occur when a person leaves a bed. This sensor system is designed for early prediction of bed-leaving behavior patterns, with high regard devoted to QOL. We developed a method using machine learning algorithms of two types to recognize bed-leaving behavior patterns from signals obtained us-ing the sensors. We evaluated our system for ten sub-jects in an environment that represents a clinical site. The recognition accuracy for seven behavior patterns was 84.1%. Moreover, the recognition accuracies for lon-gitudinal sitting, terminal sitting, and left the bed were 83.3%, 98.3%, and 95.0%, respectively. However, falsely recognized patterns remained for respective categories of sleeping and sitting on the bed. Our system is appli-cable to an actual environment as a novel sensor system that does not restrict patients.
We will achieve steady detection to expand the appli-cation range of our method and thereby increase the number of subjects. Moreover, we would like to
ap-ply our system to care facilities or single senior’s homes for security and safety observation that simultaneously maintains QOL and privacy.
Acknowledgements
We would like to extend our appreciation to Assis-tant Professor M. Takahashi at the Medical School of Akita University, who provided us medical knowledge and evaluation methods of our sensor system from the viewpoint as a medical doctor. Moreover, we would like to thank ten people who cooperated as subjects to pro-duce datasets for this study.
REFERENCES
[1] Inokuchi, K.: The Labor Shortage in Care Work-place and Employment Intention of the Young, Proc. Kanazawa Univ. Graduate School Human and Socio-Environmental Studies, Vol.15, 69–84, 2008.
[2] R. Yamada, M. Takashima, Y. Sato, W. Ito, T. Ito, and Y. Asanuma, “Evaluation and Prevention of Inpatient Falls –A study using a classification system based on sit-uational criteria–,” Proc. Akita Univ. School of Health Sciences, vol.18, no.2, pp.144–150, 2010.
[3] Y. Mitadera and K. Akazawa, “Analysis of Incidents Occurring in Long-Term Care Insurance Facilities,”
Bulletin of Social Medicine, vol.30, no.2, pp.123–130, 2013.
[4] K. Imaizumi, Y. Iwakami, and K. Yamashita, “Avail-ability of Monitoring System for Supporting Health-care of Elderly People,” Japanese Journal of Applied IT Healthcare, vol.5, no.1, pp.63–64, 2010.
[5] H. Matsuda, A. Yamaguchi, and T. Arakawa, “Moni-toring System of Living Activities for Elderly People,”
National Technical Report, vol.82, pp.4–8, 2003.
[6] T. Tatsumi, K. Kanemoto, and N. Yagi, “How to Use Efficient Tentomushi – Considering the Length of Stride and Height for Protecting False Operation,”
Proc. Japanese Nursing Association, vol.38, pp.144– 146, 2007.
[7] S. Kondo, C. Kamiya, H. Miyamoto, Y. Toriyama, E. Mimura, and F. Tsuchida, “Availability of Sensor Mats to Detect Leaving for Protection of Falling Acci-dents from Bed,”Trans. Japanese Association of Rural Medicine, vol.55, no.3, pp.245, 2006.
[image:10.595.65.291.361.414.2]Engineers of Japan Part. D, vol.126, no.11, pp.1507– 1513, 2006.
[9] H. Seki and Y. Hori, “Detection of Abnormal Action Us-ing Image Sequence for MonitorUs-ing System of Aged Peo-ple,” Trans. Institute of Electrical Engineers of Japan Part. D, vol.122, no.2, pp.1–7, 2002.
[10] H. Madokoro, N. Shimoi, K. Sato, “Bed-Leaving Detec-tion Using Piezoelectric Unrestrained Sensors and Its Measurement System Regarding QOL,” Nursing and Health, vol.1, no.2, pp.36–45, 2013.
[11] M. Shimizu, K. Dugawara, F. Ozaki, Y. Hama, M. Nishimura, and H. Yoshino, “Development of Detection System of Getting out of Bed with Ultrasonic Array Sensor (Part 3),”Trans. Society of Life Support Tech-nology, vol.21, no.3, pp.9–16, 2009.
[12] K. Hirasawa, N. Matsumura, N. Kanemaru, and K. Abe, “Falling Accident Prevention System Used for a Clinical Site and Care Facility,” Technical Journal of Nippon Telegraph and Telephone, vol.20, no.1, pp.32– 35, 2008.
[13] T. Uezono, A. Kubo, M. Nakajo, A. Uekaraseta, and T. Uchida, “Application Study of Bed leaving Predic-tion System,” Proc. Conference of Kagoshima Prefec-tural Industrial Technology Center, pp.34–35, 2010.
[14] H. Madokoro, N. Shimoi, and K. Sato, “Prediction of Bed-Leaving Behaviors Using Piezoelectric Non-Restraining Sensors,” Journal of Sensors and Sensor Systems, vol.2, no.1, pp.27–34, Apr. 2013.
[15] N. Shimoi and H. Madokoro, “Flight Stabilization of Micro Flying Robot for Rescue Scenarios,” Inter-national Journal of Automation, Robotics and Au-tonomous Systems, vol.12, no.1, pp.11–15, Dec. 2012.
[16] N. Shimoi, C. H. Cuadra, H. Madokoro, and M. Saijo, “Simple Smart Piezoelectric Bolt Sensor for Structural Monitoring of Bridges,” International Journal of In-strumentation Science, vol.1, no.5, pp.78–83, Dec. 2012.
[17] T. Hatsukari, T. Shiino, and S. Murai, “The Reduction of Tumbling and Falling Accidents Based on a Built-in Patient Alert System in the Hospital Bed,”Journal of Science of Labour, vol.88, no.3, pp.94–102, 2012.
[18] Y. Kishimoto, A. Akahori, and K. Oguri, “Position pre-sumption during sleeping by using a three-axis acceler-ation sensor,”IEICE Technical Report of ME and Bio Cybernetics, vol.105no.456pp.45–48, 2005.
[19] K. Nomoto, R. Miyazaki, T. Hasegawa, and Y. Yonei, “A Trial of Evaluation for Quality of Sleep using a Three Dimension Acceleration Sensor,”The Science and En-gineering Review of Doshisha University, vol.51, no.1, pp.28–36, 2010.
[20] S. Okada, Y. Fujiwara, H. Matsuura, M. Yasuda, K. Sugai, M. Makikawa, and T. Iida, “Heart Beat Moni-toring during Sleeping Using an Accelerometer Set in-side the Coverlet,”Transactions of the Japanese Soci-ety for Medical and Biological Engineering, vol.41, no.4, pp.493–497, 2003.
[21] Measurement Specialties Inc.: Datasheet ofDT Series Elements with Lead Attached, Rev.1, 2009.
[22] Freescale Semiconductor, MMA7361LC Data Sheet, Technical Data, Rev 1 , 2011.
[23] Nakamura, K., Kakusho, K., Murakami, M. and Minoh, M.: Estimating Learners’ Subjective Impressions of the Difficulty of Course Materials by Observing Their Faces in e-Learning, The IEICE Transactions on Information and Systems, J93-D, 5, pp.568–578, 2010.
[24] M. Motegi, N. Matsumura, T. Yamada, N. Muto, N. Kanamaru, K. Shimokura, K. Abe, Y. Morita, and K. Katsunishi, “Analyzing Rising Patterns of Patients to Prevent Bed-related Falls (Second Report),”Trans. Japan Society for Health Care Management, vol.12, no.1, pp.25–29, 2011.
[25] T. Kohonen, Self-Organizing Maps, Springer Series in Information Sciences”, 1995.
[26] T. Yamakawa, H. Tokutaka, and K. Fujimura, Appli-cation Examples of Self-Organizing Maps, Kaibundo Pub., 2002.
[27] J. McQueen, “Some Methods for Classification and Analysis of Multivariate Observations”, Proc. Fifth Berkeley Symposium on Mathematical Statistics and Probability, pp.281–297, 1967.
[28] J. Vesanto and E. Alhoniemi, “Clustering of the Self-Organizing Map”, IEEE Trans. Neural Networks, vol.11, no.3, pp.586–600, 2000.
[29] M. Terashima, F. Shiratani, and K. Yamamoto, “Un-supervised Cluster Segmentation Method Using Data Density Histogram on Self-Organizing Feature Map,”
Trans. Institute of Electronics, Information and Com-munication Engineers, vol.J79-D-2, no.7, pp.1280–1290, 1996.
[30] H.B. Barlow, “Unsupervised learning,”Neural Compu-tation, no.1, pp.295-311, 1989.
[31] K. Doya, “What are the computations of the cerebel-lum, the basal ganglia, and the cerebral cortex,”Neural Networks, vol.12, pp.961-974, 1999.
[32] H. Nielsen, “Counterpropagation networks”, Proc. of IEEE First Int’l. Conf. on Neural Networks, 1987.
[33] M. Tsukada, Y. Utsumi, H. Madokoro, and K. Sato, “Unsupervised Feature Selection and Category Classifi-cation for a Vision-Based Mobile Robot”,IEICE Trans. Inf. & Sys., vol.E94-D, no.1, pp.127–136, 2011.
[34] M. Hosokawa, Y. Ito, and T. Hoshi, “Extraction of Ur-ban Characteristics using Polarimetric SAR Data and Self-Organizing Map,” Trans. Institute of Electronics, Information and Communication Engineers B, vol.J84-B, no.6, pp.1043–1051, 2001.
![Figure 1.(a) Upper vieweration sensor in a comforter cover [20].was constructed to measure the heart rate of a subjectduring sleeping](https://thumb-us.123doks.com/thumbv2/123dok_us/8792954.910188/3.595.55.273.54.153/figure-upper-vieweration-comforter-constructed-measure-subjectduring-sleeping.webp)


![Table 3. Recognition accuracies used for stand-alone sensor [%].](https://thumb-us.123doks.com/thumbv2/123dok_us/8792954.910188/10.595.65.291.361.414/table-recognition-accuracies-used-stand-sensor.webp)
