Analysis of Stresses on Straw Walker Crankshaft of John
Deere 995 Combine Harvester
Mohsen Azadbakht
1,*, Ahmad Taghizadeh-Alisaraei
1, Amin Hashemi
1, Reza Janzadeh Galogah
21Department of Agricultural Machinery Engineering, Gorgan University of Agricultural Sciences and Natural Resources, Gorgan, Iran 2Department of Agricultural Machinery, Faculty of Bio-System Engineering, University College of Agriculture and Natural Resources,
University of Tehran, Karaj, Iran *Corresponding Author: azadbakht@gau.ac.ir
Copyright © 2013 Horizon Research Publishing All rights reserved.
Abstract
Straw walker crankshaft has an important role in combine harvesters and at high speeds must withstand high stresses. At work different forces applied to this instrument which can change its shape. In this research, stresses on straw walker crankshaft of John Deere 995 combine harvester has been investigated during its works. First a 3D model of this crankshaft has been designed on Solid Works 2010 software then by using finite element method on Ansys Work Bench 11 software the fabricated model has been analyzed and using Ansys 11 software the maximum stresses obtained and associated with these points (stresses) a safety factor has been determined.Keywords
Ansys, stress, John Deere 955, combine harvester, straw walker, crankshaft1. Introduction
Crankshafts are one of the power train elements in industry and must have this ability to withstand high stresses in high speeds. Crankshafts in combine harvesters are like crankshafts in engine with this difference that in straw walker crankshafts torque applies to crankshafts and with its rotation force inserts to cranks and cause straw walker plates lift. Forces which are applied to the cranks axle of straw walker crankshaft are radial and no force inserted in axle direction. These forces, also cause shearing stress on crankshaft main axle.
Ability of commercial packages like Ansys, Abaqus and others in numerical analysis field to predict component failures are well established and the results can be justified according to mathematical and empirical models. Failure initiation, maximum load-bearing capacity and lifetime of components can approximately be predicted[7]. Reference [3] used experimental and numerical methods, for the stress analysis of a frontal truck axle beam, and the results verified with the finite element method which was graphical stress investigation. Reference [4] start numerical and empirical
analyzing on front axle of a tractor, according to obtained results by finite element method the redesign for frontal axle was done to reduce weight, improvement and fabrication. Five different models were proposed basis on ease of production and weight reduction. The results were obtained on the basis of finite element method and analysis was on the basis of different methods which lead to 13 test certificates. Empirical and numerical methods were used to change the design from casting to coating based welding [5]. Reference [2] worked on stress analysis of front axle of John Deere 955 combine under static loading conditions and they used the commercial finite element package Ansys version 9.0 and reported that the calculated value of factor of safety is very low and the front axle of John Deere 955 combine isn’t strong enough to be installed on the modified combine.
This research was done to investigate force treatment in sensitive parts and modify the crankshaft performance that lead to long lifetime. In this analysis by Von Mises theory the amount of stresses on crankshaft axle and crank parts was obtained and by Ansys 11 software, the maximum stresses was obtained and safety factor was created associated with these (stresses) point. Also to simplify the analysis, the friction effects didn’t mentioned.
2. Materials and Methods
10 Analysis of Stresses on Straw Walker Crankshaft of John Deere 995 Combine Harvester
1 [8]:
T=30000 ×Pπ×n (1)
Figure 1. Schematic of how to transfer power from the sprocket wheel 1
to crankshaft
Where, n is rotational speed of straw walker sprocket in rpm, T is the transmitted torque to the straw walker sprocket in N.m and p is power of sprocket 1 in kW. After calculating the torque of straw walker sprocket, by equation of 2 the force to end of arm 1 with 5 cm length is calculated [8]. Then by reusing equation 2 and force on arm 3 with 13 cm length which is connected to the crankshaft, the torque of crankshaft was calculated.
T=F × L (2) Where T is torque in N.m, F is force in N and L is length in m.
After computing the torque on crankshaft, analysis of crankshaft was done in Ansys Work Bench using static analysis. The amount of forces on each crank considered to be 9 kg which is because of straw walker plate weight, straw and stubble (BehrouziLaret al., 2007). Noted that in this study crankshaft considered in four different states. In each state one of the cranks is in top point, for example crank 1 in state one, crank 4 in state 2, crank 2 in state 3 and crank 3 in state 4 is in top point. Then deformation and forces which in each four state is inserted to the crankshaft axle and cranks
[image:2.595.332.532.119.188.2]was calculated. Crankshaft is made of steel 34CrNiMo6 [9], table 1.
Table 1. Specification of 34CrNiMo6 steel
Specification Quantity
Density 7840 (Kg M-3)
Poisson's ratio 0.3
Tensile strength 1180 (MPa)
0.2 % Proof stress 785 (MPa)
Modulus of elasticity 210 (GPa)
Figure 2 shows isometric image of straw walker crankshaft of John Deer 955 combine harvester.
After entering straw walker crankshaft to the Ansys 11 environment and choosing type of analysis, crankshaft first has been modeled by tow dimensional elements Solid 82 and three dimensional elements Solid 92 [1]. Solid elements was used because it is one of the common tow dimensional element and it has four node, also in irregular shapesit can perform as well. Figure 3 to 5 shows meshing, 39379 nodes and 20944 elements has been used for meshing.
After meshing proper support has been chosen for ends of crankshaft, which was cylindrical support. Then the calculated torque was inserted to the crankshaft. Then forces on each crank were inserted on the crank surface vertically. In next step, critical points or points where stress was maximum of Von-Miseswere obtained. Finally the safety factor has been obtained as equation 3.
2.1. Calculating Safety Factor
Safety factor of static analysis defined as ultimate stress strength on maximum stress of crankshaft and to calculate safety factor of fatigue we used Soderberg equation [10]:
1 F.S=
σave
σy + K
σr
σe (3)
Where F.S. is safety factor in fatigue state, σave is average stress, σy is yield point stress, σr is alternating stress, σe is tolerance stress and K is stress concentration factor. σaveandσr were calculated as equation 4 and 5 [10]: σr =σmax− 2σmin (4)
[image:2.595.145.480.580.736.2]σave =σmax+ σ2 min (5)
Figure 3. Image from crankshaft meshing
Figure 4. Image from crankshaft meshing
Figure 5. Image from crankshaft meshing
3. Results and Discussion
Figure 6 to 9 shows the deformation of crankshaft in different states which the deformation in cranks of crankshaft is more than other parts of it, like in real performance. Figure 10 shows the deformation of each crank in four different states. As it clear in Fig. 10, in state 4, the most deformation occurs on the axis of the crankshaft which is at the junction of second crank to the arm crank.
Distribution of Von Mises stress in each four state is like each other. Figure 11 shows value and distribution of Von Mises stress in head of crankshaft in state 4 (in which torque transmitted to the crankshaft) in which maximum occur in that. In spotted point of Fig. 11 stress is maximum.
In figure 12 the values of maximum Von Mises stress on crankshaft in four different states is shown. As it can be observed in state 3 and 4, the maximum stress on crankshaft is more than other states and in state 2 in lower than others.
[image:3.595.97.516.68.570.2] [image:3.595.101.510.81.295.2]12 Analysis of Stresses on Straw Walker Crankshaft of John Deere 995 Combine Harvester
Figure 6. Image of crankshaft deformation in position 1
Figure 7. Image of crankshaft deformation in position 2
[image:4.595.95.520.83.256.2] [image:4.595.97.520.476.665.2]Figure 9. Image of crankshaft deformation in position 4
Figure 10. Relation of crank of crankshaft and deformation
14 Analysis of Stresses on Straw Walker Crankshaft of John Deere 995 Combine Harvester
[image:6.595.94.521.326.479.2]Figure 12. Relation of maximum Von-Misesstress and crank position
Figure 13. Stress on arm of near the second crank, between first and second crank in position 4 (about 550 Mpa).
[image:6.595.90.522.501.678.2]Figure 15. Stress on arm of near the fourth crank, between third and fourth crank in position 2 (about 700 Mpa)
Figure 16. Stress on arm of near the third crank, between third and fourth crank in position 1 (about 800 Mpa)
[image:7.595.93.520.469.623.2]16 Analysis of Stresses on Straw Walker Crankshaft of John Deere 995 Combine Harvester
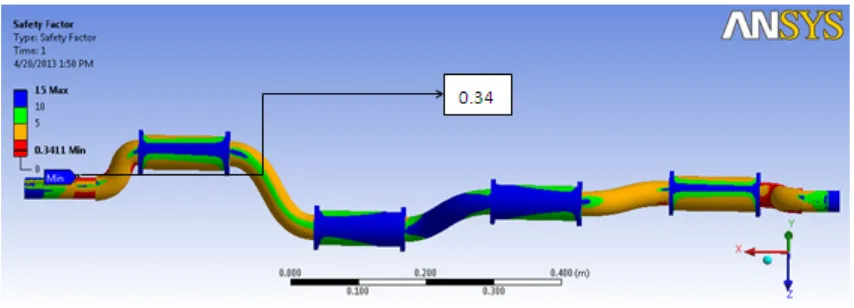
Figure 18. Relation of minimum safety factor and crank position
In Figure 17 safety factor values in the crankshaft, state 4, is shown. Its minimum value is equals with state 3, and is less compared to other two. As is shown In Figure, safety factor levels are lowest in the head of crankshaft. This means that in this area stress levels are very high. In general it can be concluded that in areas where is the stress concentration safety factor levels is low. In Figure 18, the minimum safety factor values are shown for crankshaft. As is clear, in states 3 and 4 are lower than the other two.
4. Conclusions
Considering the analysis done and also values and distribution of stress and deformation rate can be receive that the most of place where there is a probability of failure are central and near the crank arms. In Figure 16, the most probability of failure is shown in the between the 4 state, that first state is related to.
Considering the values of safety factor, it can be concluded that the probability of failure in the part junction of the head crankshaft to the arm crank due to stress concentration is high. Therefore by choosing a proper angle can reduce the stress concentration. This should be possible angle greater than 90 degrees. Also, choice of a stronger alloy can be largely prevented fractures.
REFERENCES
[1] Hancq. D.A. Fatigue Analysis using Ansys. Ansysinc., 22p. 2003.
[2] Jafari, A., Khanali, M., Mobli, H. and Rajabipour, A. Stress analysis of front axle of JD 955 combine harvester under static loading. Journal oF Agriculture and Social Sciences. 02(3):133–135. 2006.
[3] Leon, N., P.O. Martinez and P. Aadaya. Reducing the weight of a frontal axle beam using experimental test procedures to fine tune FEA. 2nd Worldwide MSC Automotive Conference, Dearborn, Michigan. 2000.
[4] Mahanty, K.D., V. Manohar, B.S. Khomance and S. Nayak. Analysis and weight reduction of a tractor’s front axle. Tata Consultancy Services, India, SwarupUdgata, International Auto Limited, India. 2001.
[5] Maly, J. and E. Bazzaz. Design change from casting to welding for an axle casting. 2003.
[6] Metal Ravne d. o. o. Online available on: http://www.metalravne.com/selector/steels. Accessed 3 January 2013.
[7] Pandiyarajan.R, Starvin.M.S, Ganesh.K.C. Contact stress distribution of large diameter ball bearing using Hertzian Elliptical contact theory. ProcediaEngineering 38: 264-269. 2012.
[8] Ranjbar, I., Qasemzadeh, H. R., Davoudi, Sh. Engine and Tractor Power.Tabriz University Press (In Farsi). 2011. [9] Saatchi, A., and Idris, H. Key to steel. ArkanDanesh (In
Farsi). 2009.