Growers in the San Joaquin Valley were
surveyed to determine what fraction of
their crop residue
isfield-burned and
during what seasons field burning com-
monly occurs for each crop. Survey re-
sults show that only four crops
-
rice,
almonds, walnuts, and wheat
-
account
for 88% of the crop residue burned in
the San Joaquin Valley, and 95% of the
crop residue burned in the state (exclu-
sive of forestry). Rice and almonds re-
spectively account for
64%and
18%of
the residue burned statewide.
Open burning of crop residues in Califor- nia remains a controversial issue due to the resulting air pollution and real or per- ceived threats to human health. Last year the open-burning controversy intensified after the discovery of fiber-like silica par- ticles in the smoke from rice straw burns. Although little is known about the health impacts of these particles, increased awareness of the detrimental effects of all types of combustion products, regardless of source, has made the public less tolerant of agricultural burning. Increasing urban development in agricultural regions and the concomitant decline in ambient air
Photos show rice straw fire during a spring burn in February 1990. The fire is propagating against the wind (a so-called “baking” fire), with a visible plume trailing behind. Closeup shows the emission of volatile products (pyrolysates-the yellow smoke in the middle) as the fuel heats ahead of the flame. Also visible is the smoldering afterburn (the grey smoke behind the fire).
quality due to increased vehicular use, wood burning, and other residential, com- mercial, and industrial activities have only exacerbated the problem.
Agricultural burning is commonly practiced in a number of crops for expedi- tious removal of crop residues, and for disease and pest control. Alternatives to open burning have long been investigated and debated. In recent years several fea- sible alternatives have emerged, including new markets for residual crop biomass. Principal among these markets is the inde- pendent power generation industry devel- oped over the last decade. In California,
about 60 plants have been constructed and now generate roughly 700 megawatts of power through combustion of biomass fuels.
Because they also emit pollutants, such new facilities must reduce or “offseY‘ the emission of similar pollutants elsewhere in the region. Agricultural residues that are normally burned in the field can be claimed in determining the offset require- ments. The ability to reduce the emission offset requirements from other sources represents an economic incentive to the power generation sector to utilize agricul- tural residues as fuel.
Determining the offset credit
The California
Air
Resources Board (CARB) has developed a procedure to de- termine the offset credit permitted to any facility, partly based on the results of this research. The procedure utilizes informa- tion on the type and quantity of crop resi- due used by the facility, the amount of pollutant of each type normally emitted by the residue when burned in the field (called the emission factor), the fraction of each crop residue that historically has been burned in the field (called the histori- cal burn fraction, or HBF), and the fraction of residue that is normally burned during any season of the year (called the quarterly distribution factor, or QDF). The proce- dure also uses information on the proxim- ity of the fuel source (field) to the power plant site. Fuel obtained from within a 15- mile radius of the plant accrues a higher offset than fuel from outside this radius. To develop the procedure, CARB requires information on the values of HBF and QDF for various crops in the state.Survey scope and methods
This article describes the results of a survey conducted by UC Davis for CARB to quantify the values of HBF and QDF for six field crops barley, corn, cotton, rice, sorghum and wheat) and 10 fruit and nut crops (almonds, apricots, cherries, grapes, nectarines, oranges, peaches, pistachios, plums and walnuts) in the state. From the data collected by the survey, an emission inventory for these crops was.also derived. The inventories for five principal pollut- ants are reported here. Work on character-
izing other emissions from agricultural fu- els is continuing.
Values of HBF and QDF were obtained from a telephone survey of growers in four counties in the San Joaquin Valley air basin (SJVAB): Fresno, Kern, Merced, and Stanislaus. The survey was undertaken be- cause the only other direct source of infor- mation, the agricultural burn records col- lected by the local air pollution control districts, proved inaccurate. In several cases there was substantial over-reporting of burning and a lack of consistency throughout. Other techniques, such as sat- ellite reconnaissance for determination of HBF, had been attempted by others but proved infeasible.
Individual growers were selected at random from the 1988 registered materials lists in each of the four counties. Respon- dents were questioned about the types of crops grown, total acreage in each crop, acreage burned, and month in which the residue was burned. Respondents were also asked how their current practice (re- ported for the most recent crop year) cor- responded to past practices, and what ex- pectations they had for changing the amount of burning in the future. The latter questions were intended to obtain purely qualitative information as to how typical the survey responses might be. Because many growers do not routinely keep records of burning practice, a survey of this type was not deemed suitable for re-
covering information on burning beyond the most recent year. Responses on crop type and total acreage were checked against data reported in the registered ma- terials lists to assess the veracity of each re-
sponse. In only one interview was there evidence of false reporting, and its results were eliminated from further analysis.
The survey was designed to contact at least 5% of the growers of each crop in each county and accumulate information on at least 10% of the crop area. When the grower sample size was less than 10 based on the 5% criterion, the minimum sample size was taken as 10. If there were fewer than 10 growers for any crop, an effort was made to contact them all.
We interviewed 609 growers. Because some growers produced more than one crop, 1,226 responses were received on all 16 crops. The crop area encompassed by the survey was 417,877 acres, or 15% of the total area in these crops in the SJVAB, based on acreage numbers compiled by the California Department of Food and Agriculture (CDFA). The 16 crops sur- veyed account for 89% of the area har- vested for
all
types of fruit, nut, and field crops in the SJVAB and 83% of the area harvested for these crops in the state. The SJVAB by itself accounts for 62% of the acreage of all fruit, nut, and field crops in thestate, and 67% of the area in the 16 crops surveyed. Vegetable crops were not included in the survey because their resi- dues are not normally burned.Computations
[image:2.612.95.553.485.710.2] [image:2.612.325.565.486.708.2]The value of HBF for each crop was computed by dividing the reported acre- age burned by the reported total acreage harvested. Results for the four counties combined are listed in table 1. The sea- sonal profiling of emissions represented by the values of QDF for each crop were
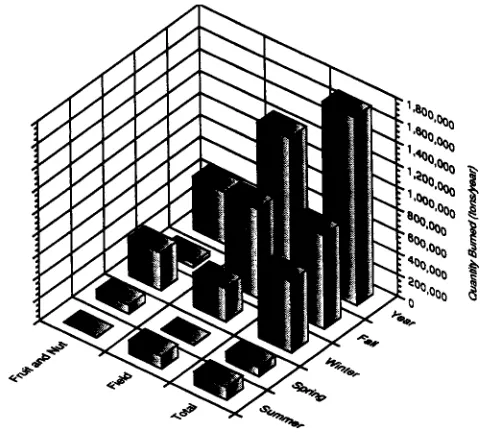
Figure 1. Seasonal distribution of agricultural
computed by summing the monthly val- ues of area burned over each quarter and dividing by the total area burned in the year.
Initially, profiling was attempted on a monthly basis, but the reliability of the survey results did not seem to warrant the level of detail implied by a monthly ac- counting. Growers could very often re- member the season in which they burned residues, but not the specific month. Pro- filing was therefore done on a seasonal (quarterly) basis. The resulting values of
QDF are also listed in table 1 for each crop. Most respondents (>90%) thought their current burning practice was typical of re- cent years; 74% percent thought they would burn about the same in the future, unless prevented by further regulation, 16% thought they would burn less, and 10% thought they would burn more. About 7% expressed an unsolicited desire to find alternatives to burning. A few growers were already marketing residue of one sort or another.
The values of HBF and QDF derived
from the survey were used in computing crop-specific contributions to five major pollutant emissions in both the SJVAB and the state as a whole. For each crop, the to- tal pollutant emission was derived from the total acreage harvested, the crop resi- due yield, the emission factor for each pol- lutant, and the values of HBF and QDF. The pollutants considered were particulate matter (PM), carbon monoxide (CO), hy- drocarbons (HC), oxides of nitrogen (as N02), and sulfur (as S02). Total acreage harvested was determined from statistics compiled by CDFA, crop residue yields were taken from UC extension study re- sults, and emission factors were taken from data developed for the CARB.
Survey
findings
Crop pollutant emission inventory. The seasonal distributions of total residue burned for both fruit and nut crops and field crops are illustrated in figure 1 for the SJVAB and figure 2 for California. In the SJVAB, the greatest amount of burning (62% of biomass) occurs in the winter (De- cember through February), primarily due to the large acreage in fruit and nut crops in the basin. For California as a whole, the majority of the burning (50% of biomass) occurs in the fall (September through No- vember), although winter burning is still a large fraction of the total (38%).
The difference in seasonal profiles be- tween the SJVAB and the state is due pri- marily to the large acreage of field crops in the Sacramento Valley. The quantity of residue burned by crop is given in table 2 for the SJVAB and table 3 for the state. Four crops - rice, almonds, walnuts, and wheat
-
account for 88% of the biomass burned in the SJVAB, and 95% of the bio- mass burned in the state (exclusive of for- estry). Rice and almonds account for 82% of the agricultural biomass burned in the state, with rice accounting for 64% and al- monds, 18%.Emissions from the 16 crops surveyed in the SJVAB are listed in table 4 along with their seasonal distributions. A similar accounting appears in table 5 for Califor- nia. Statewide, agricultural burning annu- ally releases about 5,300 tons of particulate matter, 88,000 tons of carbon monoxide, 7,100 tons of hydrocarbons, 4,700 tons of nitrogen oxides, and 2,200 tons of sulfur products. Compared to total statewide emissions of these five pollutants, agricul- tural burning accounts for 0.13% of par- ticulate matter, 1.27% of carbon monoxide, 0.27% of hydrocarbons, 0.38% of nitrogen oxides, and 1.16% of sulfur emissions (table 6).
To put these numbers in perspective, a comparison of emissions from agricultural burning (again excluding forestry) to those from the state's electric utilities appears in table 7. The data on electric utilities are de-
rived from the emission inventory pub- lished by CARB, and include emissions from fuel burning power plants (including those burning biomass).
Agricultural burning versus electric power. Unlike much of the nation, Cali- fornia generates little electric power from coal; most of the fuel-derived power is generated by the combustion of natural gas, which is a relatively clean fuel. How- ever, the electricity generation sector has been subject to substantial emission regu- lation, which partially accounts for its rela- tively lower contribution to statewide pol- lutant emissions. As shown in table 7, the emissions of particulate matter and carbon monoxide from agricultural burning are two to three times higher than those from the electricity generating sector of the state. Emissions of hydrocarbons and sul- fur from agricultural burning are about half those from the power sector, and ox-
ides of nitrogen only about 10%. This is largely due to the lower flame tempera- ture in field burns compared to industrial boilers. Locally, of course, emissions from agri$tural burning can have sighcant impacts on ambient air quality which are not reflected in the values of table 6.
Discussion
The use of the seasonal emission pro- files embodied in the quarterly distribu- tion factors (QDFs) will likely reduce the economic incentives to power plants uti- lizing agricultural fuels. When emission offsets are computed on an annual basis, full credit is available from each offset fuel. But in seasonal profiling, if a fuel is consumed by the plant during a season when that fuel is not typically burned in the open, then little or no credit would be available.
In principle, the use of QDF's would protect seasonal ambient air quality, be- cause the lack of offset credits from agri- cultural burning would require the instal- lation of additional pollution control equipment, the mitigation of
nonagricultural sources, or the seasonal management of power plant fuels. How- ever, seasonal management of fuels might prove difficult because of the physical and chemical properties of various fuels and the potential need to blend fuels to pre- vent boiler fouling. The lack of offsets might also preclude the construction of new power generating facilities that would use agricultural or other biomass fuels. This issue needs to be carefully con- sidered in determining future state policy.
Conclusions
most cases, there are multiple reasons for burning. Survey results show the burning of wheat straw appears to be primarily a matter of convenience, to rapidly remove straw before soil preparation. The high HBF values for almond and walnut resi- dues are due largely to the type of harvest- ing technology employed for the nuts from these crops. Tree prunings in the rows, whether shredded or not, interfere with the sweeping operation. Alternate harvesting methods or greater utilization of the prunings (such as by power plants) would reduce the need to burn.
Rice straw disposal is the key issue, and one not readily solved. While alterna- tives to rice straw burning do exist, none are as inexpensive as burning, and some may entail sigruficant economic impact. If managed properly they appear to provide adequate disease control. The develop- ment of suitable alternatives, including power generation and soil incorporation, has been the subject of much research, most of which continues today. The ad- vantages and disadvantages of harvesting and utilizing straw, or adapting agro- nomic practice to accommodate the straw, are many.
burning in California appears to be one of whether state policy should or should not protect burning privileges for the four crops that account for nearly all atmo- spheric emissions from
this
source. Cur- rently, Article 3 of the Health and Safety Code expresses the legislative intent that agricultural burning should not be prohib- ited because of the importance to the state of a viable agricultural economy. From the public perspective, the debate over burn- ing is not principally an economic one, be- cause the external costs of health impacts cannot be measured, and food costs are relatively low for the majority of the popu- lation. From an agronomic standpoint, burning remains both an economic and environmental question, particularly if chemical or other means must be found to control pests and diseases that are legiti- mately controlled by burning.Decisions on agricultural burning should rightly include the equitable appli- cation of regulations to forestry, which, from controlled fires, emits roughly the same amount of pollutants as agriculture. Alternatives to open burning exist, but a concerted effort by the state is needed to develop incentives for their implementa- tion. The same can be said for the entire is- sue of environmental quality in California, in which agricultural burning plays a lo- cally important, but overall minor, role.
BM. Jenkins is Associate Professor, and S.Q. Turn and R. B. Williams are Graduate Re- search Assistants, Agricultural Engineering Department,
UC
Davis.In reality, the debate over agricultural
Rust on greenhouse carnations.
Tests comDare funaicides for
control of rust on green-
house carnations
Donald
M.
Ferrin D RobertaG.
RohdeFour fungicides were tested for
control of rust on greenhouse car-
nations. The most effective fungi-
cides were Plantvax and Systhane;
the latter
isnot currently registered
for control of this disease in Cali-
fornia.
Rust of carnations, caused by the fungus Uromyces dianthi, occurs commonly on greenhouse-grown carnations in coastal areas of Southern California. The disease occurs throughout the year but is most se- vere during the cooler, more humid peri- ods of fall through spring when coastal fog is prevalent. The pathogen enters the plant through the stomates and grows be- tween the host cells upon which it feeds.
Masses of the characteristic reddish- brown urediospores are produced within pustules that eventually break through the plant cuticle. These pustules can be found