Munich Personal RePEc Archive
The Second Great Contraction
Reinhart, Carmen
University of Maryland, College Park, Department of Economics
November 2009
Online at
https://mpra.ub.uni-muenchen.de/21485/
Presentation: November 12-13, 2009
The Second Great Contraction
Carmen M. Reinhart1
University of Maryland, CEPR and NBER
Abstract
The global scope and depth of the 2007-2009 crisis is unprecedented in the post World War II period. As such, the most relevant comparison benchmark is the Great
Depression, or the Great Contraction as dubbed by Friedman and Schwartz (1963). We highlight some of the similarities between these two episodes and extend our analysis of the aftermath of severe financial crises to include the most severe post-WWII crises as well. As to the causes of these great crises, we focus on those factors that are common across time and geography; we discriminate between root causes of the crisis, its symptoms, and features such as financial regulation which serve as amplifiers of the boom-bust cycle.
JEL F3, H6, N10
“Overindebtedness simply means that debts are out-of-line, are too big relative to other economic factors. It may be started by many causes, of which the most common appears to be new opportunities to invest at a big prospective profit… such as through new industries… Easy money is the great cause of over-borrowing.”
Irving Fisher (1933).
I.Introduction
The issues I address fall into three broad areas.2 The next section takes stock of
the collateral damage that followed the financial turmoil that began as the subprime crisis
in the United States in the summer of 2007. In particular, it considers the incidence of
banking crises and currency and crashes around the world. Apart from its impact on
domestic and international financial flows and the changes in the landscape of the
financial industry that this crisis has produced, the toll on the real economy has been great.
The evolution of world trade helps to illustrate the breadth and depth of the economic
downturn. Global equity prices have similarly ridden a roller coaster. The evidence
presented here places these developments in a broader historical and international
perspective that allows us to gauge the unusual severity of the unfolding global crisis.
Section III dwells on the aftermath of severe financial crises and speculates on our
current position in the post-crisis cycle. The comparisons focus primarily on the housing
and labor markets, where the aftereffects of the crises have tended to linger the longest.
The fiscal implications and consequences of severe crises are discussed. Section IV poses
the questions of what caused these great crises and what factors make them more severe.
This discussion emphasizes causal factors that are common to severe financial crises
2
across countries and across time rather than those that are idiosyncratic to the political and
economic circumstances. The last section concludes with words of caution on the
dangers of complacency about the emerging view that the storm has passed. There is
some discussion regarding concerns about the high (and rapidly rising) levels of public
sector indebtedness.
II. Taking stock: The global dimensions of the crisis
1. A global crisis index
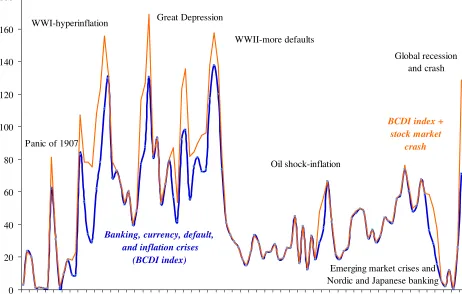
Where are we in a historical global context? We present an index that proxies
world economic turbulence. These aggregate crisis indices are the time series shown for
1900-2008 in Figure 1 for the “World”. The indices are weighted by a country’s share in
world GDP, as we have done for debt and banking crises. The 66-country sample
accounts for about 90 percent of world GDP. The country indices (without stock market
crashes) are compiled from the time of independence (if after 1800) onward; the index
that includes the equity market crashes is calculated based on data availability. While
inflation and banking crises predate independence in many cases, a sovereign debt crisis
(external or internal) is by definition not possible for a colony. In addition, numerous
colonies did not always have their own currencies. The BCDI index stands for banking
(systemic episodes only), currency, debt (domestic and external), and inflation crisis
index. When stock market crashes are added (shown separately) to the BCDI composite,
we refer to it as the BCDI +
before and after World War II. The pre-war experience is characterized by frequent and
severe crises episodes ranging from the banking-crisis driven “global” panic of 1907 to
the debt and inflation crises associated with World War I and its aftermath. The only
period after World War II that we see as high an incidence of crises is the fifties, when
the losing combatants—Germany, Austria, Japan, Italy—were in a state of default. Plus,
of course, there were many countries that had gone into default in the thirties that were
still in default. But since the immediate aftermath of World War II, we had not seen a
crisis this global in scope.
The sharp rise in the blue line (BCDI index) in 2007 and more so in 2008 is mostly
dominated by banking crises and also currency crashes. Indeed, a large share of countries
in the fall of 2008 had sufficiently large depreciations to classify as a currency crash (i.e.,
exchange rate depreciations exceeding 15 percent). The red line adds stock market
Figure 1 Varieties of crises: World aggregate, 1900-2008
A composite index of banking, currency, sovereign default and, inflation crises, and stock market crashes (weighted by their share of world income)
0 20 40 60 80 100 120 140 160 180
1900 1905 1910 1915 1920 1925 1930 1935 1940 1945 1950 1955 1960 1965 1970 1975 1980 1985 1990 1995 2000 2005
Banking, currency, default, and inflation crises
(BCDI index)
BCDI index + stock market
crash Panic of 1907
WWI-hyperinflation Great Depression
WWII-more defaults
Oil shock-inflation
Emerging market crises and Nordic and Japanese banking
Global recession and crash
2.World trade
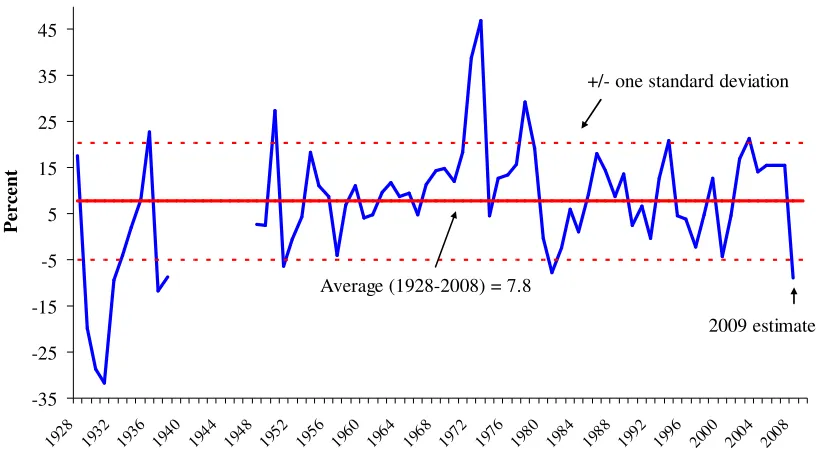
As to trade, we offer an illustration of the evolution of trade during two global
crises. Figure 2 plots the value of World merchandise exports for 1928-2009. The
estimate for 2009 uses the actual year-end level for 2008 as the average for 2009; this
yields a 9 percent year-over-year decline in 2009, the largest one-year drop since 1938. 3
Other large post-WWII declines are in 1952, during the Korean War, and in 1982-1983,
when recession hit the United States and a 1930s-scale debt crisis swept through the
emerging world. Smaller declines occurred in 1958, the bottom of a recession in the
United States, 1998 during the Asian financial crisis, and in 2001, after September 11.
3
Figure 2. World export growth, 1928-2009
(annual percent change)
-35 -25 -15 -5 5 15 25 35 45
1928 1932 1936 1940 1944 1948 1952 1956 1960 1964 1968 1972 1976 1980 1984 1988 1992 1996 2000 2004 2008
P
er
ce
n
t
Average (1928-2008) = 7.8
+/- one standard deviation
2009 estimate
Sources: Global Financial Data (GFD), League of Nations, World Economic Survey (various issues), International Monetary Fund, World Economic Outlook, and the authors (see notes).
Notes: The estimate for 2009 uses the actual year-end level for 2008 as the average for 2009; this yields a 9 percent year-over-year decline in 2009, the largest post-war drop. Other large post-WWII declines are in 1952, during the Korean War and in 1982-1983, when recession hit the United States and a 1930s-scale debt crisis swept through the emerging world. Smaller declines occurred in 1958, the bottom of a recession in the United States, 1998 during the Asian financial crisis and in 2001, after September 11.
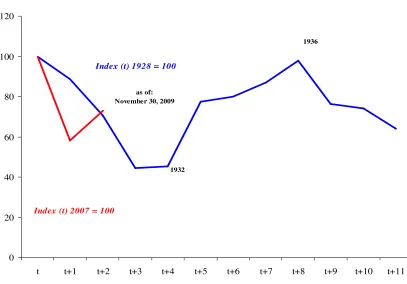
3. Global equity prices
Figure 3 plots the Financial Times 1200 Global Stock Market Index deflated by
consumer prices; real stock prices. The blue line shows the path of prices during the
Great Depression. It sets 1928 equal to 100. The red line is the current FTSE 1200, and
that sets 2007 equal to 100. Figure 3 highlights that the recovery during 2009,
notwithstanding, still left real equity prices (following the collapse during 2008) at
Figure 3. Global stock markets during global crises: Composite real stock price index
(end-of- period)
Sources: Global Financial Data (GFD), Standard and Poor’s, International Monetary Fund, World
Economic Outlook, and the authors (details provided in the data appendix).
Notes: World composite stock price index from GFD for 1928-1939 and from S & P for 2007-2009. The Global 1200 index covers seven distinct regions and 29 countries, and captures approximately
70% of the world market capitalization. Stock prices are deflated by world consumer prices. For 1928-1939 these are constructed using median inflation rates for the 66-country sample; for 2007-2009 these are taken from the World Economic Outlook, end-of-period prices. The years 1928 and 2007 marked the cycle peak in these indices.
4. The “big picture”
In sum, Figures 1 to 3 highlight the breadth, depth, and internationally
synchronous nature of the post-2007 financial crisis, especially in relation to the milder,
more scattered crises episodes of the post war landscape. Even “significant global”
events, such as the break-down of the Bretton Woods system of fixed exchange rates, the
oil shocks of the mid-1970s, and the emerging market debt crisis of the early 1980s, pale
in comparison in terms of the incidence of crises and impacts on the real economy. 0
20 40 60 80 100 120
t t+1 t+2 t+3 t+4 t+5 t+6 t+7 t+8 t+9 t+10 t+11
Index (t) 1928 = 100
Index (t) 2007 = 100
1932
1936
Indeed, the ouput declines registered in many advanced and emerging market economies
in 2009 rank among the largest declines in the history of their national income accounts.
In several countries, the declines in real GDP during the second great contraction
(2008-2009) matched and even exceeded those recorded during severe “home grown” financial
crises. This list includes such diverse countries (the prior crisis year in parentheses) as
Finland (1991); Mexico (1995); Singapore (1982); Spain (1977); Sweden (1991); Turkey
(2001), among others.
Having suggested that the severity of this crisis is on a different scale from the
post-war norm, the logical sequel is to expect that the aftermath of the crisis will, in all
likelihood, also depart from the “standard” post-war recession-recovery pattern. To this
end, the next section summarizes selected empirical findings of the RR study on the
aftermath of severe financial crises.
II. The Aftermath of Financial Crises
As to the current conjuncture in the United States, the post-war recession
experience should not be seen as an instructive benchmark for where we are at present or
what we should expect. The average NBER post-war recession lasts less than a year.
The worst one lasted 16 months. We passed those milestones.
Broadly speaking, financial crises are protracted affairs. More often than not, the
aftermath of severe financial crises share three characteristics. First, asset market
collapses are deep and prolonged. Real housing price declines average 35 percent
7 percentage points over the down phase of the cycle, which lasts on average over four
years. Third, the real value of government debt tends to explode, rising an average of 86
percent in the major post–World War II episodes. Interestingly, the main cause of debt
explosions is not the widely cited costs of bailing out and recapitalizing the banking
system. In fact, the biggest driver of debt increases is the collapse in tax revenues that
governments suffer in the wake of deep and prolonged output contractions.
1. Unemployment
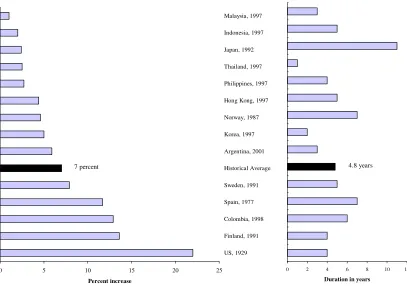
To illustrate, Figure 4 examines unemployment rates in the wake of the 14 worst
financial crises in the post-war period. The left panel shows the increase in the
unemployment rate from the low point to the high point. That is, it is the cumulative
increase in unemployment for that particular crisis. What the right panel shows is the
duration in years of the time it takes to go from the lowest unemployment level to the
highest. On average from bottom to top, unemployment increases by about 7 percentage
points during the worst financial crises. In the U.S. context, low point in unemployment
in 2006 was around 4 percent—a 7 percentage point increase would take it to 11 percent.
The average duration (bottom to peak) is 4.8 years.
These indices are the official unemployment rates; we are now all aware of more
encompassing measures, such as the Bureau of labor Statistics’ U6 that are much higher
than this after taking into account underemployment and discouraged workers.
To reiterate, recovery in the aftermath of severe financial crises are protracted
Figure 4
Past Unemployment Cycles and Banking Crises: Trough-to-peak
Percent Increase in the Unemployment Rate (left panel) and Years Duration of Downturn (right panel)
0 5 10 15 20 25
US, 1929 Finland, 1991 Colombia, 1998 Spain, 1977 Sweden, 1991 Historical Average Argentina, 2001 Korea, 1997 Norway, 1987 Hong Kong, 1997 Philippines, 1997 Thailand, 1997 Japan, 1992 Indonesia, 1997 Malaysia, 1997 Percent increase 7 percent
0 2 4 6 8 10 12
1 2 3 4 5 6 7 8 9 10 11 12 13 14 15
Duration in years
4.8 years
Sources: OECD, IMF, Historical Statistics of the United States (HSOUS), various country sources, and authors’ calculations.
Notes: Each banking crisis episode is identified by country and the beginning year of the crisis. Only major
(systemic) banking crises episodes are included, subject to data limitations. The historical average reported does not include ongoing crises episodes.
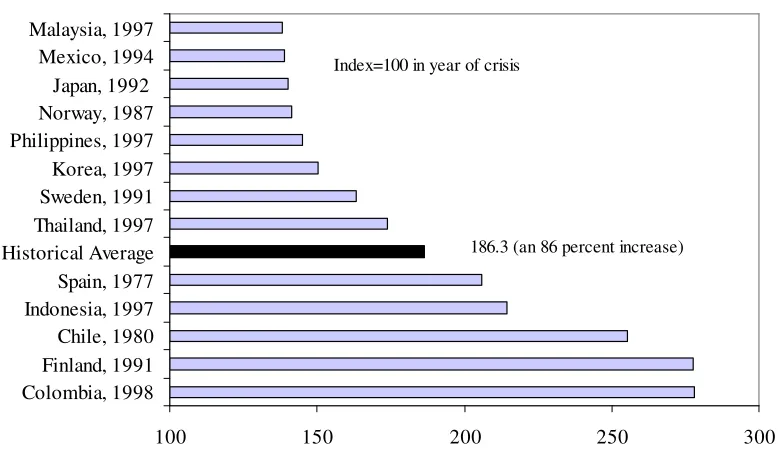
2. Public debt
Whenever there is a substantial economic downturn, high and rising
unemployment, and imploding real estate prices, major fiscal consequences should be
expected. Not surprisingly, the true legacy of a major financial crisis is more government
debt. Figure 5 shows the rise in real government debt in the three years following a
because sometimes steep output drops would complicate interpretation of debt–GDP
ratios. As RR note, the characteristic huge buildups in government debt are driven mainly
[image:13.612.122.511.238.470.2]by sharp falloffs in tax revenue.
Figure 5
Cumulative increase in real public debt in the three years following the banking crisis
100 150 200 250 300
Colombia, 1998 Finland, 1991 Chile, 1980 Indonesia, 1997 Spain, 1977 Historical Average Thailand, 1997 Sweden, 1991 Korea, 1997 Philippines, 1997 Norway, 1987 Japan, 1992 Mexico, 1994 Malaysia, 1997
Index=100 in year of crisis
186.3 (an 86 percent increase)
Sources: Reinhart and Rogoff (2008b) and sources cited therein.
Notes: Each banking crisis episode is identified by country and the beginning year of the crisis. Only major (systemic) banking crises episodes are included, subject to data limitations. The historical average reported does not include ongoing crises episodes, which are omitted altogether, as these crises begin in 2007 or later, and debt stock comparison here is with three years after the beginning of the banking crisis.
3. Public debt: an update
We are certainly on track to the 86 percent mark. We updated this exercise,
measuring real debt increases from 2007 to the latest numbers for 2009. Across the real
public debt of Iceland, the U.S., the U.K., Ireland and Spain, in the first two years
it is still 157 percent. Thus, we are marching towards the near-doubling of the public
debt.
III. Causes, Symptoms, and Amplifiers of Financial Crises
As to the causes of these great crises, we next focus on those factors that are
common across time and geography; we discriminate between root causes of the crisis, its
symptoms, and features such as financial regulation which serve as amplifiers of the
boom-bust cycle. Pertinent to the globalization theme of this conference, the discussion
begins with the link between financial liberalization (internal and external), the financial
innovation and credit booms these spawn and banking crises.
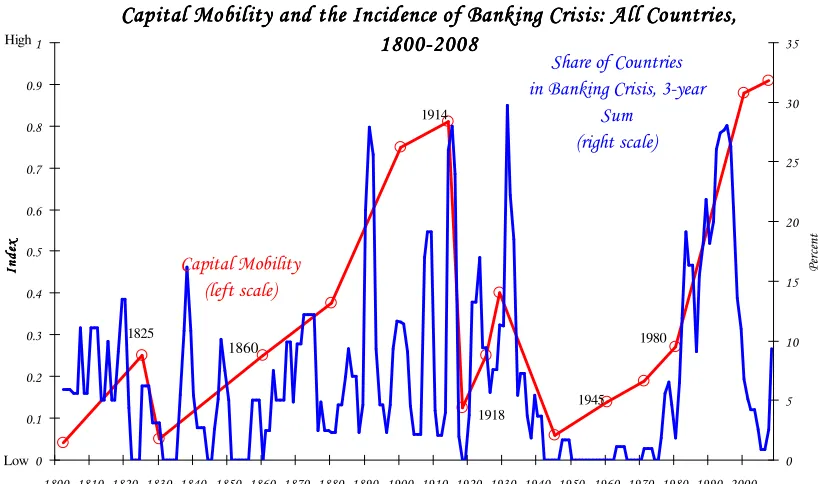
1. The roots
There is a striking correlation between freer capital mobility and the incidence of
banking crises, as shown in Figure 6. Periods of high international capital mobility
have repeatedly produced international banking crises, not only famously as they did in
the 1990s, but historically. The figure plots a three-year moving average of the share of
all countries experiencing banking crises on the right scale. On the left scale, we graph
the index of capital mobility, due to Obstfeld and Taylor (2004), updated and back cast
using their same design principle, to cover our full sample period. While the Obstfeld–
Taylor index may have its limitations, we feel it nevertheless provides a concise summary
of complicated forces by emphasizing de facto capital mobility based on actual flows.
For the post-1970 period, Kaminsky and Reinhart (1999) present formal evidence
on the links of crises with financial liberalization. In 18 of the 26 banking crises they
crises of varying severity. Only in a handful of countries (for instance, Canada) did
financial sector liberalization proceed smoothly. Specifically, the paper presents
evidence that the probability of a banking crisis conditional on financial liberalization
having taken place is higher than the unconditional probability of a banking crisis.
Figure 6 ! ! !" !# !$ !% !& ! !'
" # $ % & ' ' ' ' '" '# '$ '% '& ' ''
(((( $ $ $ " "$ ) 1860 * + , " , -* + 1914 1945 1980 1825 1918 High Low
Sources: Bordo et al. (2001), Caprio et al. (2005), Kaminsky and Reinhart (1999), Obstfeld and Taylor (2004), and these authors.
Notes: This sample includes all countries (even those not in our core sample of 66). The full listing of banking crises dates are shown in Appendix II. On the left scale, we updated our favorite index of capital mobility, admittedly arbitrary, but a concise summary of complicated forces. The smooth red line shows the judgmental index of the extent of capital mobility given by Obstfeld and Taylor (2004), back cast from 1800 to 1859 using their same design principle.
2. The setting
Across countries and over the centuries, economic crises of all type follow a
similar pattern. An innovation emerges. Sometimes it is a new tool of science of
industry, such as the diving bell, steam engine, or the radio. Sometime it is a tool of
financial engineering, such as the joint-stock company, junk bonds, or collateralized debt
[image:15.612.93.502.219.461.2]described above. Investors may be wary at first, but then they see that extraordinary
returns appear available on these new instruments and they rush in. Financial
intermediaries—banks and investment companies—stretch their balance sheets so as not
to be left out. The upward surge in asset prices continues, and that generation of financial
market participants concludes that rules have been rewritten: Risk has been tamed, and
leverage is always rewarded. All too often, policy makers assert that the asset-price
boom is a vote of confidence on their regime—that “this time is different”. Only
seldom, to my knowledge, do they protest that perhaps the world has not changed and
that the old rules of valuation still apply.
But the old rules do apply. The asset price rise peters out, sometimes from
exhaustion on its own or sometimes because of a real shock to the economy. This exposes
the weaknesses of the balance sheets of those who justified high leverage by the
expectation of outsized capital gains. Many financial firms admit losses, and some
ultimately fail. All those financial firms hunker down, constricting credit availability in
an effort to slim their balance sheets. With wealth lower and credit harder to get,
economic activity typically contracts. Only after the losses are flushed out of the financial
system and often with the encouragement of lagging monetary and fiscal ease does the
economy recover.
3. The symptoms
The recurring historical pattern described above is associated with some
well-defined symptoms. I will focus here on a few of the symptoms or quantitative parallels
emerging market economies alike.4 Specifically, large capital inflows, sharp housing and
equity price run-ups lead the “leading indicator” group. So have been surges in private
domestic and external debts. These symptoms are quantifiable, unlike the more nebulous
amplifiers that are discussed in the remainder of this section.
Table 1. Quantitative antecedents of financial crises: The “lead” of the leading indicators
Large capital inflows Sharp run-ups in equity prices Sharp run-ups in housing prices Inverted V-shaped growth trajectory
Marked rise in indebtedness
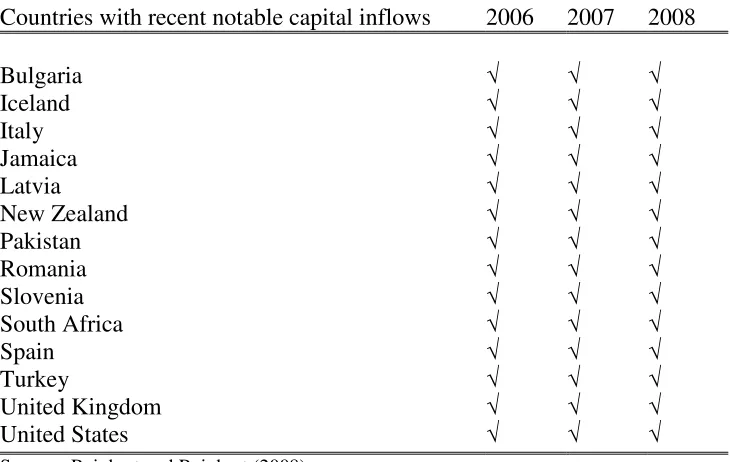
If we were to quantify periods of capital flow bonanzas—periods where capital
inflows are unusually large—who comes up on the radar screen prior to the 2007-2009
crisis? As Reinhart and Reinhart (2008) document, in addition to the U.S. and the U.K.,
the other names that are listed there—Spain, Italy, Iceland, Ireland—are all countries that
have had a period where the large capital inflows ended badly. Capital inflows facilitate
domestic lending, fuel asset prices, and in most instances increase the indebtedness of the
private sector, the public sector (if the government behaves procyclically), or both.
4
Table 2 Capital Inflows Typically Surge Ahead of Financial Crisis
There is a sense that the U.S. housing price bubble during 2000-2006 (primarily)
is both unique and unprecedented. The magnitude of the bubble is certainly
unprecedented to the United States—at least during the past century for which we have
comparable data. However, in a broader global context, the sub-prime bubble is neither
unique to the U.S. nor it magnitudes out of line with other real estate bubbles that have
also ended equally lamentably in financial crises.
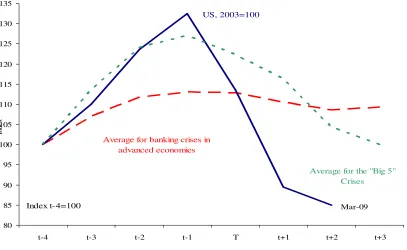
Figure 7 compares the run-up in housing prices. Period T represents the year of
the onset of the financial crisis. By that convention, period T-4 is four years prior to the
crisis, and the graph in each case continues to T+3, except of course in the case of the
U.S. 2007 crisis, which remains in the hands of the fates.5 The chart confirms the case
Countries with recent notable capital inflows 2006 2007 2008
Bulgaria Iceland Italy Jamaica Latvia
New Zealand Pakistan Romania Slovenia South Africa Spain
Turkey
United Kingdom United States
Source: Reinhart and Reinhart (2008).
study literature, showing the significant run-up in housing prices prior to a financial
crisis. Notably, the run-up in housing prices in the United States exceeds that of the “Big
Five” crises (Spain, 1977, Norway, 1987, Finland, 1991, Sweden 1991, and Japan 1992).
The boom in real housing prices (or real estate, and other asset prices, more
broadly) is typically fueled by ample domestic credit availability, large capital inflows,
and an easy liquidity environment. Coupling the ample liquidity environment with the
presumption that this time is different and that the old rules of valuation do not apply, then
you have the makings or the ingredients for a crisis.
As to growth (inverted V-shaped pattern)–growth does very well ahead of the
crisis when credit is ample and wealth effects are positive (as asset prices climb) and falls
subsequently. For further evidence the reader is referred to RR.
I cannot stress enough the importance of the last entry in Table 1, a marked rise
in indebtedness. Rising indebtedness can be domestic, external or both. In can be private,
public or both. Any combination of these forms of rising indebtedness has been a
hallmark of the pre-crisis period as far back as our data can take us. Perhaps Iceland
illustrates this point in its most extreme form, as external debts rise from about 90 percent
of GDP in 2000 to well over 900 percent of GDP in 2009. It is worth noting that stating
that there are capital inflows is usually a different of observing that a country is borrowing
Figure 7. Real Housing Prices and Banking Crisis
Source: Reinhart and Rogoff (2009).
80 85 90 95 100 105 110 115 120 125 130 135
t-4 t-3 t-2 t-1 T t+1 t+2 t+3
In
d
ex
Average for banking crises in advanced economies
US, 2003=100
Index t-4=100
Average for the "Big 5" Crises
4. The “amplifiers”
The list (shown on Table 3) of what I have dubbed the “usual suspects”, despite
its breadth, is not meant to be exhaustive. It is a list that has withstood the test of time, as
several of these amplifiers come up on a recurring and it is those are not unique to the
United States subprime crisis. Countless case studies of banking crises, across countries
and time (see references in RR) list these factors on a recurring basis--often blamed as
underlying causes of the crises. However, these factors exacerbate both the boom and
bust phases of the crisis cycle. For example, the stylized evidence presented in Caprio
and Klingebiel (1996) suggests that inadequate regulation and lack of supervision at the
time of the liberalization may play a key role in explaining why deregulation and banking
crises are so closely entwined. But it is difficult to explain a cycle with a constant.
Supervision may have always been lacking and the regulations ill defined. Such
deficiencies may have limited consequences when credit conditions are tight (or in the
case of emerging markets when access to international capital markets is not possible). If,
in contrast, financial liberalization (domestic an external) creates lending possibilities that
did not exist before, then inadequate supervision can make a bad lending scenario worse.
Outright fraud, (often through connected lending) which crops up as another hardy
perennial in studies of the run-up to crises works the same way.
The procyclicality of credit ratings (both at the sovereign and corporate levels, see
Reinhart, 2002) also acts to amplify the cycle of lending and subsequent default and
crash. Overvalued currencies are a magnet for capital inflows while procyclical fiscal
Far from being mutually exclusive many, if not most of the items in this list are
present simultaneously in the most severe financial crises through out history.
Table 3. Amplifliers of boom-bust cycles: The usual suspects
Procyclical macroeconomic policies Hidden debts (implicit guarantees)
Overvalued currencies Poor regulation Even worse supervision
Outright fraud
Myopic credit rating agencies
5. A digression on the sequencing of crises
Just as financial crises have common macroeconomic antecedents in asset prices,
economic activity, external indicators and so on, so common patterns appear in the
sequencing (temporal order) in which crises unfold. Obviously not all crises escalate to
the extreme outcome of a sovereign default. Yet, advanced economies have not been
exempt from their share of currency crashes, bouts of inflation, severe banking crises,
and, in an earlier era, even sovereign default. The point of this short digression is to note
that the long debt cycle we have discussed does not necessarily end with a banking
crisis—more bad news usually follows—a stylized fact that should be kept in mind when
trying to make sense of the current conjuncture.
Investigating what came first, banking or currency crises, was a central theme of
Kaminsky and Reinhart’s (1999) “twin crises” work; they also concluded that financial
liberalization often preceded banking crises; indeed, it helped predict them.
external debt crises, inflation crises and default (domestic or external), and banking crises
and external default.6 Figure 7 maps out a “prototypical” sequence of events yielded by
this literature.
As Diaz-Alejandro (1985) narrates in his classic paper about the Chilean
experience of the late 1970s and early 1980s, “Goodbye Financial Repression, Hello
Financial Crash,” financial liberalization simultaneously facilitates banks’ access to
external credit and more risky lending practices at home. After a while, following a
boom in lending and asset prices, weaknesses in bank balance sheets become manifest
and problems in the banking sector begin.7 Often these problems are more advanced in
the shakier institutions (such as finance companies) than in the major banks.
The next stage in the crisis unfolds when the central bank begins to provide
support for these institutions by extending credit to them. If the exchange rate is heavily
managed (it does not need to be explicitly pegged), a policy inconsistency arises between
supporting the exchange rate and acting as lender of last resort to troubled institutions.
The very numerous experiences in these studies suggest that (more often than not) the
exchange rate objective is subjugated to the lender of last resort role of the central bank.
Even if central bank lending to the troubled financial industry is limited in scope, the
central bank may be more reluctant to engage in an “interest rate defense” policy to
defend the currency than would be the case if the financial sector were sound. This brings
the sequence illustrated in Figure 7 to the box labeled currency crash.
FIGURE 7 The sequencing of crises: A prototype
6
Reinhart and Rogoff (2004) also examined the relationship between currency crashes and inflation as well as the currency crash–capital control (specifically, dual or multiple exchange rates) timing.
7
external default
stock and real estate market
crashes--economic slowdown begins
Financial Beginning Currency Inflation Peak Default Inflation crisis
Liberalization of banking crash picks up of banking on external worsens
crisis crisis and/or Peak of
(if no default) domestic debt banking crisis
(if default occurs)
Capital controls introduced or increased Kaminsky-Reinhart "twin crises"
Diaz-Alejandro's "goodby financial repression, hello financial crash"
around this time
Reinhart-Rogoff, 2008c no clear sequence of
domestic versus
Sources: Authors’ introspection based on empirical evidence from: Demirgüç-Kunt and Detragiache (1998), Diaz-Alejandro (1985), James (2002), Kaminsky and Reinhart (1999), Kindelberger (1985), Reinhart (2002), Reinhart and Rogoff (2004 and 2008c), among others.
The depreciation or devaluation, as the case may be, complicates the situation in
(at least) three dimensions: (a) it exacerbates the problem of the banks who have
borrowed in a foreign currency, worsening currency mismatches; (b) inflation usually
worsens (The extent to which the currency crisis translates into higher inflation is highly
uneven across countries, as countries with a history of very high and chronic inflation
usually have a much higher and faster pass-through from exchange rates to prices); and
(c) if the government has foreign currency–denominated debt, the currency depreciation
increases the odds of an external and domestic default.
At this stage, the banking crisis either peaks following the currency crash, if there
This is a very common pattern in the sequencing of crises. Notice the first entry
there has financial liberalization. And financial liberalization is really not just
liberalization proper, but big innovation, creations of new market. In the current
conjuncture, the creation or the growth of securitization of mortgages is a big factor.
Notice, perhaps more grimly, that the last entry is a debt crisis, which brings me to my
concluding remarks.
IV. Concluding reflections on complacency and debt
Many (if not most) of the advanced economies of the world are faced with a
worrisome public debt profile over the medium term. The debt profile is even more
alarming if contingent liabilities and the graying of the population is factored in the
analysis.
Many emerging markets—singularly in Eastern Europe and the former Soviet
Union—also have external debt levels (public plus private) that have been often
associated historically with debt servicing difficulties and outright default.
Outside of Emerging Europe, the view is that emerging markets have weathered
the storm. Indeed, a very important factor in this capacity to cope with such a massive
adverse shock during 2007-2009 is importantly linked to the fact that many important
emerging markets, most notably in Asia and Latin America had reduced their debt
burdens (particularly external debts) during the boom of 2000-2006 (where the private
sector in advanced economies were rapidly becoming highly leveraged). Governments
have been well placed to finance the recession-induced deficits through domestic debt.
many emerging market governments from external to domestic bond issues is
revolutionary and unprecedented.8 Nothing could be further from the truth; this is
“dangerous complacency.” As RR highlight, domestic debts accounted for more than
half of public debts in emerging markets since 1900. There are also plenty of examples of
defaults on domestic debt. Domestic debt, no doubt has many advantages over external
debt—but is not the panacea that many believe it is. Advanced economies are in the
process of painfully illustrating this point at the time of this writing. Domestic debt also
has to be repaid.
I will conclude with this uplifting note. Public debt levels have been soaring in
many countries owing primarily to a weak economy; private debt levels are not coming
down quickly enough for virtually for the same reason. Without being melodramatic, the
odds for a much higher incidence of default and (or) a higher incidence of inflation,
should not be underestimated.
References
Diaz-Alejandro, Carlos (1985), “Goodby Financial Repression, Hello Financial Crash,”
Journal of Development Economics 19.
Kaminsky, Graciela L. and Carmen M. Reinhart, (1999). “The Twin Crises: The Causes
of Banking and Balance of Payments Problems”, American Economic Review,
Vol.89 No.4, June, 473-500.
Kaminsky, Graciela, Carmen M. Reinhart and Carlos A.Végh( 2004) “When It Rains, It Pours: Procyclical Capital Flows and Policies”, with. in Mark Gertler and Kenneth S. Rogoff, eds. NBER Macroeconomics Annual 2004. Cambridge, Mass: MIT Press, 11-53
Reinhart, Carmen M. and Vincent R. Reinhart, “Capital Flow Bonanzas: An
Giavazzi (eds.) NBER International Seminar in Macroeconomics 2008, (Chicago: Chicago University Press for the NBER, 2009). 1-54
Reinhart, Carmen M. and Rogoff, Kenneth S. (2009), This Time is Different: Eight
Centuries of Financial Folly (Princeton: Princeton Press).