http://dx.doi.org/10.4236/am.2016.714133
How to cite this paper: Prieto, G., Prieto, O., Unzaga, T., Gay, C., Takashima, K. and Mizuno, A. (2016) The Statistical Expe-rimental Design for Chemical Reactors Modeling. Applied Mathematics, 7, 1534-1546.
http://dx.doi.org/10.4236/am.2016.714133
The Statistical Experimental Design for
Chemical Reactors Modeling
Graciela Prieto1*, Oscar Prieto1, Teresa Unzaga1, Carlos Gay1, Kazunori Takashima2,
Akira Mizuno2
1The Universidad Nacional de Tucumán, San Miguel de Tucumán, Argentina 2The Toyohashi University of Technology, Toyohashi, Japan
Received 1 May 2016; accepted 21 August 2016; published 24 August 2016
Copyright © 2016 by authors and Scientific Research Publishing Inc.
This work is licensed under the Creative Commons Attribution International License (CC BY).
http://creativecommons.org/licenses/by/4.0/
Abstract
The Statistical Experimental Design techniques are the most powerful tools for the chemical reac-tors experimental modeling. Empirical models can be formulated for representing the chemical behavior of reactors with the minimal effort in the necessary number of experimental runs, hence, minimizing the consumption of chemicals and the consumption of time due to the reduction in the number of experimental runs and increasing the certainty of the results. Four types of nonthermal plasma reactors were assayed seeking for the highest efficiency in obtaining hydrogen and ethy-lene. Three different geometries for AC high voltage driven reactors, and only a single geometry for a DC high voltage pulse driven reactor were studied. According to the fundamental principles of chemical kinetics and considering an analogy among the reaction rate and the applied power to the plasma reactor, the four reactors are modeled following the classical chemical reactors design to understand if the behavior of the nonthermal plasma reactors can be regarded as the chemical reactors following the flow patterns of PFR (Plug Flow Reactor) or CSTR (Continuous Stirred Tank Reactor). Dehydrogenation is a common elimination reaction that takes place in nonthermal plasmas. Owing to this characteristic, a paraffinic heavy oil with an average molecular weight cor-responding to C15 was used to study the production of light olefins and hydrogen.
Keywords
Chemical Reactors Modeling, Statistical Experimental Designs, Nonthermal Plasma Chemical Reactors
1. Introduction
Nonthermal Plasma reactors have shown an increasingly attraction power due to their ability in destroying ha-zardous compounds in flue gases as well as their potentiality in producing more valuables compounds from raw materials of low value, sometimes representing waste or disposable materials.
The plasmas generated by electrical discharge in gases have a variety of application fields. During a discharge in a gaseous media, free electrons gain energy from the applied electrical field and loose this energy through collisions with the molecules of the gas. The energy transference to the molecules conduce to the formation of various new excited species, including atoms, metastable species, free radicals and ions, all of them chemically actives and hence, able to be precursors in the formation of new stable compounds. Then, the highly energetic electrons are responsible of the chemical reactions, in a direct way by collisions, or in an indirect way by the creation of free radicals that in turn can initiate and propagate the chemical reactions. The plasma chemistry is the field that takes into account the chemical reactions occurring in a partially ionized gas. Dehydrogenation is a common reaction, whose driving force is the large concentration of atoms and free radicals found in organic plasma systems which can react to abstract hydrogen. Compounds such as paraffins normally form a variety of products, which, depending on the reaction conditions, may contain considerable amounts of olefins, eliminating hydrogen easily and with high yields [1].
The main goal of the present paper is to apply the Statistical Experimental Design techniques for studying the behavior of nonthermal plasma reactors, trying to classify them into the ideal “plug flow” or “well mixed” pat-terns. The design equations for flow conditions establish that the reactor volume is the physically occupied by the reacting fluids. From this concept, the nonthermal plasma reactors volume is considered that which is con-fined into the gap distance between electrodes. In this way, changing the carrier gas flows and the gap distance between electrodes many residence times can be obtained. Then, using the mathematical models for ideal plug flow reactors (PFR) and continuous stirred tank reactors (CSTR), and plotting the reverse of the reaction rate versus the products concentration, the corresponding areas under the curves are calculated. Finally, the calcu-lated areas that, respond to mathematical models of the ideal CSTR and PFR reactors, are compared with the experimental values to infer the behavior of the nonthermal plasma reactors flow pattern.
Four nonthermal plasma reactors were constructed to study the reaction of heavy oil with an average molecu-lar weight represented by C15 paraffin. The main products obtained were ethylene and hydrogen. Other olefins of low molecular weight (C3 and C4) were also obtained, but in very low concentrations [2] [3].
This work was developed from a very novel point of view: the modeling of nonthermal plasma reactors as ideal chemical reactors CSTR (Continuous Stirred Tank Reactor) and PFR (Plug Flow Reactor). The high com-plexity of modeling nonthermal plasma reactors lies in the lack of thermal equilibrium between the gaseous mass (at near-room temperature) and the electrons that acquire high temperatures because of the strong electric field applied. This characteristic of nonthermal plasma reactors makes this paper a very interesting and novel approach because the absence of thermal equilibrium disables the use of classical thermodynamics and therefore, the use of the concepts of chemical equilibrium.
Mathematical models of ideal chemical reactors assume the state of thermal equilibrium as the starting point. According to the flow patterns, the state of thermal equilibrium is radial for Tubular Plug Flow Reactors and in the complete volume for Continuous Stirred Tank Reactors with thorough mixing.
Statistical Treatment
Often, the common situation in experimental research is to look for the most desirable conditions of experimen-tation depending upon some pre-selected criterion as, say, the determination of optimum operating conditions of a reactor.
One possible way is to use the experimental information to construct mathematical models capable of representing the actual state of the process. These models must correlate target parameters, such as efficiency or yield, with those variables that may exert influence over them. So, the study is oriented towards obtaining expe-rimental data, selecting the appropriate model and estimating the parameters involved in the model [4].
“response”, while the input variables are called “independent variables” because they are subject to the control of the engineer or scientist, at least for testing or experimental purposes. So the Response Surface Methodology (RSM) allows the researcher to have a graphical perspective of the problem and of the process optimization in the vicinity of the maximum [5] [6].
In the practical application of the surface response methodology (RSM), it is necessary to develop an ap-proximating model for the true response surface. The underlying true response surface is typically driven by some unknown physical mechanism. The approximating model is based on observed data from the process or system and it is an empirical model. Multiple Regressions is a collection of statistical techniques useful for building the types of empirical models required in RSM [5] [6].
As a preliminary approach, a first-degree-polynomial model is considered. The design chosen for an efficient fitting and checking of this model is a complete factorial experimental design at two levels. This design is cha-racterized by the fact that each variable can only assume two values: maximum and minimum, which are called “levels of the variables”. The number of trials is equal to all the possible combinations of the variables and le-vels chosen. These designs cannot afford an estimate of the experimental error unless some runs are repeated. A common method of including replication in the design is to augment the design with several observations at the center of the range of each variable. Then, the experimental error is calculated with experiments that are repeti-tions at the center point of the design.
The results of the factorial experiments are processed statistically for the calculation of the main effects and the interactions. The main effect of a variable should be individually interpreted only if there is no evidence that the variable interacts with other variables. When there is evidence of one or more interaction effects, the inte-racting variables should be considered together. The effect of a variable is defined as the change in the response produced by a change in the level of that variable. When the difference in response between the levels of one variable is not the same at all levels of the other variables, there is an “interaction” between those variables [4]-[6].
For the present research, a complete factorial experimental design at two levels was selected as a preliminary approach to a first-degree-polynomial model.
2. Experimental
Taking advantage of the potentiality of the Statistical Experimental Design techniques, four types of nonthermal plasma reactors were assayed seeking for the highest efficiency in obtaining hydrogen and ethylene. Three dif-ferent geometries for AC high voltage driven reactors (Plate-Plate, Packed-Bed, Needle-Plate) and only a single geometry for a DC high voltage pulse driven reactor (Coaxial) were studied. The variables selected were “input power”, “gap distance between electrodes” and, “carrier gas flow”.
The experimental runs were carried out according to a “central composite experimental design at two levels” [4].
Figure 1 shows the schematics of the Packed-Bed reactor. The selected variables were: Gas Flow (mL/min): 50 - 400; Gap distance (cm): 0.5 - 3; Input power (w): 5 - 25.
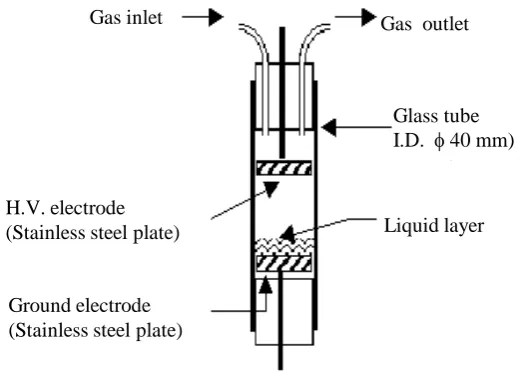
Figure 2 shows the schematics of the Needle-Plate reactor. The selected variables were: Gas Flow (mL/min): 50 - 400; Gap distance (cm): 0.3 - 1; Input power (w): 2.5 for all the experimental runs.
Figure 3 shows the schematics of the Plate-Plate reactor. The selected variables were: Gas Flow (mL/min): 50 - 400; Gap distance (cm): 0.30 - 1.00; Input power (w): 3 - 12.
Figure 4shows the schematics of the coaxial type reactor. The selected variables were: Reactor volume (mL): 6 - 36; Residence time (min):0.04 - 0.20; Input power (w): 9 - 25.
3. Results and Discussion
The rate of reaction (−rj) is defined as the number of moles of a reacting substance that disappear or the number
of moles of a product appearing per unit time and per unit volume (mol/liter min). In heterogeneous reaction systems, the rate of reaction is usually expressed in measures other than volume, such as reaction surface area or catalyst weight. Thus, for a gas-solid catalytic reaction the dimensions of the rate, (−rj′), are the number of
moles of A reacted per unit time and per unit mass of catalyst [7]-[10].
Figure 1.Diagram of the Packed-Bed plasma reactor.
Figure 2. Diagram of the Needle-Plate plasma reactor.
Figure 3. Diagram of the Plate-Plate plasma reactor.
Ferroelectric pellet
BaTiO3
eS= 4500 diameter: 3 mm
Gas outlet
Gas inlet
Glass Tube I.D. 40 mm
H.V. electrode (Stainless steel plate)
Ground electrode (Stainless steel plate)
Gas inlet
H.V. electrode Stainless Steel needle
Ground electrode (Stainless steel plate)
Gas outlet
Glass tube I.D. 40 mm)
Liquid layer
Ground electrode (Stainless steel plate) H.V. electrode (Stainless steel plate)
Gas inlet Gas outlet
Glass tube I.D. φ40 mm)
[image:4.595.184.448.517.706.2]Figure 4.Diagram of the coaxial plasma reactor.
radiation inside the system (can affect the atoms binding energy), magnetic field, electric field, etc. [11]. Four nonthermal plasma reactors were constructed to study the reaction of heavy oil with an average molecu-lar weight represented by C15 paraffin. The main products obtained were ethylene and hydrogen. Other olefins of low molecular weight (C3 and C4) were also obtained, but in very low concentrations [2] [3].
A kind of reactor very commonly used in industrial processes is the Continuous Stirred Tank Reactor (CSTR reactor), which normally operates in steady state in a perfectly well mixed mode. As a consequence of this hy-pothesis of flow, the CSTR reactors are modeled without space variations of the concentrations, temperature and reaction rate, which means that the output value of these variables are identical to those inside the reactor. Then, the design equation of a CSTR reactor gives the necessary volume of reactor to reduce the molar flow rate value at the inlet (Fjo) to the outlet molar flow rate value (Fj). Then, V = (Fjo − Fj)/(−rj).
Another very common reactor in industry is the Plug Flow Reactor (PFR), which consists in a cylindrical tube normally operating at steady state. For turbulent flow patterns, the PFR can be modeled under the hypothesis of plug flow, which implies no existence of radial gradients of concentration. In the PFR reactors, reactants are continuously consumed as they flow along the reactor. Then, the rate of reaction, which is a function of the concentration, also varies axially. Thus, V=
∫
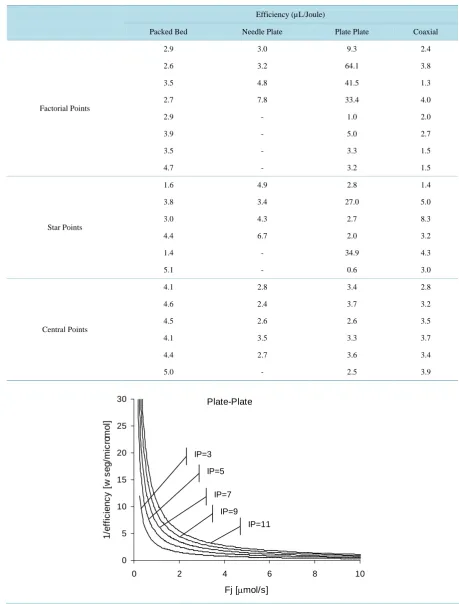
dF rj j. Plotting (1/rj) vs (Fj), the area under the curve represents the reactor volume. Analogously, for the CSTR reactor, because the reaction rate is constant, the volume is the area under the curve of a rectangle obtained multiplying (1/rj) by (Fj).The above mentioned theoretical concepts of the rate of reaction and the modeling of CSTR and PFR reactors, give us the bases for assuming the following considerations: the analysis of data from the experimental runs car-ried out with the nonthermal plasma reactors gave information about the effectiveness of the reactors in carrying out the conversion of heavy oil into light hydrocarbons. The variable calculated was the Efficiency (E), ex-pressed in the units (microliter/Joule) and defined as the ratio between the Total Flow Rate of Carbon Com-pounds (exiting the reactors) and the corresponding Input Power. Efficiency, then, was considered as the rate of products formation expressed as (microliter/Joule) equal to (microliter/W.sec), and transformed into (µmol/W. sec), regarding the gaseous products as ideal gases. Then, Efficiency gives the µmoles of gaseous products per unit of time and per unit of power. This is the main analogy that considers the efficiency as the rate of gaseous products formed in the nonthermal plasma reactors equivalent to the rate of the chemical reaction, defined as the number of moles of substance converted or produced per unit time and per unit volume (mol/Liter.min) [7]-[10]. Table 1shows the experimental results obtained for all the reactors here assayed.
From this assumption and using the experimental data, graphics were made by plotting (1/Efficiency) vs (Fj), Fj being the number of gaseous products produced per unit of time expressed as (micromoles/sec). Figure 5 shows this graphic for the plate-plate reactor.
As in the analysis for CSTR and PFR reactors, the areas under the curves were calculated. In the case of the nonthermal plasma reactors, the areas under the curves represent the input power expressed in watts instead of the volume obtained from similar graphics for the CSTR and PFR reactors.Figures 6-10 show the areas under the curves (1/Efficiency) vs (Fj).
The areas under the curves represent the behavior of a plug flow pattern, according to the corresponding ma-thematical model equation for PFR reactors. The areas of rectangles under the curves represent the behavior of a well-mixed flow pattern, according to the corresponding mathematical model equation for CSTR reactors.
Ground electrode (aliminum foil)
Gas inlet Gas outlet
Corona electrode (Stainless steel wire) φ0.2 mm
Table 1. Experimental conditions and results.
Efficiency (µL/Joule)
Packed Bed Needle Plate Plate Plate Coaxial
Factorial Points
2.9 3.0 9.3 2.4 2.6 3.2 64.1 3.8 3.5 4.8 41.5 1.3 2.7 7.8 33.4 4.0 2.9 - 1.0 2.0 3.9 - 5.0 2.7 3.5 - 3.3 1.5 4.7 - 3.2 1.5
Star Points
1.6 4.9 2.8 1.4 3.8 3.4 27.0 5.0 3.0 4.3 2.7 8.3 4.4 6.7 2.0 3.2 1.4 - 34.9 4.3 5.1 - 0.6 3.0
Central Points
[image:6.595.79.539.96.701.2]4.1 2.8 3.4 2.8 4.6 2.4 3.7 3.2 4.5 2.6 2.6 3.5 4.1 3.5 3.3 3.7 4.4 2.7 3.6 3.4 5.0 - 2.5 3.9
Figure 5.Plate-Plate reactor. Values of (1/Efficiency) as a function of (Fj). Gap Distance = 0.3 - 1.0 (cm) and Flow Rate = 50, 100, 150, 250 (mL/min).
Plate-Plate
0 5 10 15 20 25 30
0 2 4 6 8 10
Fj [µmol/s]
1/
ef
fi
c
ienc
y
[
w
s
eg/
m
ic
ro
m
ol
]
IP=3
IP=5
IP=7
Figure 6.Plate-Plate reactor. Areas under the curves (1/Efficiency) vs (Fj) from Figure5. Input Power = 3 - 11(watt).
Figure 7. Plate-Plate reactor. Areas of rectangles under the curves (1/Efficiency) vs (Fj) from Figure5. Input Power = 3, 5, 7, 9, 11 (watt).
Figure 8. Packed-Bed reactor. PFR: Areas under the curves (1/Efficiency) vs (Fj). CSTR: Areas of rectangles under the curves (1/efficiency) vs (Fj). Input Power = 7 (watt).
Plate -Plate PFR
0 10 20 30 40 50 60 70 80
0 2 4 6 8 10 12
Fj [µmol/seg]
A
rea [
w
]
IP=3 IP=5 IP=7 IP=9 IP=11
Plate -Plate CSTR
0 2 4 6 8 10 12
0 2 4 6 8 10 12
Fj [µmol/seg]
A
rea [
w
]
IP=3 IP=5 IP=7 IP=9 IP=11
Packed-Bed
0 5 10 15 20 25
0 0.5 1 1.5 2 2.5 3
Fj[μmol/seg]
Ar
ea [
w
]
IP= 7 PFR
[image:7.595.185.436.511.694.2]Figure 9. Coaxial reactor. PFR: Areas under the curves (1/Efficiency) vs (Fj). CSTR: Areas of rectangles under the curves (1/efficiency) vs (Fj). Input Power = 16 (watt).
Figure 10. Needle-Plate reactor. PFR: Areas under the curves (1/efficiency) vs (Fj). CSTR: Areas of rectangles under the curves (1/efficiency) vs (Fj). Input Power = 2.5 (watt).
The areas under the curves in Figures 6-10represent the power consumed (input power) to obtain the corres-ponding molar flow rates of gaseous products Fj. These areas, in turn, represent their respective efficiency. The “real input power” for each reactor is shown on the graphics.
Only in the case in which the “input power” is about the same as the value of the “area” can we conclude that the respective nonthermal plasma reactor behaves like a “Plug Flow Reactor” or a “Continuous Stirred Tank Reactor”.
From the analysis of the graphics, the plate-plate reactor is the only one that corresponds to the Continuous Stirred Tank Reactor model (CSTR). As regards the plug flow pattern, none of the reactors behave like a Plug Flow Reactor (PFR).
During a discharge in a gaseous media, free electrons gain energy from the applied electrical field and loose this energy through collisions with the molecules of the gas. The energy transference to the molecules results in the formation of various new excited species including atoms, metastable species, free radicals and ions, all of them chemically active and, therefore, able to be precursors in the formation of new stable compounds [1]. Inte-ractions between the excited species, generated by Coulomb forces, can either attract or repel each other,
com-Coaxial
0 5 10 15 20 25 30
0 1 2 3 4 5
Ar
ea [
w
]
IP=16 PFR
CSTR
Fj[μmol/seg]
Needle - Plate
0 0.5 1 1.5 2 2.5 3 3.5
0 0.2 0.4 0.6 0.8 1
A
rea [
w
]
PFR
CSTR
[image:8.595.174.453.315.505.2]municating these forces to the surrounding fluid through the reactions between the charged entities (ions, elec-trons, particles, etc.) and the fluid [5]. Moreover, the flow patterns inside the nonthermal plasma reactors are greatly influenced by the electrodes geometry. Strong nonuniform electric fields are generated in the “needle- plate reactor due to its needle electrode as well as in the “coaxial reactor” due to its small diameter wire elec-trodes On the contrary, for the “plate-plate reactor” the resulting electrical field is uniform. According to the experimental results for modeling the “plate-plate”, “packed-bed”, “needle-plate” and “coaxial” nonthermal plasma reactors where the conversion of heavy oil was carried out to obtain light olefins and hydrogen, the plate-plate reactor is the only reactor that corresponds to the Continuous Stirred Tank Reactor model (CSTR). This means that the plate-plate reactor behaves as a perfectly well-mixed flow pattern. Most probably, the rea-son is the homogeneity of the electric field. Nevertheless, when the space between the plates is filled with pellets of a dielectric material, the reactor (packed-bed) does not behave with the same flow pattern as the plate-plate reactor. In the vicinity of each contact point between the pellets, discharge is taking place. This could mix the fluid well and this mixing is effective within the stream passing through a channel formed by the contacting pel-lets. In the downstream, this channel is mixed with the next channel. Therefore, mixing of the whole fluid could be possible after several stages of the pellet layers. Though Reynolds number is very low, the discharge en-hances the mixing. This is an important feature of the plasma reactor.
Regarding the well-mixed flow pattern, the tendency of the experimental results obtained for the packed-bed, needle-plate and coaxial reactors seems to reach a plateau at the value of their respective input power for higher molar flow rates beyond those here assayed. The flow behavior of all the nonthermal plasma reactors here stu-died is far from the plug flow pattern, as it is that of the ideal PFR chemical reactor.
Regarding the performance of the process, the plate-plate nonthermal plasma reactor, among all the reactors assayed, showed the best efficiency in converting heavy oil into hydrogen and light olefin hydrocarbons as well as the best selectivity towards hydrogen production.
The selected output variables were:
Efficiency of the process in producing hydrogen
Efficiency (µL/Joule) = Hydrogen produced/Input Power
Selectivity of the process in producing hydrogen
Selectivity (vol. %) = Efficiency (H2)/Efficiency (total C compounds)
The Statistical Experimental Design techniques are the most powerful tools for chemical reactors experimen-tal modeling. Empirical models can be formulated to represent the chemical behavior of reactors with the mi-nimal effort in the necessary number of experimental runs, thus minimizing chemicals and time consumption due to the reduction in the number of experimental runs and increasing the certainty of the results as well.
A convenient way for the comparative graphical representation of the experimental results is displayed in Figures 11-13.
The Analysis of Variance for the experimental results demonstrated that there exists a strong interaction be-tween the variables Input Power and Gap Distance. This means we cannot predict how the Efficiency is going to change if the variable Input Power is modified because the response of the system will depend on the particular value of the variable Gap Distance.
The complexity derives from the fact that there is interaction between all the factors above mentioned. This means that the effect of each and every variable cannot be evaluated independently. The effect each one may exert on the system will depend on the particular conditions established for the rest of the variables.
These conclusions are guaranteed by the application of the statistical experimental design techniques, which are fundamental tools for such highly complex systems.
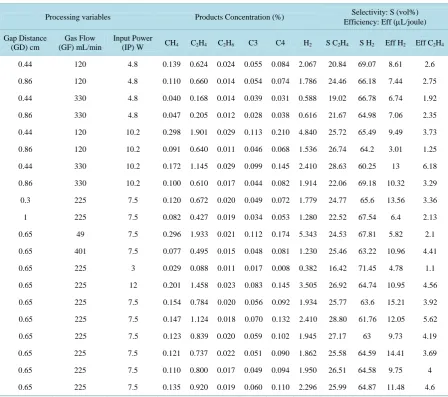
Table 2 shows the conditions and the experimental results obtained in processing heavy oil (n-C10 to n-C25) with a cold plasma reactor of the plate-to-plate type.
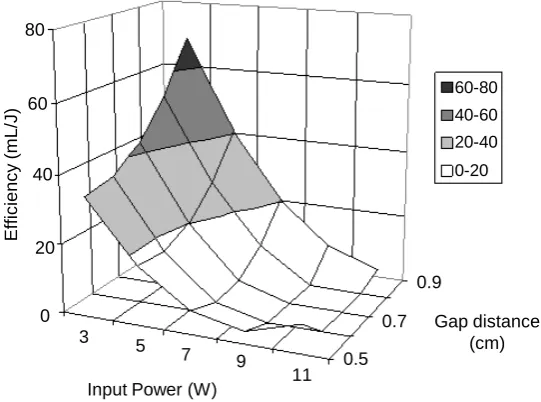
Figure 14 represents a three dimensional model of the Efficiency in producing the total low molecular weight hydrocarbons.
Figure 11. Effect of the Input Power on the concentrations of hydrogen, ethylene and methane, at the maximum residence time (minimum Gas Flow = 120 mL/min). Gap Distance between electrodes 0.65 cm (mean value of the experimental range). Concentrations are expressed in %.
Figure 12. Response surface for the selectivity (volume %) towards hydrogen for-mation as a function of the Input Power (W), and the Gas Flow (mL/min). Gap Dis-tance between electrodes 0.65 cm (mean value of the experimental range).
account for extremely high results of Efficiencies, such as 70 (µL/J). This particular high value for the efficiency evidences the existence of a parametric sensibility of the system.
Statistical experimental design techniques are worth emphasizing because they lead us to find the parametric sensibility of the system, if any, among all the variables studied within the selected experimental ranges. The significance of high process efficiency in producing light olefins lies in the fact that it implies efficiency in pro-ducing hydrogen gas as well.
4. Conclusions
The Statistical Experimental Design techniques are the most powerful tools for the chemical reactors experi-mental modeling. Empirical models can be formulated for representing the chemical behavior of reactors with
0 1 2 3 4 5 6 7 8
0 2 4 6 8 10 12
Input Power (W)
C
o
n
c
e
n
tr
a
ti
o
n H2
C2H4 CH4 H2
C2H4
CH4
H2Selectivity (Volume %)
GF
IP 350
10
0 100
[image:10.595.183.451.342.548.2]Figure 13. Response surface for the efficiency (µL/Joule) of hydrogen and ethylene production as a function of the Input Power (W), and the Gas Flow (mL/min). Gap Distance between electrodes 0.65 cm (mean value of the experimental range).
Table 2. Experimental conditions and experimental results obtained by processing residual heavy oil with a nonthermal plasma plate-to-plate reactor.
Processing variables Products Concentration (%) Selectivity: S (vol%) Efficiency: Eff (µL/joule) Gap Distance
(GD) cm
Gas Flow (GF) mL/min
Input Power
(IP) W CH4 C2H4 C2H6 C3 C4 H2 S C2H4 S H2 Eff H2 Eff C2H4 0.44 120 4.8 0.139 0.624 0.024 0.055 0.084 2.067 20.84 69.07 8.61 2.6 0.86 120 4.8 0.110 0.660 0.014 0.054 0.074 1.786 24.46 66.18 7.44 2.75 0.44 330 4.8 0.040 0.168 0.014 0.039 0.031 0.588 19.02 66.78 6.74 1.92 0.86 330 4.8 0.047 0.205 0.012 0.028 0.038 0.616 21.67 64.98 7.06 2.35 0.44 120 10.2 0.298 1.901 0.029 0.113 0.210 4.840 25.72 65.49 9.49 3.73 0.86 120 10.2 0.091 0.640 0.011 0.046 0.068 1.536 26.74 64.2 3.01 1.25 0.44 330 10.2 0.172 1.145 0.029 0.099 0.145 2.410 28.63 60.25 13 6.18 0.86 330 10.2 0.100 0.610 0.017 0.044 0.082 1.914 22.06 69.18 10.32 3.29 0.3 225 7.5 0.120 0.672 0.020 0.049 0.072 1.779 24.77 65.6 13.56 3.36 1 225 7.5 0.082 0.427 0.019 0.034 0.053 1.280 22.52 67.54 6.4 2.13 0.65 49 7.5 0.296 1.933 0.021 0.112 0.174 5.343 24.53 67.81 5.82 2.1 0.65 401 7.5 0.077 0.495 0.015 0.048 0.081 1.230 25.46 63.22 10.96 4.41 0.65 225 3 0.029 0.088 0.011 0.017 0.008 0.382 16.42 71.45 4.78 1.1 0.65 225 12 0.201 1.458 0.023 0.083 0.145 3.505 26.92 64.74 10.95 4.56 0.65 225 7.5 0.154 0.784 0.020 0.056 0.092 1.934 25.77 63.6 15.21 3.92 0.65 225 7.5 0.147 1.124 0.018 0.070 0.132 2.410 28.80 61.76 12.05 5.62 0.65 225 7.5 0.123 0.839 0.020 0.059 0.102 1.945 27.17 63 9.73 4.19 0.65 225 7.5 0.121 0.737 0.022 0.051 0.090 1.862 25.58 64.59 14.41 3.69 0.65 225 7.5 0.110 0.800 0.017 0.049 0.094 1.950 26.51 64.58 9.75 4 0.65 225 7.5 0.135 0.920 0.019 0.060 0.110 2.296 25.99 64.87 11.48 4.6
H2
C2H4
Efficiency (µL/Joule)
GF
IP 350
10 0
15
[image:11.595.88.537.324.721.2]Figure 14. Surface response for the efficiency as a function of Gap Distance (cm) and Input Power (W) using a plate-to-plate reactor. Gas Flow rate: 225 mL/min.
the minimal effort in the necessary number of experimental runs, hence, minimizing the consumption of chemi-cals and time, due to the reduction in the number of experimental runs and increasing the certainty of the results. Four nonthermal plasma reactors were constructed to study the reaction of heavy oil with an average molecular weight represented by C15 paraffin. The main products obtained were ethylene and hydrogen. Other olefins of low molecular weight (C3 and C4) were also obtained but in very low concentrations.
During a discharge in a gaseous media the energy transference from the applied electrical field to the mole-cules leads to the formation of various new excited species (atoms, metastable species, free radicals and ions), all of them chemically active and therefore, capable of being precursors in the formation of new stable com-pounds. Moreover, the flow patterns inside the nonthermal plasma reactors are greatly influenced by the elec-trodes geometry. Strong nonuniform electric fields are generated in the “needle-plate reactor” due to its needle electrode, and in the “coaxial reactor” due to its small diameter wire electrodes. On the contrary, for the “plate- plate reactor” the resulting electrical field is uniform.
According to the experimental results for modeling the “plate-plate”, “packed-bed”, “needle-plate” and “coaxial” nonthermal plasma reactors where the conversion of heavy oil was carried out to obtain light olefins and hydrogen, the plate-plate reactor is the only one that corresponds to the Continuous Stirred Tank Reactor model (CSTR). This means that the plate-plate reactor behaves as a perfectly well-mixed flow pattern. The most likely reason for this is the homogeneity of the electric field. Nevertheless, when the space between the plates is filled with pellets of a dielectric material, the reactor (packed-bed) does not behave with the same flow pattern as the plate-plate reactor. In the vicinity of each contact point between the pellets, discharge is taking place. This could mix the fluid well and this mixing is effective within the stream passing through a channel formed by the contacting pellets. In the downstream, this channel is mixed with the next channel. Therefore, mixing of the whole fluid could be possible after several stages of the pellet layers. Though Reynolds number is very low, the discharge enhances the mixing. This is an important feature of the plasma reactor.
Experimental results show the nonthermal plasma process to convert a residual Heavy Oil into a gas rich in Hydrogen in a plate-to-plate reactor type is very promising as it reaches a selectivity of about 70%, with the im-portant advantage of being generated free of carbon monoxide formation when using Argon as carrier gas. This method for producing a gas with high content of hydrogen and free of carbon monoxide becomes very interest-ing and the development of the appropriate technology for the implementation of this process seems worthwhile. It is also worth emphasizing on the importance of the statistical experimental design techniques because they lead us to find the parametric sensibility of the system, if any, among the variables studied within the selected experimental ranges.
As regards the scope of this paper, i.e., the modeling of a group of four nonthermal plasma reactors of the Plate-to-Plate; Point-to-Plate; Packed-Bed and Coaxial types by assimilating their behavior to the ideal Chemical
Gap distance (cm) 0.5
0.7 0.9
11 9 7 5 3 0 20 40 60 80
Input Power (W)
E
ffi
c
ie
n
c
y
(mL
/J
)
60-80 40-60
20-40
Reactors of the CSTR and PFR types, the modeling approach using the Statistical Experimental Design tech-niques in a well-defined range of the variables of the system turns to be very novel and useful.
Acknowledgements
This work was supported, in part, by the National University of Tucuman, Argentina and, in part, by the Toyo-hashi University of Technology, Japan. Authors would like to thank Professor Virginia E. Hawkes, from the English Department, Faculty of Exact Sciences and Technology, National University of Tucuman, Argentina, for her help with the English language.
References
[1] Suhr, H. (1974)Applications of Nonequilibrium Plasmas. In: Hollahan, J.R. and Bell, A.T., Eds., Techniques and Ap-plications of Plasma Chemistry, Wiley-Interscience, New York, 1-57.
[2] Prieto, G., Okumoto, M., Takashima, K., Katsura, S., Mizuno, A., Prieto, O. and Gay, C.R. (2003) Nonthermal Plasma Reactors for the Production of Light Hydrocarbon Olefins from Heavy Oil. Brazilian Journal of Chemical Engineering
—ABEQ, 20, 57-62.
[3] Prieto, G., Prieto, O., Gay, C.R., Mededovic, S., Takashima, K. and Mizuno, A. (2010) Hydrogen Production from Re-sidual Heavy Oil. AIChE 2010 Spring National Meeting, San Antonio, 21-25 March 2010, Advanced Fossil Energy Utilization, (95) Plasma for Energy and Environmental Applications, 95a.
[4] Box, G.E.P., Hunter, W.G. and Hunter, J.S. (1978) Statistics for Experimenters. John Wiley & Sons, Inc., New York.
[5] Montgomery, D.C. (1991) Design and Analysis of Experiments. 3rd Edition, John Wiley & Sons, Inc., New York.
[6] Myers, R.H. and Montgomery, D.C. (2002) Surface Response Methodology: Process and Product Optimization Using Designed Experiments. 2nd Edition, John Wiley & Sons, Inc., New York.
[7] Levenspiel, O. (2002) El Omnilibro de los Reactores Químicos. Ed. Reverté, España.
[8] Fogler, H.S. (2006) Elements of Chemical Reaction Engineering. 4th Edition, Prentice-Hall Inc., New Jersey.
[9] Froment, G.F., Bischoff, K.B. and De Wilde, J. (2011) Chemical Reactor Analysis and Design. 3rd Edition, John Wi-ley & Sons, Inc., New York.
[10] Hill, C.G. (1977) An Introduction to Chemical Engineering Kinetics and Reactor Design. John Wiley & Sons, Inc., New York.
[11] Crowley, J.M. (1995)Electrostatics Fundamentals. In: Chang, J.-S., Kelly, A.J. and Crowley, J.M., Eds., Handbook of Electrostatic Processes, Marcel Dekker, New York, 1-24.
Submit or recommend next manuscript to SCIRP and we will provide best service for you:
Accepting pre-submission inquiries through Email, Facebook, LinkedIn, Twitter, etc. A wide selection of journals (inclusive of 9 subjects, more than 200 journals) Providing 24-hour high-quality service
User-friendly online submission system Fair and swift peer-review system
Efficient typesetting and proofreading procedure
Display of the result of downloads and visits, as well as the number of cited articles Maximum dissemination of your research work