Munich Personal RePEc Archive
Bad loans in the meltdown: micro
analysis of credit union performance
versus banks, an initial investigation
Klinedinst, Mark
11 December 2010
!"#$%&"'($)'$*+,$-,.*#&/'0$-)12&$3'".4()($&5$62,#)*$7')&'$8,25&29"'1,$ :,2(;($!"'<(=$"'$>')*)".$>':,(*)?"*)&'$
!
Mark Klinedinst
Emeritus Professor of Economics
at the University of Southern Mississippi, Hattiesburg, MS E-mail: [email protected].
Abstract
!
"#$!%&''$()!$%*(*+,%!%',-,-!#.-!#./!.!/$0.-).),(1!,+2.%)!,(!)#$!%'$/,)!+.'3$)-!.-! $0,/$(%$/!45!4.(3!6.,7&'$-8!7.'1$!4.,7*&)-!.(/!6*'$%7*-&'$-9!!"',77,*(-!*6!/*77.'-!#.0$! 4$$(!-2$()!)*!2'*2!&2!)#$!6,(.(%,.7!-$%)*'!,(!)#$!:9;9!.7*($9!<'$/,)!&(,*(-8!
%*++$'%,.7!4.(3-!.(/!)#',6)-!.'$!=#$'$!>+$',%.(-!1*!6*'!#*+$!7*.(-8!4&)!%'$/,)! &(,*(-!#.0$!.!0$'5!/,66$'$()!)'.%3!'$%*'/!=#$(!,)!#.-!%*+$!)*!4.,7*&)-!6'*+!)#$! 1*0$'(+$()9!<'$/,)!&(,*(-!,(-)$./!*6!).3,(1!)',77,*(-!+.5!&7),+.)$75!(*)!).3$!.!/,+$! 6'*+!)#$!).?2.5$'9!"#,-!2.2$'!=,77!)'5!)*!/,-%$'(!)#,-!./0.().1$!)#.)!%'$/,)!&(,*(-! #.0$!45!6*%&-,(1!*(!)#$!/,'$%)!,+2.%)!6$7)!45!6,(.(%,.7!,(-),)&),*(-!,(!)#$!:(,)$/! ;).)$-!)#'*&1#!($)!%#.'1$@*66-!6'*+!ABBC!)#'*&1#!DEEB!&-,(1!.(!$?%$2),*(.7!/.).! -$)!)#.)!%*+4,($-!,(6*'+.),*(!*(!%'$/,)!&(,*(-!.(/!4.(3-!,(!)#$!:9;9!6'*+!ABBC! )#'*&1#!DEEB9!
! ! !
Journal of Economic Literature Classification Numbers: P0, P13, L21, G14, G21
Keywords: credit unions, banks, cooperative, defaults, net charge-offs
! !
F9!F()'*/&%),*(!
!!!!!"#$!%&''$()!$%*(*+,%!%',-,-!#.-!#./!.!/$0.-).),(1!,+2.%)!,(!)#$!%'$/,)!+.'3$)-!.-!
$0,/$(%$/!45!4.(3!6.,7&'$-8!7.'1$!4.,7*&)-!.(/!6*'$%7*-&'$-9!!"',77,*(-!*6!/*77.'-!#.0$!
4$$(!-2$()!)*!2'*2!&2!)#$!6,(.(%,.7!-$%)*'!,(!)#$!:9;9!.7*($9!<'$/,)!&(,*(-8!
%*++$'%,.7!4.(3-!.(/!)#',6)-!.'$!=#$'$!>+$',%.(-!1*!6*'!#*+$!7*.(-8!4&)!%'$/,)!
&(,*(-!#.0$!.!0$'5!/,66$'$()!)'.%3!'$%*'/!=#$(!,)!#.-!%*+$!)*!4.,7*&)-!6'*+!)#$!
1*0$'(+$()9!<'$/,)!&(,*(-!,(-)$./!*6!).3,(1!)',77,*(-!+.5!&7),+.)$75!(*)!).3$!.!/,+$!
6'*+!)#$!).?2.5$'9!"#,-!2.2$'!=,77!)'5!)*!/,-%$'(!)#,-!./0.().1$!)#.)!%'$/,)!&(*(-!
#.0$!45!6*%&-,(1!*(!)#$!/,'$%)!,+2.%)!6$7)!45!6,(.(%,.7!,(-),)&),*(-!,(!)#$!:(,)$/!
;).)$-!)#'*&1#!($)!%#.'1$@*66-!6'*+!ABBC!)#'*&1#!DEEB9!G$)!%#.'1$@*66-!.'$!7*.(-!
.(/!7$.-$-!'$+*0$/!6'*+!4.7.(%$!-#$$)-!/&$!)*!(*(@2.5+$()!+,(&-!'$%*0$'$/!7*.(-!
2'$0,*&-75!=',))$(!*669!"#$!#*&-,(1!4&447$!7$6)!+.(5!,(/,0,/&.7!&(.47$!)*!'$2.5!
)#$,'!7*.(-9!!>-!,(/,0,/&.7-!4$%.+$!&(.47$!)*!2.5!)#$,'!#*+$!7*.(-8!-*+$),+$-!/&$!
)*!4$,(1!$(),%$/!)#'*&1#!6'.&/&7$()!2'.%),%$-!H;),17,)I8!DEAE!.(/!J*#(-*(!.(/!K=.38!
DEAEL8!)#$!7*.(-!*(!)#$-$!#*+$-!.(/!+*')1.1$-!4.%3!-$%&',),$-!4.-$/!*(!)#$-$!7*.(-!
+.5!4$%*+$!,(!/$6.&7)9!M*'!)#$!7.-)!-,?)$$(!5$.'-!)#$!($)!%#.'1$@*66!'.)$!6*'!4.(3-!.-!
.!2$'%$()!*6!7*.(-!#.-!)52,%.775!4$$(!,(!)#$!'.(1$!*6!AA!)*!DE!4.-,-!2*,()-8!=#,7$!
)#*-$!6*'!%'$/,)!&(,*(-!#.-!4$$(!.4*&)!DE!2*,()-!#,1#$'!*(!.0$'.1$9!N#,7$!4*)#!
%*++$'%,.7!4.(3-!.(/!%'$/,)!&(,*(-!#.0$!4$$(!#.'/!#,)!45!)#$!$%*(*+,%!%*77.2-$!
)#,-!'$7.),0$!'.(3,(1!#*=$0$'!#.-!67,22$/!,(!)#$!%&''$()!%',-,-!-*!)#.)!4.(3-!#./!
.4*&)!.!AO!2*,()!#,1#$'!'.)$!*6!($)!%#.'1$@*66-9!>%%*&(),(1!.(/!0.7&.),*(!2'*47$+-!
2.2$'!=,77!.))$+2)!)*!+$.-&'$!=#.)!-5-)$+.),%!4$#.0,*'-!#.0$!%.&-$/!-&%#!.!'.2,/!
',-$!,(!($)!%#.'1$@*66-!.(/!#$(%$!,(!+.(5!%.-$-!4.(3!.(/!%'$/,)!&(,*(!6.,7&'$-9!!
FF9!"#$*'5!
!!!!!R.(3-!.(/!%'$/,)!&(,*(-!.'$!6,$'%$!%*+2$),)*'-!,(!+.'3$)-!.'*&(/!)#$!:9;98!.)!
7$.-)!6*'!)#$!%*(-&+$'!$(/!*6!)#$!2*')6*7,*9!<'$/,)!&(,*(-!45!7.=!.'$!'$-)',%)$/!)*!
#.0$!.!-+.77!.+*&()!*6!4&-,($--!7*.(-!.(/!.'$!'&(!.-!6,(.(%,.7!%**2$'.),0$-8!
'$)&'(,(1!,(%*+$!)*!+$+4$'-8!(*)!*=($'-!*6!-)*%39!S'*47$+-!,(!)#$,'!2*')6*7,*-!+.5!
.',-$!6'*+!%*++*(!2'*47$+-T!+.%'*!-#*%38!2**'!',-3!.--$--+$()8!2**'!
+.(.1$+$()!-3,77-8!$)%9!<'$/,)!&(,*(-!)52,%.775!4$,(1!+&%#!-+.77$'!.(/!'$1,*(.775!
4.-$/!+.5!#.0$!.(!,(6*'+.),*(!./0.().1$!,(!)#.)!)#$5!3(*=!)#$,'!%&-)*+$'-!=$778!
-*+$)#,(1!)#$5!#.0$!,(!%*++*(!=,)#!-+.77!4.(3-!.-!=$779!!"#,-!,(6*'+.),*(!
./0.().1$!+.5!#$72!)*!2*)$(),.775!*66-$)!)#$!'$7.),0$!7.%3!*6!-%.7$!$66,%,$(%,$-!.(/!
#,1#$'!%*-)!*6!6&(/-9!"#$!,(-),)&),*(.7!6*'+!*6!%'$/,)!&(,*(-!+.5!*66$'!)#$+!-*+$!
./0.().1$-!,(!)#.)!)#$!7$0$7!*6!)'&-)!.(/!*0$'-,1#)!+.5!4$!#,1#$'!HK7,($/,(-)8!DEEOL!
.77*=,(1!.!-+**)#$'!,()'*/&%),*(!*6!($=!2'*/&%)-!.(/!-$'0,%$-!.(/!-+.77$'!2.5!*6!
)*2!$?$%&),0$-8!-*+$)#,(1!)#.)!#.-!'.,-$/!)#$!,'$!*6!.!(&+4$'!*6!2$*27$8!1,0$(!)#.)!
+.(5!,(-),)&),*(-!=*&7/!#.0$!%7*-$/!=,)#*&)!.!).?2.5$'!4.,7*&)!HM'$,6,$7/8!DEEB!.(/!
)#$!U*//@M'.(3!4,77!,(!DEEBL9!<7*-$'!*0$'-,1#)!45!)#$!,(-&',(1!4*/,$-!6*'!4.(3-!.(/!
%'$/,)!&(,*(-8!,9$98!'$-2$%),0$75!)#$!M$/$'.7!U$2*-,)!F(-&'.(%$!<*'2*'.),*(!HMUF<L!
.(/!)#$!G.),*(.7!<'$/,)!:(,*(!;#.'$!F(-&'.(%$!M&(/!HG<:;FML8!.-!=$77!.-!45!)#$!
*=($'-!*6!)#$!,(-),)&),*(-!+.5!$?27.,(!2.')!*6!)#$!/,66$'$(%$!,(!($)!%#.'1$@*66-9!
V.0,(1!.!7$--!/,0$'-$!*=($'-#,2!4.-$!.(/!2*--,475!-)'*(1$'!-*%,.7!($)=*'3!%.2,).7!
.%%&'.)$75!1.&1$!',-38!.(/!#$(%$!(*)!4$!-&4X$%)!)*!7.'1$!-2,3$-!,(!($)!%#.'1$@*66-!.-!
-$$(!45!-*+$!4.(3-9!"#$-$!,(-),)&),*(.7!/,66$'$(%$-!.'$!'$67$%)$/!,(!2*')6*7,*!
/$%,-,*(-!.(/!%*(-$Y&$()75!,(!($)!%#.'1$@*66-!.-!=$779!!
!
FFF9!U.).!.(/!Z$)#*/*7*15!
The data set covers all credit unions and banks in the United States from 1994 until
December 2009, gathered from the FDIC and the National Credit Union Association
(NCUA). Altogether there are 316,194 observations over the sixteen-year period.
Determining credit union and bank viability in this severe economic downturn could be
done by looking at net charge-offs, asset growth, number of failures, returns on assets,
variants of the value-added approach or assets per employee have all been used in
performance studies of financial institutions.1
Generally the functional forms estimated can be posited as:
Yit = !i + ß X it + " it (1)
The performance indicator, Yit, is net charge-offs as a percent of assets. The intercept, !i,
captures firm specific factors which may be otherwise unseen, while the X matrix
contains policy variables, state dummies, regional and time dummies to capture
exogenous contemporaneous shocks. The use of firm specific intercepts helps to
eliminate the bias that may be due, for example, to larger firms having the ability to use
better technology or stronger market power. The time invariance of a credit union dummy
!!!!!!!!!!!!!!!!!!!!!!!!!!!!!!!!!!!!!!!!!!!!!!!!!!!!!!!!
1
variable that is used would in a fixed effects model mean these estimates would be
unavailable. Using a random effects estimator allows us to keep this time invariant
variable. The X matrix also contains the natural log of the following variables: percent of
assets in first mortgages, the percent of adjustable rate first mortgages, the percent of
commercial and industrial loans, the percent of credit card loans, assets per employee, the
percent of mortgage backed securities, and assets to capture scale effects.2 The robust
Huber-White sandwich estimator allowed estimates of the standard errors in the presence
of potential heterogeneity over such a diverse range of institutions.3 Possible endogeneity
problems may arise from the presence of assets on the right hand side. To correct for
possible non-spherical errors terms the instrumental variable technique developed by
Hausman and Taylor (1981) is used. This technique partitions the right hand side
variables such that equation one can be rewritten as:
Yit = !i + ß X it + # Z it + " it (2)
Here X it assumed to be exogenous and Z it contains elements that may be endogenous. Using a generalized instrumental variable estimator on this equation gives statistics that
are asymptotically valid. This method allows estimation of the primary variable examined
here, the time invariant dummy for whether the institution is a credit union or a bank.4 Also this partitioning allows the use of generalized method of moments to be used to
develop instrumental variable estimates. !
F[9!\$-&7)-!
!!!!!!!!!!!!!!!!!!!!!!!!!!!!!!!!!!!!!!!!!!!!!!!!!!!!!!!!
2
For similar uses of assets as a scale variable see Goddard et al (2002), Huang (2005) and Fried and Lovell (1993).
3
White (1980).
4
!!!!"#$!+*-)!%*++*(!6,(.(%,.7!,()$'+$/,.'5!,(!)#$!:(,)$/!;).)$-!.'$!%'$/,)!&(,*(-8!
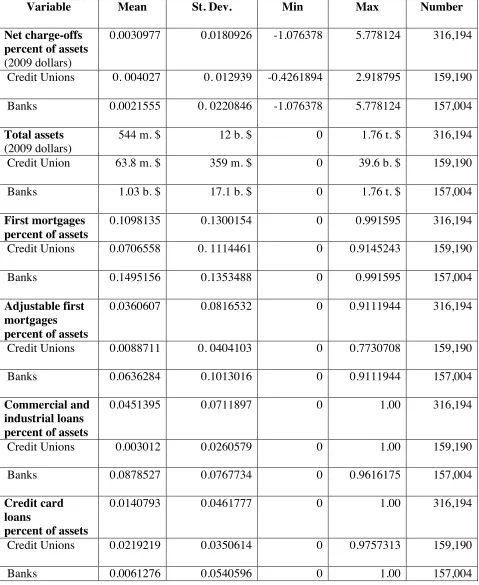
+.3,(1!&2!*0$'!#.76!)#$!*4-$'0.),*(-8!,9$98!A]B8ABE!*6!)#$!^AW8ABC!*4-$'0.),*(-9]!"#$!
-&++.'5!-).),-),%-!,(!".47$!F!-#*=!)#.)!($)!%#.'1$@*66-!.0$'.1$/!.4*&)!^A!4.-,-!
2*,()-!6*'!)#$!$(),'$!-.+27$9!>-!+$(),*($/!$.'7,$'!%'$/,)!&(,*(-!#.0$!.!#,1#$'!
.0$'.1$!*0$'.77!%*+2.'$/!)*!4.(3-9!>--$)-!*0$'.77!.'$!]CC!+,77,*(!DEEB!/*77.'-8!=,)#!
%'$/,)!&(,*(-!#.0,(1!.(!.0$'.1$!*6!W^9Q!+,77,*(8!.4*&)!*($@-,?)$$()#!)#.)!*6!)#$!
4.(3-8!#$(%$!$0$(!)#*&1#)!%'$/,)!&(,*(-!.'$!+*'$!(&+$'*&-!)#$5!.'$!)52,%.775!
+&%#!-+.77$'!)#.(!)#$!4.(3-8!,(!6.%)!)#$'$!.'$!-$0$'.7!4.(3-!)#.)!#.0$!+*'$!.--$)-!
,(/,0,/&.775!)#.(!.77!)#$!%'$/,)!&(,*(-!%*+4,($/9!M,'-)!+*')1.1$-!,(!)#$!-.+27$!
*0$'.77!=$'$!.4*&)!AA!2$'%$()!*6!.--$)-8!=,)#!%'$/,)!&(,*(-!#.0,(1!*(!.0$'.1$!.4*&)!
#.76!*6!)#$!.22'*?,+.)$75!A]!#$7/!45!4.(3-9W!>/X&-).47$!6,'-)!+*')1.1$-!'$2'$-$()!
.4*&)!^9W!2$'%$()!*6!.--$)-!.(/!,)!,-!(*),%$.47$!)#.)!)#$!2$'%$()!*6!4.(3!./X&-).47$!
'.)$!+*')1.1$-!,-!*0$'!O!),+$-!)#.)!6*'!%'$/,)!&(,*(-9!>/X&-).47$!'.)$!+*')1.1$-!.'$!
(*)*',*&-!6*'!7&',(1!2$*27$!,()*!(*)$-!)#.)!+.5!4$%*+$!,+2*--,47$!)*!2.5!*(%$!'.)$-!
=$()!&28!.-!#.22$($/!)*!.!(&+4$'!*6!,(/,0,/&.7-!,(!)#$!-&4@2',+$!+.'3$)!HZ.1/*66!
.(/!_.)$-8!DEEBL9!<*++$'%,.7!.(/!,(/&-)',.7!7*.(-!'$2'$-$()!.4*&)!C9]!2$'%$()!*6!
*0$'.77!.--$)-8!=,)#!)#$!'.),*!6*'!)#$!4.(3-!4$,(1!*0$'!DB!),+$-!1'$.)$'9!<'$/,)!%.'/!
7*.(-!+./$!&2!.4*&)!AC!2$'%$()!*0$'!.778!=,)#!%'$/,)!&(,*(-!*66$',(1!.4*&)!)#'$$!
),+$-!.-!+.(5!7*.(-!)#,-!=.5!)#.(!4.(3-9!>--$)-!2$'!$+27*5$$8!.!=,/$75!&-$/!+$)',%!
6*'!$66,%,$(%58!.(/!#*2$6&775!)'.(-7.),(1!,(!)*!7*=$'!($)!%#.'1$@*66-!=.-!+$.-&'$/!.)!
^9C!+,77,*(!/*77.'-!2$'!$+27*5$$!=,)#!4.(3-!.0$'.1,(1!.4*&)!]E!2$'%$()!+*'$!)#.(!
!!!!!!!!!!!!!!!!!!!!!!!!!!!!!!!!!!!!!!!!!!!!!!!!!!!!!!!!
5 Note that the figure for banks includes commercial banks and thrift institutions. 6
)#$!%'$/,)!&(,*(-9O!`.-)75!,(!".47$!*($!.'$!+*')1.1$@4.%3$/!-$%&',),$-9!"#$-$!
-$%&',),$-!*6)$(!4'*&1#)!#.0*%!)*!4.7.(%$!-#$$)-!.-!)#$!#*&-,(1!4&447$!/$67.)$/9!
a0$'.77!)#$!-.+27$!#$'$!#.-!.4*&)!^9]!2$'%$()!*6!-$%&',),$-!'$7.),0$!)*!)*).7!.--$)-9!F)!
,-!(*)$=*')#5!)#.)!)#$!%'$/,)!&(,*(-!#./!7$--!)#.(!.!-,?@#&(/'$/)#!)#$!.+*&()!)#.)!
4.(3-!#$7/9!$
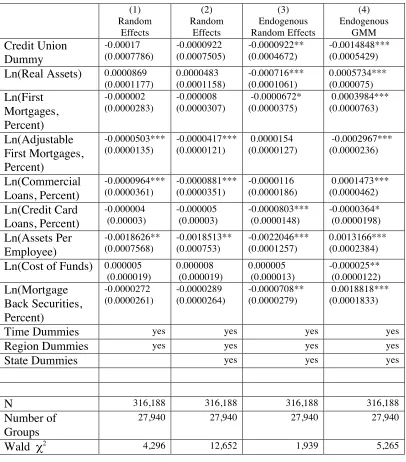
!!!!!".47$!6*&'!%*().,(-!)#$!'$-&7)-!6'*+!'.(/*+!$66$%)-!.(/!)#$!V.&-+.(@".57*'!
+*/$7!6*'!$-),+.),(1!,(!)#$!2'$-$(%$!*6!$(/*1$(,$)59!>!(&+4$'!*6!%*()'*7-!.'$!
,()'*/&%$/!,(!)#,-!&(4.7.(%$/!/.).!-$)!*(!DO8BCE!-&%#!.-!),+$8!'$1,*(-!.(/!-).)$!
/&++,$-!)*!)'5!.(/!%.2)&'$!+.%'*!%#.(1$-!H)#$!),+$!/&++,$-!6*'!$?.+27$!
%*''$7.)$!-)'*(175!=,)#!)#$!&($+27*5+$()!'.)$L8!+.(.1$',.7!/,66$'$(%$-8!
)$%#(*7*1,%.7!0.',.),*(8!$)%9!The coefficients on credit unions are negative but only
significant in the specification that explicitly deals with possible endogeneity of a number
of variables. The Durbin-Wu-Hausman chi-square test for possible endogeneity is
positive; hence the random effects model in columns 3 and 4 of Table 2 where the loan
portfolio is treated as an is preferred over the others shown.8 Instrument validity tests for
the gmm equations failed so the results there are not optimal.
All specifications in Table 2 list the credit unions with a negative coefficient, although
only the two in the preferred models in columns 3 and 4 are significant. Some behavior of
credit unions then, whether it be more prudential lending, better information about loan
prospects, or some other factor seem to be keeping the net charge-offs for credit unions
lower. A number of the variables here in columns 3 and 4 are measured as significant, but
!!!!!!!!!!!!!!!!!!!!!!!!!!!!!!!!!!!!!!!!!!!!!!!!!!!!!!!!
7 Some large observations for assets per employee come from branches of foreign banks and those over 500 m. dollars per employee, 173 in all, were dropped as outliers.
change signs between the two specifications. Even though the number of observations is
large the percentage explained of net charge-offs as a percent of assets is relatively small.
This relatively small amount explained by the loan portfolios implies in part that as the
crisis unfolded the decisions of these institutions could be swamped macroeconomic
events. Further work is needed to flesh out better instruments and possibly more factors
influencing net charge-offs.
!
[9!S*7,%5!F+27,%.),*(-!
!!!!!"#$!%&''$()!+$7)/*=(!#.-!7$6)!+.(5!,(/,0,/&.7-!.(/!,(-),)&),*(-!-)'&117,(18!
6,(.(%,.7!,(-),)&),*(!,(%7&/$/9!G$)!%#.'1$@*66-!#.0$!1*($!&2!/'.+.),%.775!'$%$()758!
$-2$%,.775!6*'!4.(3-9!"#$!-+.77$'!%'$/,)!&(,*(-8!.7)#*&1#!#,-)*',%.775!#.0,(1!.!
1'$.)$'!'.)$!*6!($)!%#.'1$@*66-!#.0$!+.(.1$/!)*!=$.)#$'!)#$!%&''$()!%',-,-!4$))$'9!
>/X&-).47$!'.)$!+*')1.1$-8!%*++$'%,.7!7*.(-!.(/!+*')1.1$@4.%3$/!-$%&',),$-!=$'$!
+.(5!),+$-!7.'1$'!6*'!4.(3-!)#.(!6*'!%'$/,)!&(,*(-9!F(!.77!$-),+.)$-!#$'$!%'$/,)!
&(,*(-8!*(%$!%*()'*77,(1!6*'!-,I$!.(/!*)#$'!2*')6*7,*!/,66$'$(%$-8!%*(-,-)$()75!.'$!
-#*=(!)*!#.0$!7*=$'!($)@%#.'1$!*66-9!"#$!$?.%)!.0$(&$-!*6!)#,-!./0.().1$!.'$!(*)!
2,(!2*,()$/!,(!)#,-!2.2$'8!4&)!)#$!2*')6*7,*!/,66$'$(%$-!6*&(/!#$'$!*66$'!-*+$!
/,'$%),*(9!<'$/,)!&(,*(-!.-!6,(.(%,.7!%**2$'.),0$-!#.0$!2*--,475!.(!,(6*'+.),*(!
./0.().1$!'$7.),0$!)*!*)#$'!,(-),)&),*(-8!4*)#!,()$'(.775!=,)#!4$))$'!+*(,)*',(1!*6!
7*.(-8!$?$%&),0$!%*+2$(-.),*(!.(/!*)#$'!+.(.1$',.7!)$%#(,Y&$-!.(/!$?)$'(.775!
)#'*&1#!7*.(!-$7$%),*(8!%*++&(,)5!,(0*70$+$()!.(/!($)=*'3,(1!.''.(1$+$()-!=,)#!
*)#$'!%'$/,)!&(,*(-9!!
Table 1
Summary Statistics
Variable Mean St. Dev. Min Max Number
Net charge-offs percent of assets (2009 dollars)
0.0030977 0.0180926 -1.076378 5.778124 316,194
Credit Unions 0. 004027 0. 012939 -0.4261894 2.918795 159,190
Banks 0.0021555 0. 0220846! -1.076378 5.778124 157,004
Total assets (2009 dollars)
544 m. $ 12 b. $ 0 1.76 t. $ 316,194
Credit Union 63.8 m. $ 359 m. $ 0 39.6 b. $ 159,190
Banks 1.03 b. $ 17.1 b. $ 0 1.76 t. $ 157,004
First mortgages percent of assets
0.1098135 0.1300154 0 0.991595 316,194
Credit Unions 0.0706558 0. 1114461 0 0.9145243 159,190
Banks 0.1495156 0.1353488! 0 0.991595 157,004
Adjustable first mortgages percent of assets
0.0360607 0.0816532 0 0.9111944 316,194
Credit Unions
0.0088711 0. 0404103 0 0.7730708 159,190
Banks 0.0636284 0.1013016! 0 0.9111944 157,004
Commercial and industrial loans percent of assets
0.0451395 0.0711897 0 1.00 316,194
Credit Unions
0.003012 0.0260579 0 1.00 159,190
Banks 0.0878527 0.0767734! 0 0.9616175 157,004
Credit card loans
percent of assets
0.0140793 0.0461777 0 1.00 316,194
Credit Unions
0.0219219 0.0350614 0 0.9757313 159,190
Assets per employee (2009 dollars)
3.4 m. $ 7.8 m. $ 0 494 m. $ 316,021
Credit Unions
2.5 m. $ 3.8 m. $ 0 387 m. $ 159,186
Banks 4.3 m. $ 10.3 m. $ 18,401 $ 494 m. $ 156,835
Mortgage-backed securities percent of assets
0.0347288 0.0779858 0 0.9672325 316,194
Credit Unions
0.0001138 0.0033439 0 0.2936342 159,190
Table 2
Net Charge-Offs, U.S. Data 1994-2009
(Dependent variable is net charge-offs as a percent of assets. Standard errors are parenthesis9)
(1) Random Effects (2) Random Effects (3) Endogenous Random Effects (4) Endogenous GMM Credit Union Dummy! -0.00017 (0.0007786) -0.0000922 (0.0007505) -0.0000922** (0.0004672) -0.0014848*** (0.0005429)
Ln(Real Assets)! 0.0000869
(0.0001177) 0.0000483 (0.0001158) -0.000716*** (0.0001061) 0.0005734*** (0.000075) Ln(First Mortgages, Percent) -0.000002 (0.0000283) -0.000008 (0.0000307) -0.0000672* (0.0000375) 0.0003984*** (0.0000763) Ln(Adjustable First Mortgages, Percent) -0.0000503*** (0.0000135) -0.0000417*** (0.0000121) 0.0000154 (0.0000127) -0.0002967*** (0.0000236) Ln(Commercial Loans, Percent) -0.0000964*** (0.0000361) -0.0000881*** (0.0000351) -0.0000116 (0.0000186) 0.0001473*** (0.0000462) Ln(Credit Card Loans, Percent) -0.000004 (0.00003) -0.000005 (0.00003) -0.0000803*** (0.0000148) -0.0000364* (0.0000198) Ln(Assets Per Employee) -0.0018626** (0.0007568) -0.0018513** (0.000753) -0.0022046*** (0.0001257) 0.0013166*** (0.0002384)
Ln(Cost of Funds) 0.000005 (0.000019) 0.000008 (0.000019) 0.000005 (0.000013) -0.000025** (0.0000122) Ln(Mortgage Back Securities, Percent) -0.0000272 (0.0000261) -0.0000289 (0.0000264) -0.0000708** (0.0000279) 0.0018818*** (0.0001833)
Time Dummies yes yes yes yes
Region Dummies! yes yes yes yes
State Dummies! yes yes yes
!
N! 316,188 316,188 316,188 316,188
Number of Groups!
27,940 27,940 27,940 27,940
Wald $2 4,296 12,652 1,939 5,265
!!!!!!!!!!!!!!!!!!!!!!!!!!!!!!!!!!!!!!!!!!!!!!!!!!!!!!!!
9
References
[1] Baltagi, B. H., 2005. Econometric Analysis of Panel Data, Wiley, New York
[2] Baltagi, B. H. and S. Khanti-Akom, 1990. “On the Efficient Estimation with
Panel Data: An Empirical Comparison of Instrumental Variable Estimators, Journal
of Applied Econometrics, 5, 401-406.
[3] Credit
Union National Association (CUNA), 2010, “Basic Information About Credit
Unions” http://www.cuna.org/press/basicinfo.html.
[4]
Dodd-Frank, 2009. “Dodd-Frank Wall Street Reform and Consumer Protec
tion Act” http://thomas.loc.gov/cgi-bin/bdquery/z?d111:H.R.4173.
[5] Federal
Deposit Insurance Corporation, 2010, http://www2.fdic.gov/.
[6] FDIC,
“Changes in Number of Institutions,” http://www2.fdic.gov/hsob/hsobRpt.asp,
Accessed May 28, 2010.
[7] Fried,
Harold O. and C. A. Knox Lovell, 1993. “Evaluating the Performance of Credit Unions,” University of Wisconsin and Filene Research Institute.
[8] Freifield,
Karen, July 30th, 2009. “Banks Paid $32.6 Billion in Bonuses Amid U.S. Bailout,”
Bloomberg News.
[9] Goddard
J., McKillop D. and Wilson J. "Credit union size and growth: tests of the law of proportionate effect", Journal of Banking and Finance, 2002.
[10] Greer,
Douglas F. and Stephen A. Rhoades, 1977. “Test of the Reserve Labour Hypothesis”
The Economic Journal, Vol. 87, No. 346 (Jun., 1977), pp. 290-299
[11] Halary,
Isabelle, 2006. “Cooperatives in Globalization: The Advantages of Networking,” in
Klinedinst, M. A. & Kalmi, P. (Editors) (2006). Participation in the Age of
[12] Hausman, J.A., and W. E. Taylor, 1981. “Panel Data and Unobservable Individual Effects,” Econometria, 49, 1377-1398.
[13] Ichniowski, C., Shaw, K., and Prennushi, G. (1997), “The Effects of
Human Resource Management on Productivity,” American Economic Review, 87 (June), 291-313.
[14] Johnson, Simon and James Kwak, 2010. “13 Bankers,” Random House,
New York.
[15] Klinedinst
, Mark and Charles Rock, 1993. “United States Credit Unions as Supporting
Structures,” in Mahlingham and Smith, eds., Labour-Managed Market Economies,
pp. 258-269. Mittal Publications, New Delhi, India.
[16] Klinedinst
, Mark, 2007. “Cooperative Comebacks: Resilience in the Face of the Hurricane Katrina Catastrophe,” Filene Research Monographs.
[17] Kohers, T.
and D. Mullis, 1988. “An Update on Economies of Scale in Credit Unions,” Applied
Economics.
[18] Lieberman
, Marvin B. and Shigeru Asaba, 1997. “Inventory Reduction and Productivity
Growth: A Comparison of Japanese and US Automotive Sectors,”Managerial and
Decision Economics, Vol. 18, pp. 73-85.
[19] Magdoff,
Fred and Michael D. Yates, 2009. “The ABC’s of the Economic Crisis,” Monthly Review Press.
[20] Park, Kang H. and William L. Weber, 2006. “Profitability of Korean
banks: Test of market structure versus efficient structure,” Journal of Economics and
Business, Vol. 58, pp. 222-239.
[21] Schenk, Mike, 2006. “Commercial Banks and Credit Unions,” Credit
Union National Association, http://advice.cuna.org/download/combanks_cus.pdf.
[22] Sollenberger, Harold M., 2008, Financially “High-Performing” Credit
[23] Stiglitz, Joseph, 2010. “Freefall,” W. W. Norton and Company, New York.
[24] White, H. 1980. “A Heteroskedasticity-Consistent Covariance Matrix
Estimator and a Direct Test for Heteroskedasticity,” Econometrica 48, 817-838.
[25] Whyte, William F. and Kathleen K. Whyte, 1991. Making Mondragon:
The Growth and Dynamics of the Worker Cooperative Complex, Cornell University Press, New York.
[26] World Bank, 2010. “Social Capital,”
http://web.worldbank.org/WBSITE/EXTERNAL/TOPICS/EXTSOCIALDEVELOP MENT/EXTTSOCIALCAPITAL/0,,menuPK:401021~pagePK:149018~piPK:149093 ~theSitePK:401015,00.html.
[27] Zandi, Mark. Financial Shock, 2008. Financial Times Press, New Jersey.