© 2017, IRJET | Impact Factor value: 5.181 | ISO 9001:2008 Certified Journal
| Page 229
Multi-Objective Optimization of EDM process parameters using
Taguchi-Grey Relational Analysis for Aluminium work material with
Copper Electrode
Rashed Mustafa Mazarbhuiya
1, P.K. Choudhury
21
PG Student, Department of Mechanical Engineering, Assam Engineering College-Jalukbari, Assam, India
2Assistant Professor Department of Mechanical Engineering, Assam Engineering College-Jalukbari, Assam, India
---***---Abstract -
This paper involves the multi objectiveoptimization of EDM process parameters on Aluminium work piece with Copper electrode for obtaining maximum material removal rate (MRR), minimum tool wear rate (TWR) and minimum surface roughness (SR) using Taguchi-Grey Relational Analysis. The machining parameters are selected as Discharge Current, Pulse on Time, Flushing Pressure and Polarity. Experiments were conducted by selecting two operating levels for the said four parameters according to Taguchi’s Design of Experiments. Using Grey Relational Analysis (GRA) the multi objective optimization was performed to determine the optimal solution. Analysis of Variance (ANOVA) for Grey relational Grade was carried out to determine the most contributing and significant input parameter/parameters. The optimal level of input parameters are found to be as A2B2C1D1 i.e. 16A for discharge current, 1010 μs for pulse on time, 5kgf/cm2 for flushing pressure and
normal polarity. The ranking of the process parameters reveals that current is the most dominant parameter on the output response followed by pulse on time. From the ANOVA for grey relational grade it was also experienced that the current is the only significant factor while machining on Aluminium work piece with Copper electrode.
Key Words: Electro discharge machining, orthogonal array, Material Removal Rate, Tool Wear Rate, Surface Roughness, GRA, and ANOVA.
1. INTRODUCTION
Electrical Discharge Machining (EDM) is an unconventional machining process which is used for removing material using a series of repeated electrical discharges between a tool called electrode and work piece and the part being machined in the presence of a dielectric fluid [1]. Using thermal energy a high-precision metal removal is possible from an accurately controlled electrical discharge machine. The electrode is moved towards the work piece and a small gap is maintain to ionize the dielectric [2]. EDM process uses for machining hard metals and alloys which would have been difficult to machine by conventional methods, but EDM has made it relatively simple to machine intricate shapes [3]. The process is used for producing dies, moulds, and finishing parts for aerospace, automotive, and surgical components [4].This machining process is continually finding further applications in metal machining industry. The material is removed from electrode and work piece by erosive effect of the electrical discharges. There is no any direct contact
between the tool electrode and the work piece material because of that it eliminate mechanical stresses, chatter and vibration problems during machining [1, 5].
2. EXPERIMENTAL DETAILS
2.1 Experimental setup
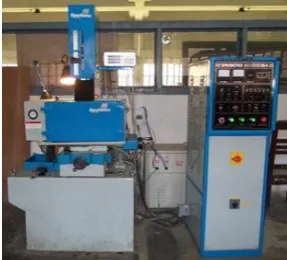
In this study a series of experiments were conducted using EDM by taking aluminium as work piece and copper as tool electrode and experiments were run to examine the effects of input machining parameters such as Discharge Current, Pulse ON time, Flushing Pressure and Polarity on the material removal rate, tool wear rate and surface roughness. .The experiment has been conducted on EDM model F25 series of Sparkonix India Private Limited, Pune as shown in fig 1. It has the optimum working current of 25A with maximum work-piece weight of 650kg and maximum electrode weight of 35kg. The X-axis and Y-axis movements are given to the work table and Z-axis movement is on the tool holder. A servo mechanism controls the downwards movement of the tool holder during machining. The dielectric tank has a capacity of 400 litres. The flushing pressure can be read on separate gauge fitted on the left side of the working tank. For each of the experiment separate electrode were selected. In this experimentation kerosene was used as dielectric fluid. For each of the experimentation a machining time of 10 minutes was set. Material is removed during machining from both the work piece and the tool and MRR and TWR is determined from their respective weight differences before and after machining divided by machining time. The surface roughness is measured by means of a portable type apparatus (Handy surf surface texture measuring instrument).
[image:1.595.361.505.629.759.2]© 2017, IRJET | Impact Factor value: 5.181 | ISO 9001:2008 Certified Journal
| Page 230
2.2 Tool material and work piece material
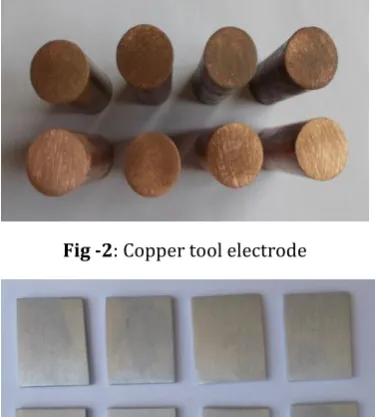
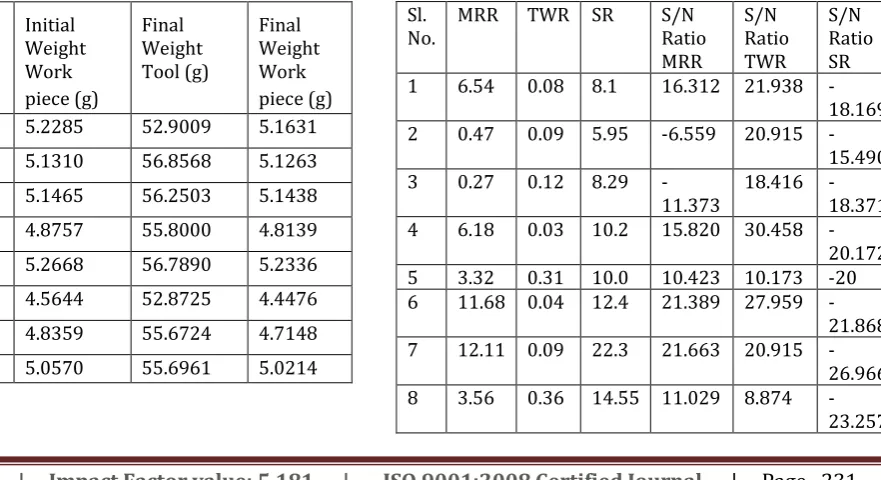
In this experiments copper electrodes were used which were shown in fig.2. The work-piece material is aluminium as shown in fig.3.The electrode material properties are given in table 1.
Fig -2: Copper tool electrode
Fig -3 Name of the figure
Table -1: Properties of electrode material
Working conditions Value
Melting point 1083˚C
Elastic modulus (E) 1.23x 10⁵N/mm2
Poisson’s ratio 0.26
Density 8.9 gm/cm3
2.3 Selection of response and control parameters
In this work we are selecting four control parameters and three different response parameters at two different levels for multiple performance optimization as shown in table 2. Response parameters considered in this study are as follows-
Material removal rate (mm3/min) Tool wear rate(mm3/min)
Surface Roughness ( Ra value in µm)
Table -2: Control parameters with their respective levels
Control parameters Level 1 Level 2
A Discharge Current (A) 8 16
B Pulse on time(μs) 463 1010
C Flushing pressure (kgf/cm2 )
5 10
D Polarity N(Normal) R
(Reverse)
2.4. Design of experiments
In this work based on the calculation done for total degrees of freedom (DOF) in case of four factors for three process parameters at two levels each with no interaction, the best suited orthogonal array L8 design matrix is used to evaluate the process performance and the layout is shown in table 3. The weight of the tool piece and work pieces were measured before and after machining by using Ishida DX precision electrical balance and were tabulated in table 4. After that material removal rate (MRR), tool wear rate (TWR) and surface roughness (Ra) were calculated and were tabulated in table 5. The MRR is expressed as the ratio of the difference of weight of the work piece before and after machining to the machining time and is calculated using given formula [6]. It is expressed in mg/min and denoted by MRR.
MRR=
TWR is expressed as the ratio of the difference of weight of the tool before and after machining to the machining time and is calculated using given formula [6]. It is expressed in mg/min and denoted by TWR.
TWR=
Surface Roughness is the size of the surface texture. It is expressed in µm and denoted by Ra. If the value comes higher that means the surface is rough and if lower comes that means that the surface is smooth.
[image:2.595.74.262.180.389.2]© 2017, IRJET | Impact Factor value: 5.181 | ISO 9001:2008 Certified Journal
| Page 231
1 2 3 45 6 7 8 Fig -4 Copper tool pieces after machining
[image:3.595.84.239.84.197.2]Fig -5 Work pieces after machining
Table -3: Experimental layout using an L8 orthogonal array
Sl. No. Current On time Flushing
pressure Polarity
1 1 1 1 1
2 1 1 2 2
3 1 2 1 2
4 1 2 2 1
5 2 1 1 2
6 2 1 2 1
7 2 2 1 1
8 2 2 2 2
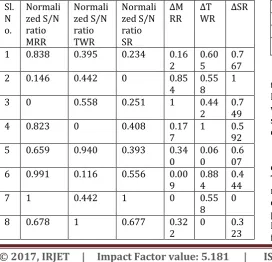
Table -4: Initial and final weight of tool and work pieces
Sl.
No. Initial Weight Tool (g)
Initial Weight Work piece (g)
Final Weight Tool (g)
Final Weight Work piece (g)
1 52.9017 5.2285 52.9009 5.1631
2 56.8577 5.1310 56.8568 5.1263
3 56.2515 5.1465 56.2503 5.1438
4 55.8003 4.8757 55.8000 4.8139
5 56.7921 5.2668 56.7890 5.2336
6 52.8729 4.5644 52.8725 4.4476
7 55.6733 4.8359 55.6724 4.7148
[image:3.595.300.561.109.276.2]8 55.6997 5.0570 55.6961 5.0214
Table -5: Calculation of MRR, TWR and SR
Sl.
No. A B C D MRR TWR SR
1 8 463 5 N 6.54 0.08 8.1
2 8 463 10 R 0.47 0.09 5.95
3 8 1010 5 R 0.27 0.12 8.29
4 8 1010 10 N 6.18 0.03 10.2
5 16 463 5 R 3.32 0.31 10.0
6 16 463 10 N 11.68 0.04 12.4
7 16 1010 5 N 12.11 0.09 22.3
8 16 1010 10 R 3.56 0.36 14.55
3. GREY RELATIONAL ANALYSIS
Based on the output responses and using Grey relational analysis the multi-objective optimization is performed for obtaining the optimal set of process parameters. The transformation of S/N Ratio values from the original response values was the initial step. For that the equations of “larger the better” is used for MRR and “smaller the better” is used for TWR and surface roughness values [7, 8]. Subsequent analysis was carried out on the basis of these S/N ratio values.
Type1: S/N=-10log Larger the better… (1)
Type2: S/N=-10 smaller the better… (2)
[image:3.595.38.287.232.345.2]Where Yij is the value of the jth response in the ith experiment condition, with i=1, 2, 3…n; j = 1, 2…k
Table -6: Calculation of S/N Ratio for MRR, TWR and SR
Sl.
No. MRR TWR SR S/N Ratio MRR
S/N Ratio TWR
S/N Ratio SR 1 6.54 0.08 8.1 16.312 21.938
-18.169 2 0.47 0.09 5.95 -6.559 20.915
-15.490 3 0.27 0.12 8.29
-11.373 18.416 -18.371 4 6.18 0.03 10.2 15.820 30.458
-20.172 5 3.32 0.31 10.0 10.423 10.173 -20 6 11.68 0.04 12.4 21.389 27.959
-21.868 7 12.11 0.09 22.3 21.663 20.915
-26.966 8 3.56 0.36 14.55 11.029 8.874
[image:3.595.31.289.380.509.2] [image:3.595.29.291.544.739.2] [image:3.595.110.551.546.786.2]© 2017, IRJET | Impact Factor value: 5.181 | ISO 9001:2008 Certified Journal
| Page 232
Using eq. (1) and eq. (2) we evaluate S/N ratio values givenin table 6.
The normalized output parameter corresponding to the larger-the-better criterion can be expressed as
(3)
[image:4.595.307.561.456.588.2]Then for the smaller-the-better criterion can be expressed as (4)
Table -7: Normalized S/N ratio for MRR, TWR and SR
Sl.
No. Normalized S/N ratio MRR
Normalized S/N ratio TWR
Normalized S/N ratio SR
1 0.838 0.395 0.234
2 0.146 0.442 0
3 0 0.558 0.251
4 0.823 0 0.408
5 0.659 0.940 0.393
6 0.991 0.116 0.556
7 1 0.442 1
8 0.678 1 0.677
Using eq. (3) and eq. (4) we normalize the S/N ratio values given in table 7. After that computing grey relational coefficient (GC) for the normalize S/N ratio values. Before that the deviation sequence for the reference and comparability sequence were found out. Grey relational coefficients along with deviation sequence were given in table 8.
Table -8: Calculation of deviation for MRR, TWR and SR
Sl. N o.
Normali zed S/N ratio MRR
Normali zed S/N ratio TWR
Normali zed S/N ratio SR
∆M
RR ∆TWR ∆SR
1 0.838 0.395 0.234 0.16
2 0.605 0.767
2 0.146 0.442 0 0.85
4 0.558 1
3 0 0.558 0.251 1 0.44
2 0.749
4 0.823 0 0.408 0.17
7 1 0.592
5 0.659 0.940 0.393 0.34
0 0.060 0.607
6 0.991 0.116 0.556 0.00
9 0.884 0.444
7 1 0.442 1 0 0.55
8 0
8 0.678 1 0.677 0.32
2 0 0.323
The grey relational coefficient can be expressed as
Where i=1,2….n experiments and j=1,2….m response GCij= grey relational coefficient for the ith experiment/trial and jth dependent variable/response
∆= absolute difference between Yoj andYij which is a deviation from target value and can be treated as a quality loss
Yoj= optimum performance value or the ideal normalized value of jth response
Yij=the ith normalized value of the jth response/dependent variable.
= minimum value of ∆ = maximum value of ∆
⋋ is the distinguishing coefficient which is defined in the range 0≤⋋≤1 (the value may be adjusted on the practical needs of the system)
[image:4.595.37.310.530.792.2]After that by averaging the grey relational coefficient corresponding to each performance characteristic grey relational grade was determined which is shown in the table 9. Depending on the calculated grey relational grade the overall performance characteristic of the multiple response process were carried out The grey relational grade can be expressed as = Where m is the number of responses.
Table -9: Calculation of Grey Relational Grade
Sl. No. CG
MRR CGTWR CGSR Gi RANK
1 0.861 0.623 0.566 0.683 5
2 0.539 0.642 0.5 0.560 8
3 0.5 0.693 0.572 0.588 7
4 0.849 0.5 0.628 0.659 6
5 0.746 0.943 0.622 0.771 3
6 0.991 0.530 0.692 0.737 4
7 1 0.642 1 0.881 1
8 0.757 1 0.756 0.837 2
Similar to GRC, GRG also gives the degree of closeness of the results to the ideal result that obtained experimentally. Better multiple performance characteristics is obtained when grey relational grade is larger From Table 9, it can be seen that Experiment no. 7 has the best multi-performance characteristic as it has the high GRG value.
pulse-© 2017, IRJET | Impact Factor value: 5.181 | ISO 9001:2008 Certified Journal
| Page 233
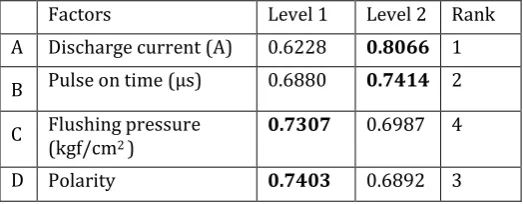
on time, 5kgf/cm2 for flushing pressure and normal polarity. [image:5.595.36.298.183.285.2]The ranking of the process parameter reveals that discharge current is the most dominant parameter on the output response followed by pulse on time. The optimal parameter combination was determined as A2B2C1D1.
Table -10: Effects of the Factors in Grey Relational Grade
Factors Level 1 Level 2 Rank
A Discharge current (A) 0.6228 0.8066 1
B Pulse on time (μs) 0.6880 0.7414 2
C Flushing pressure (kgf/cm2 )
0.7307 0.6987 4
D Polarity 0.7403 0.6892 3
ANOVA for grey relational grade
To obtain the percentage contribution of the factors and their significances Analysis of variance (ANOVA) is performed. For that F-ratio value at 95 % confidence level is used which will decides the significant factors affecting the process. A Larger value of F- ratio indicates a big change on the performance in the variation of process parameters [9, 10]. Usually, when F is large the change of the machining parameter has a significant effect on the performance characteristic shown in table11. From this table 11 of ANOVA for GRG, the percentage contribution of factors over the optimum solution of GRG it was observed that the discharge current (77.88%) is the most dominant parameter followed by Pulse on time (6.58%), polarity (5.98%) and flushing pressure (2.43%).
Table -11: ANOVA for GRG
Sour
ce Sum of square DOF Mean square F-Ratio C (%) Rank A 0.0677 1 0.0677 *32.77
1 77.88 1
B 0.0057 1 0.0057
2.771 6.58 2 C 0.0021 1 0.0021
1.022 2.43 4 D 0.0052 1 0.0052
2.518 5.98 3 Erro
r 0.0062 3 0.0021 7.13
Tota
l 0.0869 7
4. RESULTS AND DISCUSSIONS
Polarity and Discharge Current:MRR increases with the increase in current with both positive and negative polarity but it drastically increases with the increase in current with positive polarity as compared to negative polarity. With an increase in current, the available spark energy during discharge increases leading to higher MRR. Positive polarity was found to be optimum for analysis of TWR, because the positive polarity factor decreases TWR rather than negative polarity. This is because relative heat dissipation on the work piece is high at the end of discharge medium [11]. During spark occurs few electrons impinge the tool rather than on the work piece because electrons are normally react with positive polarity which is the work piece. It was experimented that TWR decreases with the decrease in current for both positive and negative polarity but it is decreases more with the decreases in current with positive polarity as compared to negative polarity. With a decrease in current, the available spark energy during discharge decreases leading to lower TWR. Similarly surface roughness also increases with the increase in current with both positive and negative polarity although the SR obtained with negative polarity is relatively lower as compared to SR obtained with positive polarity. Lower current value gives lower SR. Increase in SR with increase in current may be attributed to the increase in energy content of the spark. Generally polarity is to be determined by specific experiments and is a matter of tool material, work material, current density and pulse length combinations [11, 12].
Flushing Pressure:Flushing in the dielectric through the gap of electrode and work piece is necessary to remove the unwanted micro debris produced during the machining, which tends to short circuit the electrodes leading to damage of both tool and work piece. High flushing pressure in the dielectric fluid enhances the MRR, since the tendency of getting short circuit due to the micro debris formed in the machining reduces, thus saving both tool and work piece. Flushing pressure in the dielectric fluid reduce the TWR, since the tendency of getting short circuit due to the micro debris formed in the machining reduces, thus saving both tool and work piece.. As the flushing pressure increases the value of surface roughness considerably reduces since it tries to reduce the irregularities, but very high flushing pressure may again distort the already made surface finish. So, in order to get better surface finish the obtained low level of flushing pressure is justified in compromising with material removal rate [6].
© 2017, IRJET | Impact Factor value: 5.181 | ISO 9001:2008 Certified Journal
| Page 234
energy is directly proportional to pulse on time. The sparkenergy increases with increase in pulse on time and higher pulse on time leads to spreading of the spark, due to which heat transfer to the tool reduces and this results in less tool wear rate [13]. The experimental results reveal that for a constant pulse on time, the surface roughness increases with increasing pulse current and it also increases with increasing pulse on time for a constant current [11, 12].
The objective of this multi objective optimization is to obtain a high MRR with low TWR and low Surface Roughness. From the calculation of GRG, it can be concluded that the experiment no. 7 with highest GRG value leads to the best optimal setting. These findings can be verified in the table 5. Also from the study of effects of the factors in Grey Relational Grade, the same optimal setting were obtained as A2B2C1D1 i.e., 16A for discharge current, 1010μs for pulse on
time, 5kgf/cm2 for flushing pressure and normal polarity. The same conclusion was also drawn from the ANOVA for GRG. The experimental results show that at high level of discharge current with positive polarity, the available spark energy during discharge increases leading to higher MRR. At high level of Pulse on time, the MRR being directly proportional exhibited an increasing trend. High flushing pressure in the dielectric fluid enhances the MRR, since the tendency of getting short circuit due to the micro debris formed in the machining reduces, thus saving both tool and work piece.
In case of TWR, the positive polarity leads to decrease compared to negative polarity, because relative heat dissipation on the work piece is high in the end part of machining process. During spark, few electrons impinge the tool rather than on the work piece, because majority of them are normally attracted towards positive work piece. Tool wear rate decreases in increase in pulse on time, because it may be attributed to spark energy and this spark energy is directly proportional to pulse on time. The spark energy increases with increase in pulse on time and higher pulse on time leads to spreading of the spark, due to which heat transfer to the tool decreases. This results in less TWR. Flushing pressure in the dielectric fluid decreases the TWR, since the tendency of getting short circuit due to the micro debris formed in the machining reduces.
The experimental results reveal that for a constant pulse on time, the surface roughness increases with increasing pulse current and it also increases with increasing pulse on time for a constant current. As the flushing pressure increases the value of surface roughness considerably reduces since it tries to reduce the irregularities, but very high flushing pressure may again distort the already made surface finish. So, in order to get better surface finish the obtained low level of flushing pressure is justified in compromising with MRR.
So, the optimal setting of process parameters i.e. A2B2C1D1 corresponding to high level of discharge current,
high level of pulse on time, low level of flushing pressure with normal polarity has been experienced to be justified with multi objective optimization for responses i.e. MRR, TWR and SR.
5. CONCLUSIONS
In this investigational experiment on EDM to know the effect of machining parameters i.e., discharge current, pulse-on time, flushing pressure and polarity over responses i.e., material removal rate (MRR), tool wear rate (TWR) and surface roughness (Ra) in the Aluminium work piece using the Copper electrode, it was experienced that the factors affected the responses differently although these responses are important from the industrial point of view. From the above calculation and analysis the following points can be concluded-
The optimum parameter setting is found to be as A2B2C1D1 i.e., 16A for discharge current, 1010 μs for pulse-on time, 5kgf/cm2 for flushing pressure and normal polarity. The experiment no. 7 in table no 5 also reveals this fact.
MRR increases drastically with increase in current with positive polarity as compared to negative polarity.
Normal polarity was found to be optimum for analysis of TWR, because the normal polarity leads to decrease in TWR.
TWR decreases more with the decreases in current with positive polarity as compared to negative polarity.
Surface roughness also increases with the increase in current with both positive and negative polarity although the SR obtained with negative polarity is relatively lower as compared to SR obtained with positive polarity.
The higher pulse on time and pulse current leads to higher MRR, however too much extended pulse on time may again leads to low MRR.
TWR decreases in increase in pulse on time, because it may be attributed to spark energy and this spark energy is directly proportional to pulse on time.
The experimental results reveal that for a constant pulse on time, the surface roughness increases with increasing pulse current and it also increases with increasing pulse on-time for a constant current The study reveals that discharge current is the most
dominant parameter on the output response followed by pulse on time.
© 2017, IRJET | Impact Factor value: 5.181 | ISO 9001:2008 Certified Journal
| Page 235
ACKNOWLEDGEMENT
The authors express their sincere thanks and gratitude to Department of Mechanical Engineering of Assam Engineering College and NIT Silchar, Assam for providing the facility of tools and equipment for doing the experimental research work. The authors also thank Mr. Maneswar Rahang for the assistance in running the experimental work in the workshop of Mechanical Engineering Department of NIT, Silchar.
REFERENCES
[1] Kuriachen Basil, Josephkunju Paul and Jeoju M.Issac,
“Spark Gap Optimization of WEDM Process on Ti6A14V”, International Journal of Engineering Science and Innovative Technology (IJESIT) 2(1), 364-369(2013)
[2] S. Datta and S. S. Mahapatra, “Modeling, Simulation and
Parametric Optimization of Wire EDM Process Using Response Surface Methodology Coupled with Grey-TaguchiTechnique”, International Journal of Engineering, Science and Technology,162-183 (2010).
[3] Puri, A. B., Bhattacharya, B., 2005, ―Modeling and
Analysis of White Layer Depth in a Wire-Cut EDM Process through Response Surface Methodology‖, International Journal of Advance Manufacturing Technology, 301-307.
[4] El-Taweel, T. A., 2009, ―Multi-response Optimization of
EDM with Al-Cu-Si-TiC P/M Composite Electrode‖, International Journal of Advance Manufacturing Technology 44:100-113.
[5] C.D.Shah, J.R.Mevada and B.C.Khatri, “Optimization of
Process Parameter of Wire Electrical Discharge Machine by Response Surface Methodology on Inconel-600”, International Journal of Emerging Technology and Advanced Engineering, 3(4), 2250-2459(2013).
[6] Ghosh A. and Mallik A. K. “Manufacturing Science”
second edition. Published by Affiliated East-West Press Private Limited, 105 Nirmal Tower 26 Barakhamba Road, New Delhi 110001; ISBN 978-81-7671-063-3.
[7] D. C. Montgomery, “Design and Analysis of
Experiments”, Publisher: John Wiley & Sons; 8th Edition.
[8] K. Krishnaiah & P. Shahabudeen, “Applied Design of
Experiments and Taguchi Methods Publisher”, Prentice
Hall India Learning Private Limited; 2012.
[9] B.M. Gopalsamy , B. Mondal & S. ghosh , “Taguchi
method and ANOVA : An approach for process parameters optimization of hard machining while machining hardened steel” Journal of Scientific & Industrial Research; 2009, 68: 686-695.
[10] M.N. Das, N.C. Giri, “Design and Analysis of experiments”,
New Age international (p) Ltd. Publisher, New Delhi;1999.
[11] N. Beri*, H Pungotra, A. Kumar “Effect of Polarity and
Current during Electric Discharge Machining of Inconel 718 with CuW Powder Metallurgy Electrode” Proceedings of the National Conference on Trends and Advances in Mechanical Engineering, YMCA University of Science & Technology, Faridabad, Haryana, Oct 19-20, 2012
[12] P.K.Mishra. The Institution of Engineers (India)
Textbook Series. “Nonconventional Machining” Narosa Publishing House Pvt. Ltd. 22 Delhi Medical Association Road. Daryaganj, New Delhi 110002 ISBN 978-81-7319-138.
[13] R. Kumar, O.P.Sahani, M.Vashista,”Effects of EDM
Process parameters on Tool Wear ” Journal of Basic and Applied Engineering Resarch (JBAER) 1(2), 53-56 (2014).
BIOGRAPHIES
Rashed Mustafa Mazarbhuiya is doing his final year PG course in the department of Mechanical Engineering, Assam Engineering College under the guidance of P.K. Choudhury, Assistant Professor, Assam Engineering College. So far Mr. Mazarbhuiya has attended two international conferences and presented his paper with Mr. Choudhury in its proceeding and journal.
Mr. Prasanta Kr. Choudhury is presently working as an Assistant Professor in the department of Mechanical Engineering, Assam Engineering College, since 2007.So far
he has supervised many
undergraduate and postgraduate projects along with publications in national and international conferences/journals. His research interests include Design and Process Optimization, Process Modelling and Application of Artificial Intelligence Techniques in Manufacturing as well as Pollution Engineering.