© 2017, IRJET | Impact Factor value: 5.181 | ISO 9001:2008 Certified Journal | Page 2889
EXPERIMENTAL STUDY ON PREPARATION AND CHARACTERIZATION OF
BIODIESEL PRODUCTION (ETHYL ESTER) FROM NON-EDIBLE VEGETABLE OILS
(JATROPHA CURCAS, KARANJA, MAHUA LONGIFOLIA OILS)
K.Sivakumar
*, C.Sivanesan
1, A.Ramadevi
2.
*Department of civil engineering, Alagappa Chettiar Government College of Engineering and Technology,
Karaikudi.
1
Assistant Professor in Civil Engineering, Alagappa Chettiar Government College of Engineering and Technology,
Karaikudi.
2
Professor and Head of the Department of Chemistry, Alagappa Chettiar Government College of Engineering and
Technology, Karaikudi.
---***---
Abstract-During last decade, India maintained a high population growth rate, which has also led to increased energy demand or consumption. The demand for petroleum has been rising rapidly due to increasing industrialization and modernization of the world. Biodiesel has become more attractive because of its environment benefits and it is obtained from renewable resources. Biodiesel is an alternative diesel fuel made from vegetable oils and animal fats. It is completely biodegradable and non-toxic. In this paper attempt has been made to review the different approaches and techniques used to generate biodiesel from non-edible vegetable oils through Transesterification process. Non-edible oils are not suitable for human consumption because of the presence of toxic components. The most commonly method is the Transesterification of triglycerides (vegetable oil and animal fats) with Alcohol (Ethanol) in the presence of catalyst (NaOH). Main objectives of the study are feasibility of Non-edible vegetable oils for the production of biodiesel, optimization of different parameters for high yield or conversion of Non-edible vegetable oils to biodiesel. Optimum conditions were found to be Temperature 60-70c, Molar ratio 1:6 (oil to ethanol ratio), Reaction time 30-40 min, catalyst (NaOH)1 % w/w. The main factors affecting the biodiesel yield of the molar ratio of alcohol to oil, catalyst concentration, reaction temperature, and reaction time are discussed. This paper was mainly focused reduction of NO, particulate matter, CO emissions from vehicular emission with the help of biodiesel.
Keywords: Biodiesel, Transesterification, Non-edible vegetable oils, Feasibility.
1. INTRODUCTION
India is high energy importing nation where maximum percent of our energy is supplied by imported fossil fuels. The diversification of kinds and sources of primary fuel is becoming vital energy issues in our country. But the common fossil fuels are not so plentiful and there is a chance to eventually run out. If an alternative can be found that would convert. Plant material to usable fuels it would demonstrate the green chemistry principle that using renewable starting materials such as substance derived from the growing plants rather than the materials like fossil fuels that are irreplaceable in short term. One such process is the manufacture of “Biodiesel’ an alternative to diesel fuel from vegetable oil.
© 2017, IRJET | Impact Factor value: 5.181 | ISO 9001:2008 Certified Journal | Page 2890
economic consideration. The energy obtained from wastewater edible oil is a form of renewable energy and in principle, utilizing this energy does not add carbon dioxide, which is one of the major greenhouse gases to atmospheric environmental, in contrast to fossil fuels. Due to extremely low content of sulphur and nitrogen in food waste its direct utilization as fuel in the combustion utilities (e.g internal combustion engine) generally utilization less environmental pollution and health risk as compared to fossil fuels. It is well know that the hydrocarbon in the diesel fuels includes a diversity of paraffin’s, olefins naphthenic and aromatic. Therefore carbon numbers of theses hydrocarbons present in the diesel fuels are mostly in the ranges of 12-22. Due to its high energy conversion and power output in diesel energy conversion and power output in diesel engines, diesel fuel has been extensively used in heavy trucks, city transport bus, electric generator farm equipment, etc. on the other hand, edible oil including vegetable oil and animal fats are principally glycerides (i.e triglycerides) formed from the glycerol. By way of transesterification, the reaction of triglycerides with alcohol (e.g ethanol or methanol) under the caustic catalyst (e.g potassium or sodium hydroxide) is processed to produced glycerol and mono alkyl esters which known as biodiesel and can be potentially used as alternative diesel fuel in compatible ignition engines. Bio diesel, one of the green fuels and or clean engines is compatible with traditional petroleum based diesel and both can be complete blended without any stratification. However the use of biodiesel shall face to its high cost relative to petroleum-based oils, and some problems related to decrease power output and torque force and to the increase in NOx emissions with decreased. Synthesis of biodiesel from vegetable oil is gaining consider global attention and market. The quality of biodiesel is an inherent properly coming out form the raw materials for examples from contents of vegetable oil or animal fat or namely the ester, partial glycerides, total glycerol etc.
Different types of vegetable oils are used by previous researches. Literature survey reveals that palm oil contains better fuel properties yet very little literature survey have been revealed on this field. A subtitle for an additive to diesel fuel that is derived from the oil sand fats of plants. An alternative fuel that required no engine modifications and provides power similar to conventional diesel fuel. A biodegradable transportation fuel that contributes no net carbon dioxide or sulfur to the atmosphere, and is low in particulate emissions. Bio diesel is the only alternative fuel that runs in any conventional, unmodified Diesel engine. Needs no change in refueling infrastructure and space part inventories. Maintains the
payload capacity and range of conventional diesel engines. Lubricity is improved over that of conventional diesel. Has a high flash point of about 300°F compared to that conventional diesel, Which has a flash pt 125°F. Quality of biodiesel depends on the blend thus quality can be tempered. There may be problem of winter operability. Neat biodiesel demands compatible elastomers (hoses, gaskets, etc ).
2.Materials And Methodology :
2.1Materials:
Soxhlet apparatus, Thermometer, Retort stand, Pipette, Measuring cylinder, Separating funnel, Magnetic stirrer, Hot air oven Water bath, Conical flask, Digital weighing balance, Stop watch, Hot plate, Hydrometer, Bomb calorimeter, Ethanol, Karanja oil.
2.2 Methodology:
Initial characterization of the karanja oil sample:
Proximate Analysis Involves In The Following Determination:
2.3 Moisture: About 1 g of vegetable oil is weighed in a crucible. The crucible is placed inside an electric hot air oven maintained at 105-110ºC. The crucible is allowed to remain in oven for 1 hour and then taken out cooled in a desiccator and weighed. Loss in weight is reported as moisture.
2.4 Volatile matter: The dried sample left in a crucible (1) is then covered with a lid and placed in an electric furnace maintained 120-135ºC. The crucible taken out of the oven after 7 minutes of heating.
2.5 Ash: The residual sample in the crucible in (2) is then heated without lid in a furnace at 550C for half an hour. The crucible is then taken out cooled first in air then in desiccator and weighed.
2.6 Other Parameters:
Percentage of other parameters=100-%of(moisture + volatile matter + ash)
2.7 Determination of acid value : 1g of oil was
© 2017, IRJET | Impact Factor value: 5.181 | ISO 9001:2008 Certified Journal | Page 2891
obtained. The acid value range varies from 0.92 to 6.16mg NaOH/g.
2.8 Determination of saponification value: The known quantity of oil was refluxed with an excess amount of alcoholic NaOH after saponification the remaining NaOH was estimated by titrating against a standard acid.
The oil sample was filtered to remove any impurities and last traces of moisture. 1 g of the oil was the weighed into a flask. 5 ml of ethanol and 25 ml of 0.5N alcoholic NaOH was added from burette allowing it to drain for the same duration of time. A reflux condenser was connected to the flasks and allowed to boil gently for one hour. After the flask and condenser get cooled, they were rinsed down the inside of the condenser when a little distilled water and then the condenser was removed. About a ml of indicator was added and titrated against 0.5m HCl until the pink color was disappeared. The saponification value ranges varies from 102.9 to 209 mg/g.
2.9 Determination of molecular weight:
Where
Sv- saponification value
Av-acid value
The molecular weight ranges varies from 800 to 1200 g/mole.
2.10 Determination of specific gravity: Density bottle was used to determine the specific gravity of the oil. A clean dry bottle was weighed and then filled with the oil a stopper was inserted and then reweighed to give. The oil substituted with water after washing and drying and weighed to give as the specific gravity values ranges from 0.860 to 0.973.
2.11 Determination of iodine value: To find the iodine value of a oil using the method wijs cyclohexane method. Add 2 d melted oil sample in a 200 m1 beaker. Collect 10 ml of cyclohexane and 25 ml of wijs solution. Dark place for 30 min shaking. After leaving 20 ml of 10 g/100ml KI. 100 ml of distilled water. Titrate with 0.1N sodium thiosulphate. Same the titration for blank measurements. The end point was yellow to colorless. The iodine value ranges varies from 0.92 to 11.2 mg of iodine/ g of oil.
2.12 Molar ratio for oil to ethanol:
2.13 Determination of calorific value: To find the calorific value with the help of bomb calorimeter. Calorific value of fuel is the total quality of heat liberated by complete combustion of a unit mass or volume of the fuel. The calorific value of oil ranges varies from 37.83 to 42.05 MJ/kg.
2.14 Determination of peroxide value: A 25 g of oil dissolved in 5 ml of chloroform. Additionally 0.25 ml of KI and 15 ml of distilled water. The mixture was titrated against 0.1N sodium thiosulphate solution. The end point recorded blue to colorless. The peroxide values ranges varies from 3.24 to 15.05 meq/ g of oil. Table 1 shows initial characterization of oil.
Table 1
Initial Characterization of oils
Sl. no Test Jatropha oil Karanja oil Mahua oil
1 Moisture content(%) 5.94 6.43 12.75
2 Voltage matter(%) 35.15 23.10 0.159
3 Ash(%) 95.06 92.12 93.45
4 Other parameter(%) 98.6385 98.418 98.779
5 Density (kg/cm³) 957.1 919.33 912
6 Specific gravity 0.9571 0.91933 0.912
7 Viscosity (cst@33°c) 43.6 54.3 58
8 Calorific
Value(MJ/kg) 36.01 38.20 39.70
9 Flash point(°c) 240 257 274
10 Fire point(°c) 248 264 282
11 Acid value 3.2 25.2 39.2
12 Saponification
value(mg/g) 140 88 144
13 Molecular weight (g/mole)
877.19 1910.828 1063.8
14 Iodine value (mg
© 2017, IRJET | Impact Factor value: 5.181 | ISO 9001:2008 Certified Journal | Page 2892
15 pH 7.15 7.02 6.02
16 Peroxide value
(meq/g of oil) 6.125 8.43 11.5
2.15 Pre-esterification:
i. Reduction of the fatty acid contained in the oil.
ii. Transesterification.
2.15.1 Reduction of free fatty acid:
As obtained in the test carried out on the vegetable oil, it was discovered that the free fatty acid (FFA) contents of oil are high (21.6%). Hence it became necessary to reduce it. The above mentioned process explained in more detail flow diagram.
There are many producers available in this modification to produce a better quality of biodiesel. This can be accomplished in four primary ways, blending of crude oils, micro emulsions, thermal cracking, and transesterification.
2.15.2 Transesterification:
Transesterification process also called as alcoholics. It is the displacement of alcohol from an ester by another alcohol in a process similar to hydrolysis, except that alcohol is used instead water. This process has been widely used to reduce the triglycerides.
RCOOR’+R”OH→ RCOOR”+R’OH
Transesterification of vegetable oils, a triglycerides reacts with an alcohol in the presence of a strong base, producing a mixture of ethyl esters and glycerol.
2.18 Step by Step procedure involved in
transesterification:
100 ml of oil was measured and poured into 1000 ml beaker and heated to a temperature of 60 to 80°C.
A quantity of ethanol was poured in a round bottom flask, in a soxhlet apparatus and the heater was turned on. This was done to purify the ethanol.
The sodium hydroxide pellet was taken exactly 1g by using weighing balance.
A solution of sodium ethoxide was prepared in a 250 ml beaker by mixing 1 g of sodium hydroxide pellet and 30 ml of ethanol. The solution was properly stirred until was completely dissolved.
The sodium ethoxide solution was heated to bring its temperature about 60°C.
Once desired temperature reached, the sodium ethoxide solution was poured in to the warm vegetable oil and stirrer vigorously for 50 minutes by using a magnetic stirrer. After completion of reaction, The biodiesel mixture was poured into separating funnel and allow to stand for about 24 hours, The lower layer was collected from the bottom of the separating funnel which is mainly comprised of glycerol and soap.
The collected upper layer was washed with warm water to remove any excess glycerol and soap that remain in the biodiesel.
This process was repeated until the clear water was seen, which indicate the biodiesel in the separating funnel is completely free from glycerol and soap.
The washed sample was dried to remove excess water present in the biodiesel.
The quantity of biodiesel collected was measured and recorded.
To study the emission characteristics of our biodiesel. The above procedures were repeated by varying the molar ratio of vegetable oil and ethanol, while keeping catalyst concentration, stirring time, and temperature are remains constant.
3. Results and discussions
The results of the research work discoursed under the following groups of solution. Analysis of the results from
the characterization of the biodiesel produce
characterization of the oil sample the various properties of the oil used are within range of table1. As observed, the saponification value of the oil is this is within the range given below. This property is very important because if it is too high the formation of soap will be more prevalent instead of the desired biodiesel. Another property that is very important is the moisture content from table1. If the moisture content of the oil sample is too high, soap formation will be more and there will be problems with the separation of the by-product. Free fatty acid level and pH are also very important more glycerin will be formed if the pH is too high. The two properties are within the range of the standard as seen.
© 2017, IRJET | Impact Factor value: 5.181 | ISO 9001:2008 Certified Journal | Page 2893
required mole of crystal was used so as to preventemulsification. The mixture was stirred rigorously so that the reactants will mix very well and produce the highest yield of reactants will mix very well and produce the highest yield of biodiesel possible under the given condition. The biodiesel produced is free from glycerol and soap because warm water was used to wash the biodiesel. This is necessary so that properties of the biodiesel produced will be acceptable when compared with the standard.
3.1 Characterization of biodiesel:
3.1.1 Analysis of Viscosity:
Viscosity is the measure of a materials resistance to flow. Viscosity is measured with the help of redwood viscometer. Viscosity is a result of the internal friction of the materials molecules. In the transesterification process to reduction the viscosity of triglycerides (vegetable oil or animal fat). The viscosity of biodiesel ranges varies from 1.9 to 6 cSt at 33ºC.
3.1.2 Flash point:
The lowest temperature at which the vapour of a substance momentarily takes fire fire in the form of a flash point. The flash point of biodiesel ranges from 50 to 240ºC.
3.1.3 Fire point:
The lowest point temperature at which the material gets ignited and burns under specified conditions of tests. Fire point of biodiesel ranges from 55 to 320 ºC.
3.1.4 Acid value: To protect engine due to corrosion with using biodiesel, so it’s essential to check out the acid value of biodiesel.
Table 2 shows jatropha, karanja, mahua biodiesel characterization.
3.2 Analysis of emissions from the karanja biodiesel:
Emission analysis with the help of flue gas analyzer. To check the emissions from the biodiesel exhaust variety of pollutant gases. Such that CO, NO, CO2, Hydrocarbon etc., The initial stage was biodiesel run in diesel engine thereafter analysis of emission using AVL gas analyzer.
Hence this paper studied only B100 formation of biodiesel
only. And also check fuel consumption of 10 cc per seconds due to performance efficiency.
Table 2
Biodiesel Characterization Sl. no Test Jatropha bio
diesel Karanja bio diesel Mahua bio diesel 1 Calorific Value(MJ/kg) 37.1 40.3 39
2 Flash point(°c) 65 55 186
3 Fire point(°c) 76 65 198
4 Acid value(mg
NaOH/g) 0.42 0.63 0.57
5 Density (kg/cm³) 886 890 897
6 Viscosity (cst@33°c) 4.36 4.58 6.80
[image:5.612.318.557.122.203.2]3.2.1The performance efficiency:
Fig 1. Performance efficiency
The fig 1 shown performance efficiency of while using diesel, jatropha, karanja, and mahua biodiesel, which the performance of karanja gives high efficiency, when load is increased fuel consumption in jatropha get increased. When a load is increased the fuel consumption of karanja and mahua biodiesel gives less fuel consumption. For Karanja biodiesel, as the load value increases, performance efficiency value also slightly decreases up to load 6 to 8.5, thereafter the performance efficiency value starts decreasing. The mahua biodiesel through the load value is 0, the initial value of fuel consumption for 10 cc in seconds gets 140. Then the load value gradually increased. Though the load value is 6, the value of fuel consumption for 10 cc in seconds gets 130, and also the load value is 8.5, the value of fuel consumption for 10 cc in seconds gets 110.For traditional diesel, as the load value increases, performance efficiency value also slightly decreases up to load 6 to 8.5, thereafter the performance efficiency value starts decreasing. Though load value is 0, the initial value of fuel consumption for 10 cc in seconds gets 114. Then the load value gradually increased. Though the load value is 6, the
0 50 100 150
0 5 10
fue
l c
o
n
su
m
p
tion
10 c
c p
e
r
sec
load in kg
Performance
efficiency
Diesel
karanja biodiesel
jatropha biodiesel
[image:5.612.336.530.251.428.2]© 2017, IRJET | Impact Factor value: 5.181 | ISO 9001:2008 Certified Journal | Page 2894
value of of fuel consumption for 10 cc in seconds gets 104 ,and also the load value is 8.5, the value of fuel consumption for 10 cc in seconds gets 92. For Mahua biodiesel, as the load value increases, performance efficiency value also slightly decreases up to load 0 to 8.5, thereafter the performance efficiency value starts decreasing. Though load value is 0, the initial value of fuel consumption for 10 cc in seconds gets 140. Then the load value gradually increased. Though the load value is 6, the value of of fuel consumption for 10 cc in seconds gets 120, and also the load value is 8.5, the value of fuel consumption for 10 cc in seconds gets 94. For Jatropha biodiesel, as the load value increases, performance efficiency value also slightly increases up to load 0 to 8.5, thereafter the performance efficiency value starts increasing. Though load value is 0, the initial value of fuel consumption for 10 cc in seconds gets 53.22. Then the load value gradually increased. Though the load value is 6, the value of fuel consumption for 10 cc in seconds gets 54.56, and also the load value is 8.5, the value of fuel consumption for 10 cc in seconds gets 57.5.
[image:6.612.337.542.376.544.2]3.2.2 Analysis of NO Emissions:
Fig 2. NO Emissions analysis
The flow diagram 2 explained NO emission in ppm, when load is increased the NO emission also increased. Hence the load value is increased the karanja biodiesel gets NO emissions are decreased. For Karanja biodiesel, as the load value increases, NO value also decreases up to load 6 to 8.5, thereafter the NO value starts decreasing. Though load value is 0, the initial value of NO emission is 36 ppm. Then the load value gradually increased. Though the load value is 6, the value of NO emission 62 ppm, and also
the load value is 8.5, the value of NO emission is 13 ppm. For Jatropha biodiesel, as the load value increases, NO value also slightly increases up to load 0 to 8.5, thereafter the NO value starts increasing. Though load value is 0, the initial value of NO emission is 4 ppm. Then the load value gradually increased. Though the load value is 6, the value of NO emission 20 ppm, and also the load value is 8.5, the value of NO emission is 47 ppm. For normal diesel, as the load value increases, NO value also increases up to load 6 to 8.5, thereafter the NO value starts increasing. Though load value is 0, the initial value of NO emission is 41 ppm. Then the load value gradually increased. Though the load value is 6, the value of NO emission 71 ppm, and also the load value is 8.5, the value of NO emission is 97 ppm. For mahua bio diesel, as the load value increases, NO value also increases up to load 0 to 8.5, thereafter the NO value starts increasing. Though load value is 0, the initial value of NO emission is 10 ppm. Then the load value gradually increased. Though the load value is 6, the value of NO emission 32 ppm, and also the load value is 8.5, the value of NO emission is 38 ppm.
[image:6.612.52.243.381.566.2]3.2.3 Analysis of CO Emissions in percentage:
Fig 3. CO Emission analysis in percentage
The flow diagram 3 explained CO emission, when load is increased the biodiesel emitted nearly diesel range CO emission gets slightly increased compared to the petroleum diesel fuel. The karanja biodiesel emitted CO emission, near diesel level. When load is increased jatropa emits more CO. For Karanja biodiesel, as the load value increases, CO value also slightly increases up to load 6 , thereafter the CO value starts decreasing. Though load value is 0, the initial value of CO emission is 0.03. Then the load value gradually increased. Though the load value is 6, the value of CO 0
20 40 60 80 100 120
0 5 10
NO
em
is
sio
ns
in pp
m
load in Kg
NO Emissions in
ppm
Diesel
Karanja biodiesel
jatropha biodiesel
mahua biodiesel
0 0.02 0.04 0.06 0.08 0.1
0 5 10
CO
em
is
sio
ns
pp
m
load in kg
CO Emissions in %
Diesel
Karanja biodiesel
jatropha biodiesel
© 2017, IRJET | Impact Factor value: 5.181 | ISO 9001:2008 Certified Journal | Page 2895
emission 0.04, and also the load value is 8.5, the valueof CO emission is 0.03. For Jatropha biodiesel, as the load value increases, CO value also slightly decreases up to load 0 to 8.5, thereafter the CO value starts decreasing. Though load value is 0, the initial value of CO emission is 0.08. Then the load value gradually increased. Though the load value is 6, the value of CO emission 0.07, and also the load value is 8.5, the value of CO emission is 0.06. For normal diesel, as the load value increases, CO value also slightly decreases up to load 6 to 8.5, thereafter the CO value starts decreasing. Though load value is 0, the initial value of CO emission is 0.03. Then the load value gradually increased. Though the load value is 6, the value of CO emission 0.03, and also the load value is 8.5, the value of CO emission is 0.03. For mahua biodiesel, as the load value increases, CO value also decreases up to load 0 to 8.5, thereafter the CO value starts decreasing. Though load value is 0, the initial value of CO emission is 0.05. Then the load value gradually increased. Though the load value is 6, the value of CO emission 0.04, and also the load value is 8.5, the value of CO emission is 0.03.
[image:7.612.51.275.401.583.2].3.2.4 Analysis of Carbon di Oxide Emissions:
Fig 4. CO2 Emission analysis in percentage
The flow diagram 4 explained CO2 emission shows when load is increased karanja gives less CO2 emission. When load is increased jatropa emits more CO2. For Karanja biodiesel, as the load value increases, CO2 value also slightly decreases up to load 6 to 8.5, thereafter the CO2 value starts decreasing. Though load value is 0, the initial value of CO2 emission is 0.7. Then the load value gradually increased. Though the load value is 6, the value of CO2
emission 1.1, and also the load value is 8.5, the value of CO2 emission is 0.7. For Jatropha biodiesel, as the load value increases, CO2 value also slightly decreases up to load 6 to 8.5, thereafter the CO2 value starts decreasing. Though load value is 0, the initial value of CO2 emission is 0.70, then the load value gradually increased. Though the load value is 6, the value of CO2 emission 1.00, and also the load value is 8.5, the value of CO2 emission is 1.2. For normal diesel, as the load value increases, CO2 value also increases up to load 0 to 8.5, thereafter the CO2 value starts decreasing. Though load value is 0, the initial value of CO2 emission is 0.70. Then the load value gradually increased. Though the load value is 6, the value of CO2 emission 0.90, and also the load value is 8.5, the value of CO2 emission is 1.10. For mahua biodiesel, as the load value increases, CO2 value also increases up to load 0 to
8.5, thereafter the CO2 emission value starts increasing.
Though load value is 0, the initial value of CO2 emission is 0.70. Then the load value gradually increased. Though the load value is 6, the value of CO2 emission 0.90, and also the load value is 8.5, the value of CO2 emission is 1.1.
3.2.5 Analysis of Hydrocarbons:
[image:7.612.328.532.434.623.2]The level of Hydrocarbon is higher than the biodiesel compared to the diesel fuel. Level of hydrocarbon in diesel 6 ppm and jatropha biodiesel 19.33 ppm, karanja 14.66 ppm, mahua biodiesel 22 ppm.
Fig 5. Level of Hydrocarbon
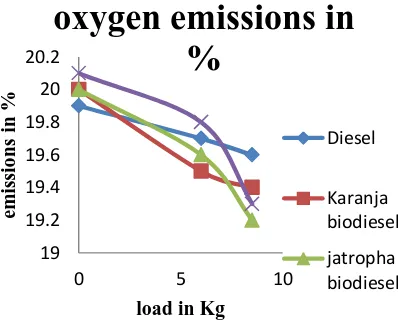
3.2.6 Analysis of oxygen Emissions:
The flow diagram of O2 emission in percentage explained when load is increased jatropha gives less 0
0.5 1 1.5
0 5 10
Car
b
o
n
d
i o
xi
d
e
e
m
issi
o
n
s
in
%
load in kg
Carbon di oxide
emissions in %
Diesel
Karanja biodiesel
jatropha biodiesel
mahua biodiesel
0 10 20 30 40 50
0 5 10
H
yd
ro
car
b
o
n
in
p
p
m
load in kg
Hydrocarbon in ppm
Diesel
Karanja biodiesel
jatropha biodiesel
© 2017, IRJET | Impact Factor value: 5.181 | ISO 9001:2008 Certified Journal | Page 2896
O2 emission, when load is increased karanja emits [image:8.612.42.241.220.380.2]more O2. For Karanja biodiesel, as the load value increases, O2 value also slightly decreases up to load 6 to 8.5, thereafter the O2 value starts decreasing. Though load value is 0, the initial value of O2 emission is 20. Then the load value gradually increased. Though the load value is 6, the value of O2 emission 19.6, and also the load value is 8.5, the value of O2 emission is 19.4.
Fig 6. Level of oxygen emissions in percentage
For Jatropha biodiesel, as the load value increases, O2 value also slightly decreases up to load 0 to 8.5, thereafter the O2 value starts decreasing. Though load value is 0, the initial value of O2 emission is 20. Then the load value gradually increased. Though the load value is 6, the value of O2 emission 19.6, and also the load value is 8.5, the value of O2 emission is 19.2. For normal diesel, as the load value increases, O2 value also slightly decreases up to load 6 to 8.5, thereafter the O2 value starts decreasing. Though load value is 0, the initial value of O2 emission is 20. Then the load value gradually increased. Though the load value is 6, the value of O2 emission 19.6, and also the load value is 8.5, the value of O2 emission is 19.5. For mahua biodiesel, as the load value increases, O2 value also decreases up to load 0 to 8.5, thereafter the O2 emission value starts decreasing. Though load value is 0, the initial value of O2 emission is 20.1. Then the load value gradually increased. Though the load value is 6, the value of O2 emission 19.8, and also the load value is 8.5, the value of O2 emission is 19.3.
4. Conclusions
In study the following useful conclusions are derived based on experimental work and also from test report In this thesis with the test report, the emission of NO, CO2,
hydrocarbon from the vehicular are get reduced and the molar ratio 1:6 optimum yield is obtained. The consumption level of biodiesel is less when compared to normal diesel. Mahua emits less and karanja give performances efficiency. In order to make the world greener, the renewable resource are used to replace non-renewable starting materials. So an alternative way is required to convert the biomass based energy to useable fuel. It is the principle of green chemistry. This process deals with the manufacture of biodiesel an alternative to diesel fuel from vegetable oils. Improves engine and fuel efficiency 51% than compared to the
traditional diesel fuel. The NO emissions reduced more
than 31% compared to the traditional diesel fuel. The CO2 emissions reduced compared to the traditional diesel fuel. Where loading 8.5 kg the emission rate of normal diesel 1.10% and karanja biodiesel fuel 0.7%.
The level of Hydrocarbon is higher than the biodiesel compared to the diesel fuel. Level of hydrocarbon in diesel 6 ppm and jatropha biodiesel 19.33 ppm, karanja 14.66 ppm, mahua biodiesel 22 ppm. Biodiesel is a fuel made from organic oils & chemically known as free fatty acid methyl ester (FAME) depending on the general characteristic value of the common vegetable oil found in the market it is found that vegetable oil is the best alternative to produce the biodiesel due to its high carbon content, kinetic viscosity & relative density. . Moreover, it is the relatively cheaper in the market.
The CO emissions slightly varied compared to the
traditional diesel fuel. Where the co emission in diesel fuel 0.03% and biodiesel fuel 0.03 to 0.08%. Due to larger fatty acid carbon chain of raw material the produced biodiesel contains high carbon content. But high flash point & high viscosity indicate a high level of safety for
biodiesel. The flash point of jatropha biodiesel 65oC and
fire point 76oC and viscosity 4.36 cst @ 33oC. The flash
point of karanja biodiesel 56oC and fire point 65oC and
viscosity 4.58 cst @ 33oC The flash point of mahua
biodiesel 186oC and fire point 198oC and viscosity 6.80
cst @ 33oC. Biodiesel is non-toxic and environment
friendly as it produces substantially less carbon monoxide and nitrogen monoxide the combustion gases contain no sulphur dioxide and unburnt hydrocarbons.
5. References
1. Grimm C and Maes J M.1997.Arthropod fauna associated with jatropha curcas L. in Nicaragua: A synopsis of species, their biology and pest status.
2. Howell S. 1996 Fleet managers role with biodiesel and
engine manufactures
19 19.2 19.4 19.6 19.8 20 20.2
0 5 10
em
is
sio
ns
in %
load in Kg
oxygen emissions in
%
Diesel
Karanja biodiesel
© 2017, IRJET | Impact Factor value: 5.181 | ISO 9001:2008 Certified Journal | Page 2897
3.Jones N and Miller J. H. 1992. Jatropha curcas: amultipurpose species for problematic sites
4. Krahl J. 1996. Enviromental effects of biodiesel and biodiesel exhaust: a European perspective
5. Shah S, Sharma A and Gupta M N. 2005. Extraction of oil from jatropha curcas L. seed kernels by combination of ultrasonication and aqueous enzymatic oil extraction. 6. Q. Junfeng, S. Haixlan, and Y. Zhi. 2010, preaparation of biodiesel from Jatropha curcas oil produced by two phase
solvent extraction