R E S E A R C H
Open Access
Effects of dietary protein/energy ratio on
growth performance, carcass trait, meat
quality, and plasma metabolites in pigs of
different genotypes
Yingying Liu
1,2,5†, Xiangfeng Kong
1†, Guoli Jiang
1,5, Bi
’
e Tan
1, Jinping Deng
3, Xiaojian Yang
4, Fengna Li
1*,
Xia Xiong
1and Yulong Yin
1*Abstract
Background:The protein/energy ratio is important for the production performance and utilization of available feed resources by animals. Increased protein consumption by mammals leads to elevated feed costs and increased nitrogen release into the environment. This study aimed to evaluate the effects of dietary protein/energy ratio on the growth performance, carcass traits, meat quality, and plasma metabolites of pigs of different genotypes.
Methods:Bama mini-pigs and Landrace pigs were randomly assigned to two dietary treatment groups
(Chinese conventional diet with low protein/energy ratio or National Research Council diet with high protein/energy ratio; n = 24 per treatment) in a 2 × 2 factorial arrangement. Blood and muscle samples were collected at the end of the nursery, growing, and finishing phases.
Results:We observed significant interactions (P< 0.05) between breed and diet for total fat percentage, intramuscular fat (IMF) content, protein content inbiceps femoris(BF) muscle, and plasma urea nitrogen (UN) concentration in the nursery phase; for average daily gain (ADG), average daily feed intake (ADFI), dry matter, IMF content inpsoas major
(PM) muscle, and plasma total protein and albumin concentrations in the growing phase; and for drip loss and plasma UN concentration in the finishing phase. Breed influenced (P< 0.05) growth performance, carcass traits, and meat quality, but not plasma metabolites. Throughout the trial, Landrace pigs showed significantly higher (P< 0.05) ADG, ADFI, dressing percentage, lean mass rate, and loin-eye area than did Bama mini-pigs, but significantly lower (P< 0.05) feed/gain ratio, fat percentage, backfat thickness, and IMF content. Dietary protein/energy ratio influenced the pH value, chemical composition of BF and PM muscles, and plasma activities of glutamic-pyruvic transaminase and gamma-glutamyl transpeptidase, and plasma concentration of UN.
Conclusions:Compared with Landrace pigs, Bama mini-pigs showed slower growth and lower carcass performance, but had better meat quality. Moreover, unlike Landrace pigs, the dietary protein/energy ratio did not affect the growth performance of Bama mini-pigs. These results suggest that, in swine production, low dietary protein/energy ratio may be useful for reducing feed costs and minimizing the adverse effects of ammonia release into the environment.
Keywords:Dietary protein/energy ratio, Growth performance, Meat quality, Mini-pig, Plasma metabolites
* Correspondence:lifengna@isa.ac.cn;yinyulong@isa.ac.cn
†Equal contributors
1Key Laboratory of Agro-ecological Processes in Subtropical Region, Hunan
Provincial Engineering Research Center of Healthy Livestock and Poultry, and Scientific Observing and Experimental Station of Animal Nutrition and Feed Science in South-Central, Ministry of Agriculture, Institute of Subtropical Agriculture, Chinese Academy of Sciences, Changsha, Hunan 410125, China Full list of author information is available at the end of the article
Background
The pig is one of the most economically important species among domesticated livestock and is a major protein source for human consumption. A major ob-jective of pig production is to increase skeletal muscle growth and reduce excess fat accretion. Livestock pro-ducers use nutritional modifiers in an attempt to in-crease protein accretion in the muscle, while they often simultaneously reduce fat deposition [1, 2]. The pattern of fat deposition in pigs in the growing-finishing phase affects carcass and meat quality [3]. Genetic selection of pigs for leaner meat has also re-sulted in reduced intramuscular fat (IMF) content, and consumers perceive the meat thus obtained as tougher, less moist, and poorly flavored. Thus, the livestock industry faces the challenge of increasing the IMF content of pork so that consumers may have a satisfactory experience, while simultaneously produ-cing minimal visible fat, which is a deterrent to health-conscious consumers.
In China, several rich resources of indigenous pig breeds are available, with more than 30 breeds established. In addition to their economic significance, pigs, particularly miniature pigs (mini-pigs), are considered important ani-mal models for human disease and xenotransplantation re-search because of their physiological and anatomical similarities to humans [4, 5]. Bama mini-pigs (Sus scrofa domestica), a Chinese indigenous mini-pig breed which originated in Bama County, Guangxi Province, is a promis-ing animal model [6, 7] with an obese genotype. In con-trast, Landrace, a representative lean genotype, is fast-growing breed and produces a relatively large amount of meat, and it is therefore more attractive to producers. Al-though muscle growth and meat quality considerably differ between Western and indigenous Chinese pig breeds, it is not clear how nutrients mediate the effect of genetic back-ground on animal growth and meat quality. The growth and development processes of pigs, which involve changes in body weight (BW) and shape as well as metabolic and physiological functions, depend on factors such as the breed, nutritional status, and feeding condition of the ani-mal. Against this background, the objective of the present study was to examine the effects of dietary protein/energy ratio on the growth performance, muscle development, and plasma metabolites (which are indicators of nitrogen metabolism) in Bama mini-pigs and Landrace pigs at dif-ferent phases of growth.
Methods Study animals
The experiment was carried out in accordance with the Chinese guidelines for animal welfare and experimental protocol, and was approved by the Animal Care and Use Committee of the Institute of Subtropical Agriculture,
Chinese Academy of Sciences [8]. Ninety-six barrows (including 48 Bama mini-pigs, a Chinese local breed [average initial BW, 3.38 ± 0.96 kg], and 48 Landrace piglets [average initial BW, 7.68 ± 0.89 kg]) were used in this study.
Study design
The experiment was a 2 × 2 factorial arrangement, with two breeds (Bama mini-pig vs. Landrace) and two diet-ary treatments (Chinese conventional diet [GB diet] and National Research Council [NRC] diet), resulting in a total of four treatments (Table 1). Piglets of each breed were randomly assigned to one of two dietary treatment groups (n = 24 per treatment). The NRC diet was formu-lated to meet the nutrient requirements recommended by NRC (2012) [9] and had a high protein/energy ratio, whereas the GB diet was formulated per the recommen-dations of Chinese National Feeding Standard for Swine (GB, 2004) [10] and had a low protein/energy ratio (Table 2 and Additional file 1: Table S1). The animals were individually housed in 0.6 m × 1.2 m pens with hard plastic slatted flooring. Each pen was equipped with a stainless steel feeder and a nipple drinker. The animals had free access to drinking water and feed. The room temperature was maintained at 25–27 °C. All pigs were fed three times per day at 0800, 1300, and 1800 h. Diet-ary phase changes were noted on the day on which the pigs were weighed; these changes were noted on the same day for all treatment types. Every 2 weeks, feed in-take was recorded in order to determine average daily gain (ADG), average daily feed intake (ADFI), and the feed intake to body gain ratio (F/G).
Sample collection
jugular vein injection of 4 % sodium pentobarbital solution (40 mg/kg BW) [11]. After the head, legs, tail, and viscera were removed, the carcass was split longitudinally. Longissimus dorsi (LD), biceps femoris
(BF), and psoas major (PM) muscles from the right-side of each carcass were immediately sampled after slaughter, and stored at −20 °C for biochemical ana-lysis (including evaluation of dry matter [DM], crude protein [CP], and crude lipid contents). The LD muscle on the right-side carcass was removed, and approximately 2.5-cm-thick sections were cut from the anterior end for assessment of meat quality be-fore and after chilling the carcass for 24 h [2]. Blood samples were subsequently centrifuged at 900 ×g for 10 min at 4 °C to recover plasma. Plasma samples were stored at −80 °C until analysis.
Determination of carcass composition
Pre-slaughter BW, carcass weight, carcass length, backfat thickness, and loin-eye area at the 10thrib were measured immediatelypost-mortemaccording to the Chinese Guide-lines on Performance Measurement Technology and Regu-lations for Pigs [12]. Carcass straight length was measured from the first rib to the end of the pubic bone. Backfat thickness was measured using a vernier caliper, and the average measurements at three points: the first rib, last rib, and last lumbar vertebra were recorded. The left side of each carcass was weighed and then physically dissected into skin, skeletal muscle, fat, and bone for evaluation of carcass characteristics. These components were weighed, and the weights were multiplied by 2 to calculate the per-centage of the whole carcass that each component consti-tuted. Dressing percentage was calculated as carcass weight divided by live BW.
Assessment of meat quality
Meat quality was examined at the end of experiment by determining the pH, muscle color, drip loss, and cook-ing yield. Initial pH (pH45min) and final pH (pH24h)
values were measured in triplicate at the 6th to 7th rib position at 45 min and 24-h postmortem, respectively, using a hand-held pH meter (Russell CD700; Russell pH Limited, Germany). Muscle color scores were assigned to LD muscle at the 10thrib interface by using a Konica Minolta chromameter (CR410; Konica Minolta Sensing, Inc., Tokyo, Japan) with an 8-mm measuring port, D65 illuminant, and 10 observers. Hunter lightness (L*), red-ness (a*), and yellowness (b*) values were recorded in triplicate. For evaluating drip loss, on the day of slaugh-ter, approximately 100 g fresh LD muscle was weighed and placed in a Whirl-Pak bag, suspended in a 4 °C cooler for 24 h, reweighed, and drip loss was recorded. Percentage of cooking meat was measured by determin-ing the weight of cooked LD muscle. The muscle sample was weighed and covered in a container before cooking. Immediately after cooking for 45 min at 100 °C, the sam-ple was removed from the container and dried with a paper towel, then reweighed. Cooking yield was expressed using the following formula: Cooking yield = (cooked weight/raw weight) × 100.
Chemical analysis of skeletal muscle
Chemical composition of the skeletal muscle was analyzed in duplicate according to AOAC methods (1997) [13]. DM content of muscle was determined gravimetrically by oven drying the samples at 110 °C for 24 h. CP and lipid contents were measured using Kjeldahl and Soxhlet ex-traction methods, respectively [2].
Analysis of plasma metabolites
Plasma activities of alkaline phosphatase (ALP), glutamic-pyruvic transaminase (GPT), glutamic-oxaloacetic trans-aminase (GOT), lactate dehydrogenase (LDH), creatine phosphokinase (CPK), and gamma-glutamyl transpepti-dase (GGT), and plasma concentrations of albumin (Alb), total protein (TP), ammonia (AMM), and urea nitrogen (UN) were analyzed using a CX-4 Automatic Biochemical Analyzer (Beckman Inc., USA) and commercial kits
Table 2Nutrient content of experimental diets
Item NRC
diet 1 NRC diet 2
NRC diet 3
GB diet 1
GB diet 2
GB diet 3
Digestible energy, MJ/kg
14.22 14.21 14.22 13.46 13.40 13.40
Crude protein, % 20.06 18.01 15.11 18.03 16.05 13.46
Protein/energy ratio
1.41 1.27 1.06 1.34 1.20 1.00
GB diet, Chinese conventional diet
Table 1Animals and treatments
Item Landrace pig Bama mini-pig
Body weight GB diet group NRC diet group Body weight GB diet group NRC diet group
Nursery phase 10–20, kg GB diet 1 NRC diet 1 8–15, kg GB diet 1 NRC diet 1
Growing phase 20–50, kg GB diet 2 NRC diet 2 15–35, kg GB diet 2 NRC diet 2
Finishing phase 50–90, kg GB diet 3 NRC diet 3 35–55, kg GB diet 3 NRC diet 3
(Leadman Biochemistry Technology Company, Beijing, China) according to the manufacturers’instructions [14].
Statistical analysis
Data were analyzed by a mixed-effects model using the SAS version 8.2 (SAS Institute Inc., Cary, NC, USA). Diet, breed, and their interactions were included in the statistical model. Effects were considered statistically sig-nificant at P< 0.05. Probability values between 0.05 and 0.10 were considered to be trends.
Results
Growth performance
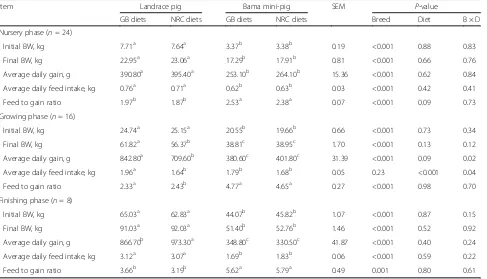
All pigs showed healthy growth throughout the experi-mental period. ADG and ADFI of Bama mini-pigs were lower (P< 0.05), whereas F/G was higher (P< 0.05) when compared with Landrace pigs in the same phase and fed the same diet (Table 3). The growth performance of Bama mini-pigs did not significantly differ (P> 0.05) be-tween dietary treatments in any of the three phases. However, in the growing phase, Landrace pigs fed the GB diet had higher (P< 0.05) ADG and ADFI than those fed the NRC diet, indicating breed × diet inter-actions (P< 0.05). In contrast, in the finishing phase, Landrace pigs fed the GB diet had lower (P< 0.05) ADG than those fed the NRC diet.
Carcass quality
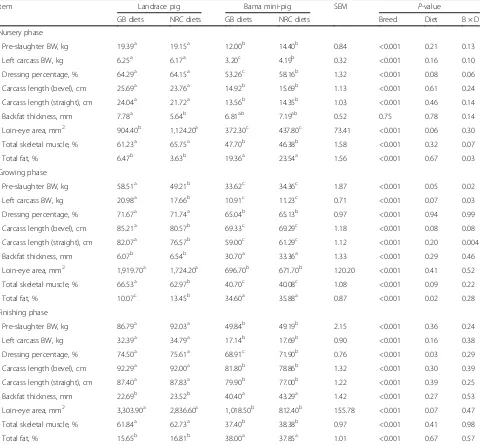
Table 4 shows the effects of treatments on carcass charac-teristics. In all phases, Bama mini-pigs had significantly lower (P< 0.05) dressing percentage, carcass length, loin-eye area, and skeletal muscle percentage (15–25 units dif-ference), but higher (P< 0.05) total fat percentage (1–20
units difference) than did Landrace pigs. Except during the nursery phase, the backfat thickness of Bama mini-pigs was greater (P< 0.05) than that of Landrace pigs (2- to 5-fold difference after the nursery phase). In the nursery and finishing phases, Bama mini-pigs fed the NRC diet showed significantly higher (P< 0.05) dressing per-centages than those fed the GB diet. In the nursery phase, Landrace pigs fed the NRC diet had significantly greater (P< 0.05) loin-eye area and reduced backfat thickness (P< 0.05) than those fed the GB diet. However, in the growing phase, Landrace pigs fed the GB diet had longer carcasses, more total skeletal muscle, and lower percent-age of fat than those fed the NRC diet (P< 0.05).
Meat quality
Compared with Landrace pigs, Bama mini-pigs had lower (P< 0.05) pH45minand pH24h, but higher (P< 0.05)
a*and cooking yield (Table 5). For Bama mini-pigs, the NRC diet showed increased (P< 0.05) pH24h in the
fin-ishing phase. A breed × diet interaction (P< 0.05) was observed for dripping loss.
Table 3Effects of dietary protein/energy ratio and breed on growth performance of pigs
Item Landrace pig Bama mini-pig SEM P-value
GB diets NRC diets GB diets NRC diets Breed Diet B × D
Nursery phase (n= 24)
Initial BW, kg 7.71a 7.64a 3.37b 3.38b 0.19 <0.001 0.88 0.83
Final BW, kg 22.95a 23.06a 17.29b 17.91b 0.81 <0.001 0.66 0.76
Average daily gain, g 390.80a 395.40a 253.10b 264.10b 15.36 <0.001 0.62 0.84
Average daily feed intake, kg 0.76a 0.71a 0.62b 0.63b 0.03 <0.001 0.42 0.41
Feed to gain ratio 1.97b 1.87b 2.53a 2.38a 0.07 <0.001 0.09 0.73
Growing phase (n= 16)
Initial BW, kg 24.74a 25.15a 20.55b 19.66b 0.66 <0.001 0.73 0.34
Final BW, kg 61.82a 56.37b 38.81c 38.95c 1.70 <0.001 0.13 0.12
Average daily gain, g 842.80a 709.60b 380.60c 401.80c 31.39 <0.001 0.09 0.02
Average daily feed intake, kg 1.96a 1.64b 1.79b 1.68b 0.05 0.23 <0.001 0.04
Feed to gain ratio 2.33a 2.43b 4.77a 4.65a 0.27 <0.001 0.98 0.70
Finishing phase (n= 8)
Initial BW, kg 65.03a 62.83a 44.07b 45.82b 1.07 <0.001 0.87 0.15
Final BW, kg 91.03a 92.03a 51.40b 52.76b 1.46 <0.001 0.52 0.92
Average daily gain, g 866.70b 973.30a 348.80c 330.50c 41.87 <0.001 0.40 0.24
Average daily feed intake, kg 3.12a 3.07a 1.69b 1.83b 0.06 <0.001 0.59 0.22
Feed to gain ratio 3.66b 3.19b 5.62a 5.79a 0.49 0.001 0.80 0.61
a, b, c
Table 4Effects of dietary protein/energy ratio and breed on carcass performance in pigs
Item Landrace pig Bama mini-pig SEM P-value
GB diets NRC diets GB diets NRC diets Breed Diet B × D
Nursery phase
Pre-slaughter BW, kg 19.39a 19.15a 12.00b 14.40b 0.84 <0.001 0.21 0.13
Left carcass BW, kg 6.25a 6.17a 3.20c 4.19b 0.32 <0.001 0.16 0.10
Dressing percentage, % 64.29a 64.15a 53.26c 58.16b 1.32 <0.001 0.08 0.06
Carcass length (bevel), cm 25.69a 23.76a 14.92b 15.69b 1.13 <0.001 0.61 0.24
Carcass length (straight), cm 24.04a 21.72a 13.56b 14.35b 1.03 <0.001 0.46 0.14
Backfat thickness, mm 7.78a 5.64b 6.81ab 7.19ab 0.52 0.75 0.78 0.14
Loin-eye area, mm2 904.40b 1,124.20a 372.30c 437.80c 73.41 <0.001 0.06 0.30
Total skeletal muscle, % 61.23a 65.75a 47.70b 46.38b 1.58 <0.001 0.32 0.07
Total fat, % 6.47b 3.63b 19.36a 23.54a 1.56 <0.001 0.67 0.03
Growing phase
Pre-slaughter BW, kg 58.51a 49.21b 33.62c 34.36c 1.87 <0.001 0.05 0.02
Left carcass BW, kg 20.98a 17.66b 10.91c 11.23c 0.71 <0.001 0.07 0.03
Dressing percentage, % 71.67a 71.74a 65.04b 65.13b 0.97 <0.001 0.94 0.99
Carcass length (bevel), cm 85.21a 80.57b 69.33c 69.29c 1.18 <0.001 0.08 0.08
Carcass length (straight), cm 82.07a 76.57b 59.00c 61.29c 1.12 <0.001 0.20 0.004
Backfat thickness, mm 6.07b 6.54b 30.70a 33.36a 1.33 <0.001 0.29 0.46
Loin-eye area, mm2 1,919.70a 1,724.20a 696.70b 671.70b 120.20 <0.001 0.41 0.52
Total skeletal muscle, % 66.53a 62.97b 40.70c 40.08c 1.08 <0.001 0.09 0.22
Total fat, % 10.07c 13.45b 34.60a 35.88a 0.87 <0.001 0.02 0.28
Finishing phase
Pre-slaughter BW, kg 86.79a 92.03a 49.84b 49.19b 2.15 <0.001 0.36 0.24
Left carcass BW, kg 32.39a 34.79a 17.14b 17.69b 0.90 <0.001 0.16 0.38
Dressing percentage, % 74.50a 75.61a 68.91c 71.90b 0.76 <0.001 0.03 0.29
Carcass length (bevel), cm 92.29a 92.00a 81.80b 78.86b 1.32 <0.001 0.30 0.39
Carcass length (straight), cm 87.40a 87.83a 79.90b 77.00b 1.22 <0.001 0.39 0.25
Backfat thickness, mm 22.69b 23.52b 40.40a 43.29a 1.42 <0.001 0.27 0.53
Loin-eye area, mm2 3,303.90a 2,836.60a 1,018.50b 812.40b 155.78 <0.001 0.07 0.47
Total skeletal muscle, % 61.84a 62.73a 37.40b 38.38b 0.97 <0.001 0.41 0.98
Total fat, % 15.65b 16.81b 38.00a 37.85a 1.01 <0.001 0.67 0.57
a, b, c
Mean values with unlike superscript letters were significantly different (P< 0.05).n =8 GB diets, Chinese conventional diets; B × D, breed × diet interaction
Table 5Effects of dietary protein/energy ratio and breed on meat quality in finishing pigs
Item Landrace pig Bama mini-pig SEM P-value
GB diets NRC diets GB diets NRC diets Breed Diet B × D
pH value (45 min) 6.38a 6.22ab 6.08b 6.08b 0.07 0.01 0.34 0.36
pH value (24 h) 5.45a 5.49a 5.29b 5.45a 0.04 0.06 0.05 0.27
L* 47.62 47.47 48.55 48.11 1.00 0.85 0.27 0.33
a* 12.87c 13.80bc 14.30ab 15.29a 0.30 <0.001 0.01 0.94
b* 5.62 5.68 6.11 5.70 0.39 0.57 0.69 0.60
Drip loss, % 1.99a 1.53ab 1.16b 1.62ab 0.20 0.12 0.99 0.05
Cooking yield, % 53.45 53.22 55.49 55.78 0.81 0.02 0.97 0.78
a, b, c
Chemical composition of muscle
Chemical compositions of LD, BF, and PM muscles were examined (Table 6). The lipid content of these muscles
was significantly higher (P< 0.05) in Bama mini-pigs than in Landrace pigs. The DM contents of BF in the nursery phase; that of LD, BF, and PM in the growing
Table 6Effects of dietary protein/energy ratio and breed on muscle chemical composition in pigs, %
Item Landrace pig Bama mini-pig SEM P-value
GB diets NRC diets GB diets NRC diets Breed Diet B × D
Nursery phase
Longissimus dorsimuscle
Dry matter 23.75 23.68 23.61 24.09 0.33 0.69 0.55 0.41
Intramuscular fat 1.22b 1.06b 2.82a 3.54a 0.26 <0.001 0.30 0.10
Crude protein 18.34b 19.69a 19.47a 19.61a 0.36 0.17 0.05 0.11
Biceps femorismuscle
Dry matter 22.11bc 21.39c 23.39a 23.15ab 0.42 0.001 0.26 0.57
Intramuscular fat 0.86c 0.99c 3.25a 2.45b 0.22 <0.001 0.14 0.05
Crude protein 17.60bc 16.49c 18.51ab 19.01a 0.40 <0.001 0.46 0.05
Psoas majormuscle
Dry matter 22.21 22.42 21.77 22.37 0.35 0.50 0.27 0.59
Intramuscular fat 0.89b 0.94b 2.48a 2.32a 0.20 <0.001 0.78 0.62
Crude protein 16.94b 17.41b 17.72ab 18.56a 0.35 0.01 0.09 0.63
Growing phase
Longissimus dorsimuscle
Dry matter 25.07b 25.05b 29.11a 27.37a 0.63 <0.001 0.24 0.25
Intramuscular fat 1.16b 1.50b 3.73a 3.50a 0.34 <0.001 0.89 0.48
Crude protein 21.27b 20.77b 21.98ab 22.73a 0.39 0.007 0.79 0.18
Biceps femorismuscle
Dry matter 23.15b 22.89b 26.79a 23.76b 0.75 0.01 0.05 0.10
Intramuscular fat 1.01b 0.81b 2.77a 1.68b 0.30 <0.001 0.05 0.17
Crude protein 19.80b 19.24b 22.13a 19.35b 0.71 0.13 0.04 0.16
Psoas majormuscle
Dry matter 23.67c 23.68c 26.78a 24.97b 0.36 <0.001 0.04 0.03
Intramuscular fat 1.06b 1.19b 4.66a 2.25b 0.36 <0.001 0.01 0.005
Crude protein 19.82 20.17 21.07 20.84 0.51 0.10 0.91 0.62
Finishing phase
Longissimus dorsimuscle
Dry matter 26.16c 26.56bc 28.74a 28.26ab 0.58 0.004 0.95 0.50
Intramuscular fat 2.59b 2.48b 5.85a 4.50a 0.44 <0.001 0.15 0.22
Crude protein 21.32 22.02 21.73 21.93 0.47 0.76 0.40 0.64
Biceps femorismuscle
Dry matter 24.97b 25.18b 25.43b 28.93a 0.77 0.02 0.04 0.07
Intramuscular fat 1.42c 1.88c 3.65b 5.23a 0.31 <0.001 0.01 0.12
Crude protein 20.84ab 21.19ab 19.41b 22.85a 0.81 0.90 0.05 0.10
Psoas majormuscle
Dry matter 25.47 24.70 26.42 26.04 0.57 0.10 0.40 0.77
Intramuscular fat 2.46b 2.43b 4.01a 4.00a 0.38 0.002 0.96 0.97
Crude protein 21.08 21.30 20.70 20.91 0.48 0.51 0.71 0.99
a, b, c
phase; and that of LD and BF in the finishing phase were higher (P< 0.05) in Bama mini-pigs than in Land-race pigs. In addition, compared with the LandLand-race pigs, Bama mini-pigs had higher (P< 0.05) CP levels in the BF and PM muscles in the nursery phase and in the LD muscle in the growing phase. Bama mini-pigs fed the GB diet had higher (P< 0.05) lipid content in the
BF muscle in the nursery phase, and significantly higher (P< 0.05) contents of DM, lipid, and CP in the BF and PM muscles in the growing phase, than those fed the NRC diet. In the finishing phase, Bama mini-pigs fed the GB diet had lower (P< 0.05) contents of DM, lipid, and CP in the BF muscle than those fed the NRC diet.
Table 7Effects of dietary protein/energy ratio and breed on the plasma biochemical parameters in pigs
Item Landrace Bama mini-pig SEM P-value
GB diets NRC diets GB diets NRC diets Breed Diet B × D
Nursery phase
ALP, U/L 173.63b 148.88b 235.88a 182.63ab 18.64 0.01 0.04 0.45
GPT, U/L 62.88 77.75 67.63 81.00 7.94 0.62 0.08 0.92
GOT, U/L 64.00 89.00 71.50 101.63 14.75 0.50 0.07 0.86
LDH, U/L 665.50 742.63 654.63 793.00 60.15 0.74 0.08 0.61
CPK, U/L 1,622.00 2,218.50 1,654.40 1,901.00 347.96 0.68 0.23 0.62
GGT, U/L 111.00 75.38 66.00 82.63 16.63 0.27 0.57 0.13
Alb, g/L 31.53 32.31 34.97 34.74 2.14 0.18 0.89 0.81
TP, g/L 61.92b 68.39ab 64.67ab 71.51a 2.72 0.29 0.02 0.94
AMM,μmol/L 213.31 113.75 167.10 129.14 34.25 0.66 0.05 0.38
UN, mmol/L 6.79a 5.86ab 5.06b 5.81ab 0.41 0.04 0.82 0.05
Growing phase
ALP, U/L 207.67a 192.33a 123.67b 90.75b 18.00 <0.001 0.24 0.67
GPT, U/L 99.67a 71.33b 69.50b 72.13b 4.76 0.03 0.31 0.17
GOT, U/L 92.67 84.83 64.83 63.38 16.26 0.19 0.80 0.86
LDH, U/L 854.21a 996.22a 490.50b 503.44b 116.31 0.003 0.56 0.62
CPK, U/L 1,614.50 1,640.00 1,826.30 1,608.00 337.95 0.81 0.80 0.75
GGT, U/L 120.00a 71.00b 67.33b 72.00b 13.04 0.18 0.26 0.16
Alb, g/L 48.98a 39.35b 38.65b 37.75b 1.73 0.005 0.01 0.03
TP, g/L 87.28a 69.82b 84.80a 85.02a 3.52 0.12 0.04 0.03
AMM,μmol/L 88.02 112.68 96.18 139.16 11.63 0.32 0.06 0.60
UN, mmol/L 6.52 6.56 5.25 5.42 0.68 0.13 0.89 0.93
Finishing phase
ALP, U/L 114.00ab 157.83a 85.60b 117.14ab 13.98 0.05 0.03 0.72
GPT, U/L 62.80ab 70.00a 51.60b 67.14ab 4.70 0.22 0.05 0.46
GOT, U/L 46.40 56.33 46.40 46.57 6.06 0.51 0.49 0.50
LDH, U/L 498.40 551.33 377.80 387.43 49.59 0.03 0.60 0.72
CPK, U/L 1,974.00a 1,901.30a 1,925.00a 897.10b 267.43 0.11 0.10 0.15
GGT, U/L 49.80 52.17 51.20 56.43 4.21 0.58 0.46 0.78
Alb, g/L 39.30 40.30 37.50 39.17 1.26 0.34 0.38 0.82
TP, g/L 75.88 76.67 82.12 81.94 2.60 0.08 0.92 0.88
AMM,μmol/L 88.98 97.60 72.64 87.01 11.87 0.35 0.43 0.84
UN, mmol/L 5.12a 4.03b 4.47ab 5.29a 0.28 0.18 0.38 0.05
a, b, c
Mean values with unlike superscript letters were significantly different (P< 0.05).n =8
Plasma metabolites
Plasma biochemical analytes of Bama mini-pigs and Landrace pigs are listed in Table 7. In the nursery phase, no breed × diet interactions were observed (P> 0.05) for plasma biochemical analytes except for UN (P= 0.05). For pigs fed the GB diet, the plasma ALP activity was lower (P< 0.05), but UN concentration was higher (P< 0.05) in Landrace pigs than in Bama mini-pigs. Within each breed, diet did not influence (P> 0.05) the concen-trations of plasma metabolites.
In the growing phase, breed × diet interactions were observed (P< 0.05) for plasma concentrations of TP and Alb. Plasma activities of ALP and LDH in Landrace pigs were higher (P< 0.05) than those in Bama mini-pigs. Landrace pigs fed the GB diet had higher (P< 0.05) plasma activities of GPT and GGT, and higher (P< 0.05) concen-trations of TP and Alb than those fed the NRC diet.
In the finishing phase, no interactions were observed (P> 0.05) between breed and diet for any of the plasma biochemical analytes, except for UN (P= 0.05). Landrace pigs fed the NRC diet had lower (P< 0.05) plasma UN concentration than those fed the GB diet. Bama mini-pigs fed the GB diet had higher (P< 0.05) plasma CPK activity than those fed the NRC diet.
Discussion
The growth performance of pigs and their meat quality de-pend on the interactive effects of genotype, rearing condi-tions, pre-slaughter handling, and carcass/meat processing [15–17]. The present study focused on evaluating the ef-fects of breed and dietary protein/energy ratio on growth performance, carcass composition, and meat quality. We found significant interaction effects of breed and diet on growth performance and carcass composition. Bama mini-pigs grew more slowly than Landrace mini-pigs, and their car-casses were composed of less lean meat and more fat than those of Landrace pigs. These findings indicate that there are obvious differences in carcass composition between breeds, as previously reported [18, 19]. Furthermore, the backfat in the native breed was much thicker than that in the Landrace breed. This was expected, as Landrace pigs are the result of several years of genetic selection through Mendelian genetics and molecular genetics approaches for traits including increased growth rate and reduced fat con-tent [20]. Within each breed, pigs fed the NRC diet had considerably higher dressing percentage than those fed the GB diet. However, in Landrace pigs, GB diet promoted carcass length and lean percentage, especially during the growing phase. The accelerated development of bones and muscle may have resulted from compensatory growth due to low nutrition. Landrace pigs fed the NRC diet deposited less fat than Bama mini-pigs. This may result from the high capacity for muscle growth of fast-growing genotypes, such
as Landrace pig, which can utilize high nutrient diets with-out increased lipid deposition.
Meat quality is one of the most important economic traits of farm animals, and it determines the suitability of meat for further processing and storage, including re-tail display. The main desirable attributes are pH, color, drip loss, fat content, and composition [21]. In our study, Bama mini-pigs exhibited more carcass fat, higher IMF content, and greater backfat thickness, but reduced dressing percentage, lean content of carcass, drip loss, and LD muscle area than did Landrace pigs in the same phase. These findings agree with previous reports of the superior quality of local Chinese pigs [22, 23]. Several studies have shown different dietary protein/ energy ratios in animal feeds. Some of these studies examined the growth performance, body composition, and metabolism of aquatic livestock [24], and others were related to obesity and health of humans [25, 26]. Dietary protein/energy ratio has a significant influence on the fat deposition and chemical composition of muscle. Barea et al. [27] reported that gain:feed and gain:metabolizable en-ergy intake were improved by decreasing the ideal CP content of the diet. In their study, when a diet providing 95 g ideal CP per kg DM was fed, protein deposition reached a maximum value of 71 g/day. Hamill et al. [28] reported a two-fold increase in IMF content of the muscu-lus semimembranosusof Duroc gilts fed a low-protein diet compared to those fed a high-protein diet. Moreover, they demonstrated, via transcriptome analysis, that regulation of IMF accumulation in response to dietary protein re-striction is associated with modulation of gene pathways involved in lipid synthesis and degradation. A high IMF content, also called “marbling fat”, is associated with improved eating quality of meat [29]. The threshold level of IMF in meat that results in a pleasing eating experience is 1.5% IMF, with 2–3 % IMF considered necessary for optimum eating quality [30]. In our study, IMF contents of all muscle samples examined from Bama mini-pigs were greater than 1.5 %. However, the IMF contents varied across the different muscle samples, and IMF contents in BF of Bama mini-pigs differed across phases.
role in anaerobic cellular metabolism [34]. GGT catalyzes the transfer of the gamma-glutamyl group from glutathione to acceptor amino acids. In this study, plasma activities of ALP and LDH were higher in Landrace pigs than in Bama mini-pigs, especially in the growing phase. Plasma activities of GPT and GGT in Landrace pigs fed the GB diet were higher than those fed the NRC diet. All of these findings were coincident with growth performance within the same phase.
Nitrogen is an indicator of protein status [35] and has been used to determine protein requirements and lean tis-sue growth rates in pigs. Blood UN, as the ultimate and major nitrogenous product of protein and amino acid ca-tabolism, is synthesized in the body via the ornithine cycle [36, 37]. Plasma UN concentration reflects the balance sta-tus of amino acids, and is often used as an indicator of kid-ney and liver function, as well as an indicator of relative hydration status in animals. Low blood UN indicates a good balance of amino acids, and suggests relatively low urea synthesis and hydration in the liver and relatively high diet-ary protein efficiency [38]. In the present study, we found that Landrace pigs fed the NRC diet had lower plasma con-centration of UN, whereas Bama mini-pigs fed the same diet had higher plasma concentration of UN, than did those fed the GB diet. These findings suggest an interaction effect between breed and diet. In addition, increased protein con-sumption by mammals results in increased fecal ammonia, which is a polluting substance [39, 40]. Therefore, limiting protein ingestion will also limit the ammonia excretion in fecal substances; lower plasma concentrations of UN could decrease the emission of ammonia from pig produc-tion, thereby reducing environmental pollution.
Conclusions
Compared to Landrace pigs, Bama mini-pigs showed slower growth and lower carcass performance, but had bet-ter meat quality, which confirms that this breed of pig is well suited for the production of high-quality pork. Al-though dietary protein/energy ratio affects the growth per-formance of Landrace pigs, which depends on the growth stage, we found that the dietary protein/energy ratio did not affect Bama mini-pigs. This finding may be useful for reducing the feed cost and minimizing the adverse effects of ammonia release to the environment in indigenous pig production.
Additional file
Additional file 1:Table S1.Ingredients and nutrient levels of experimental diets. (DOC 47 kb)
Abbreviations
ADFI:Average daily feed intake; ADG: Average daily gain; BF:Biceps femoris; CP: Crude protein; DM: Dry matter; F/G: Ratio of feed intake to body gain; IMF: Intramuscular fat; LD:Longissimus dorsi; PM:Psoas major.
Competing interests
The authors have declared that no competing interests exist.
Authors’contributions
YYL and XFK carried out the animal experiments and data analysis, and drafted the manuscript. FNL and YLY designed the study and revised the manuscript. GLJ and XX participated in the animal trial. BET, JPD, and XJY helped with data collection and analysis. All authors read and approved the final manuscript.
Acknowledgements
The present work was jointly supported by the National Basic Research Program of China (No. 2012CB124704 and 2013CB127305), and K.C. Wong Education Foundation, Hong Kong.
Author details
1Key Laboratory of Agro-ecological Processes in Subtropical Region, Hunan
Provincial Engineering Research Center of Healthy Livestock and Poultry, and Scientific Observing and Experimental Station of Animal Nutrition and Feed Science in South-Central, Ministry of Agriculture, Institute of Subtropical Agriculture, Chinese Academy of Sciences, Changsha, Hunan 410125, China.
2
Hunan Animal Science and Veterinary Medicine Research Institute, Changsha, Hunan 410131, China.3College of Animal Science and
Technology, Hunan Agricultural University, Changsha, Hunan 410128, China.
4Southern Research and Outreach Center, University of Minnesota, Waseca,
MN 56093, USA.5University of Chinese Academy of Sciences, Beijing 100049, China.
Received: 4 February 2015 Accepted: 21 July 2015
References
1. Dunshea FR, D'Souza DN, Pethick DW, Harper GS, Warner RD. Effects of dietary factors and other metabolic modifiers on quality and nutritional value of meat. Meat Sci. 2005;71(1):8–38.
2. Tan BE, Yin YL, Liu ZQ, Li XG, Xu HJ, Kong XF, et al. Dietary L-arginine supplementation increases muscle gain and reduces body fat mass in growing-finishing pigs. Amino Acids. 2009;37(1):169–75.
3. Kouba M, Sellier P. A review of the factors influencing the development of intermuscular adipose tissue in the growing pig. Meat Sci.
2011;88(2):213–20.
4. Kawaguchi H, Miyoshi N, Miura N, Fujiki M, Horiuchi M, Izumi Y, et al. Microminipig, a non-rodent experimental animal optimized for life science research: Novel atherosclerosis model induced by high fat and cholesterol diet. J Pharmacol Sci. 2011;115(2):115–21.
5. Mei J, Yin Z, Zhang J, Lui KW, Hu S, Peng Z, et al. A mini pig model for visualization of perforator flap by using angiography and MIMICS. Surg Radiol Anat. 2010;32(5):477–84.
6. Liu Y, Chen JY, Shang HT, Liu CE, Wang Y, Niu R, et al. Light microscopic, electron microscopic, and immunohistochemical comparison of bama minipig (sus scrofa domestica) and human skin. Comp Med. 2010;60(2):142–8.
7. Shang HT, Guo KA, Liu Y, Yang JD, Wei H. Constitutive expression of CYP3A mRNA in Bama miniature pig tissues. Gene. 2013;524(2):261–7.
8. Yin YL, Yao K, Liu ZJ, Gong M, Ruan Z, Deng D, et al. Supplementing L-leucine to a low-protein diet increases tissue protein synthesis in weanling pigs. Amino Acids. 2010;39(5):1477–86.
9. National Research Council (NRC). Nutrient requirements of swine. Washington, DC, USA: National Academy Press; 2012.
10. Ministry of Agriculture of the People's Republic of China. Feeding standard of swine (GB, NY/T 65–2004). Beijing, China: China Agriculture Press; 2004. 11. Kong XF, Wu GY, Liao YP, Hou ZP, Liu HJ, Yin FG, et al. Effects of Chinese
herbal ultra-fine powder as a dietary additive on growth performance, serum metabolites and intestinal health in early-weaned piglets. Livest Sci. 2007;108(1–3):272–5.
12. Ministry of Agriculture of the People's Republic of China. Performance measurement technology regulations for Chinese lean pig. Beijing, China: China Standard Press; 1987.
14. Kong XF, Wu GY, Liao YP, Houb ZP, Liu HJ, Yin FG, et al. Dietary supplementation with Chinese herbal ultra-fine powder enhances cellular and humoral immunity in early-weaned piglets. Livest Sci. 2007;108(1–3):94–8.
15. Teye GA, Sheard PR, Whittington FM, Nute GR, Stewart A, Wood JD. Influence of dietary oils and protein level on pork quality. 1. Effects on muscle fatty acid composition, carcass, meat and eating quality. Meat Sci. 2006;73(1):157–65.
16. Hinson RB, Wiegand BR, Ritter MJ, Allee GL, Carr SN. Impact of dietary energy level and ractopamine on growth performance, carcass characteristics, and meat quality of finishing pigs. J Anim Sci. 2011;89(11):3572–9.
17. Suarez-Belloch J, Sanz MA, Joy M, Latorre MA. Impact of increasing dietary energy level during the finishing period on growth performance, pork quality and fatty acid profile in heavy pigs. Meat Sci. 2013;93(4):796–801. 18. Edwards DB, Bates RO, Osburn WN. Evaluation of Duroc- vs. Pietrain-sired
pigs for carcass and meat quality measures. J Anim Sci. 2003;81(8):1895–9. 19. Renaudeau D, Mourot J. A comparison of carcass and meat quality
characteristics of Creole and Large White pigs slaughtered at 90 kg BW. Meat Sci. 2007;76(1):165–71.
20. Suzuki K, Irie M, Kadowaki H, Shibata T, Kumagai M, Nishida A. Genetic parameter estimates of meat quality traits in Duroc pigs selected for average daily gain, longissimus muscle area, backfat thickness, and intramuscular fat content. J Anim Sci. 2005;83(9):2058–65.
21. Rosenvold K, Andersen HJ. Factors of significance, for pork quality - a review. Meat Sci. 2003;64(3):219–37.
22. Gil M, Delday MI, Gispert M, Furnols MFI, Maltin CM, Plastow GS, et al. Relationships between biochemical characteristics and meat quality of
Longissimus thoracisandSemimembranosusmuscles in five porcine lines. Meat Sci. 2008;80(3):927–33.
23. Lefaucheur L, Milan D, Ecolan P, Le Callennec C. Myosin heavy chain composition of different skeletal muscles in Large White and Meishan pigs. J Anim Sci. 2004;82(7):1931–41.
24. Mathis N, Feidt C, Brun-Bellut J. Influence of protein/energy ratio on carcass quality during the growing period of Eurasian perch (Perca fluviatilis). Aquaculture. 2003;217(1–4):453–64.
25. Noakes M, Keogh JB, Foster PR, Clifton PM. Effect of an energy-restricted, high-protein, low-fat diet relative to a conventional high-carbohydrate, low-fat diet on weight loss, body composition, nutritional status, and markers of cardiovascular health in obese women. Am J Clin Nutr. 2005;81(6):1298–306. 26. Millward DJ, Jackson AA. Protein/energy ratios of current diets in developed
and developing countries compared with a safe protein/energy ratio: implications for recommended protein and amino acid intakes. Public Health Nutr. 2004;7(3):387–405.
27. Barea R, Nieto R, Aguilera JF. Effects of the dietary protein content and the feeding level on protein and energy metabolism in Iberian pigs growing from 50 to 100 kg body weight. Animal. 2007;1(3):357–65.
28. Hamill RM, Aslan O, Mullen AM, O'Doherty JV, McBryan J, Morris DG, et al. Transcriptome analysis of porcine M. semimembranosus divergent in intramuscular fat as a consequence of dietary protein restriction. BMC Genomics. 2013;14:14.
29. Wood JD, Nute GR, Richardson RI, Whittington FM, Southwood O, Plastow G, et al. Effects of breed, diet and muscle on fat deposition and eating quality in pigs. Meat Sci. 2004;67(4):651–67.
30. Fortin A, Robertson WM, Tong AKW. The eating quality of Canadian pork and its relationship with intramuscular fat. Meat Sci. 2005;69(2):297–305. 31. Madrid J, Villodre C, Valera L, Orengo J, Martinez S, Lopez MJ, et al. Effect of
crude glycerin on feed manufacturing, growth performance, plasma metabolites, and nutrient digestibility of growing-finishing pigs. J Anim Sci. 2013;91(8):3788–95.
32. Yang H, Fu Y, Chen AG. Relationship between blood biochemical indice and production performance in pigs. Animal science abroad. 2001;1:34–7. 33. Feng L, Peng Y, Wu P, Hu K, Jiang WD, Liu Y, et al. Threonine affects
intestinal function, protein synthesis and gene expression of TOR in Jian Carp (Cyprinus carpiovar. Jian). PLoS One. 2013;8(7), e69974.
34. Koukourakis MI, Giatromanolaki A, Sivridis E, Bougioukas G, Didilis V, Gatter KC, et al. Lactate dehydrogenase-5 (LDH-5) overexpression in non-small-cell lung cancer tissues is linked to tumour hypoxia, angiogenic factor production and poor prognosis. Br J Cancer. 2003;89(5):877–85.
35. Kohn RA, Dinneen MM, Russek-Cohen E. Using blood urea nitrogen to predict nitrogen excretion and efficiency of nitrogen utilization in cattle, sheep, goats, horses, pigs, and rats. J Anim Sci. 2005;83(4):879–89. 36. Lordelo MM, Gaspar AM, Bellego LL, Freire JP. Isoleucine and valine
supplementation of a low-protein corn-wheat-soybean meal-based diet for piglets: growth performance and nitrogen balance. J Anim Sci.
2008;86:2936–41.
37. Urschel KL, Shoveller AK, Uwiera RRE, Pencharz PB, Ball RO. Citrulline is an effective arginine precursor in enterally fed neonatal piglets. J Nutr. 2006;136:1806–13.
38. Hahn JD, Biehl RR, Baker DH. Ideal digestible lysine level for early-finishing and late-finishing swine. J Anim Sci. 1995;73(3):773–84.
39. Andriamihaja M, Davila AM, Eklou-Lawson M, Petit N, Delpal S, Allek F, et al. Colon luminal content and epithelial cell morphology are markedly modified in rats fed with a high-protein diet. Am J Physiol-Gastroint Liver Physiol. 2010;299(5):G1030–7.
40. Mouille B, Robert V, Blachier F. Adaptative increase of ornithine production and decrease of ammonia metabolism in rat colonocytes after hyperproteic diet ingestion. Am J Physiol-Gastroint Liver Physiol. 2004;287(2):G344–51.
Submit your next manuscript to BioMed Central and take full advantage of:
• Convenient online submission
• Thorough peer review
• No space constraints or color figure charges
• Immediate publication on acceptance
• Inclusion in PubMed, CAS, Scopus and Google Scholar
• Research which is freely available for redistribution