R E S E A R C H
Open Access
New regression equations for predicting human
teeth sizes
Vanessa Paredes
1, Beatriz Tarazona
1*, Natalia Zamora
1, Rosa Cibrian
2and Jose Luis Gandia
1Abstract
Introduction:The aims of the study were; to evaluate the applicability of the Moyers and Tanaka-Johnston Methods to individuals with a Spanish ancestry, to propose new regression equations using the lower four permanents incisors as predictors for the sum of the widths of the lower permanent canine and premolars, and to compare the new data to those from other populations.
Methods:A total of 359 Spanish ancestry adolescents were selected. Their dental casts were measured using a 2D computerized system. Real teeth measurements were compared with those predicted using Moyers probability tables and Tanaka and Johnston equations, and standard regression equations were then developed.
Results:Results showed that Upper and Lower Canine and Premolar (UCPM, LCPM) predictions are quite different depending on the used method. Moyers tables can only be validly applied to a 75% percentile for the mandible in both, males and females, 85% in males and 90-92% in females.
Conclusions:Moyers predictions tend to underestimate UCPM and LCPM whereas Tanaka-Johnston predictions tend to overestimate them. Equations for estimating the combined width of the unerupted canine and premolars were; Male: UCPM = 12.68 + 0.42 LI and LCPM = 11.71 + 0.44 LI. Female: UCPM = 12.06 + 0.43LI and LCPM = 10.71 + 0.46 LI.
Keywords:Moyers, Prediction, Regression equations, Tanaka-Johnston
Introduction
Predicting unerupted tooth size of Upper and Lower Canine and Premolars (UCPM, LCPM) in mixed denti-tion is important for a good diagnosis and for choosing a therapy [1]. To date, three basic groups have been used to determine the mesiodistal widths of unerupted canines and premolars.
1- Analyses based on correlation and regression equa-tions, expressed as prediction tables. Both Moyers’ regression scheme [2] and Tanaka and Johnston’s equa-tions [3] have achieved widespread clinical acceptance because of their simplicity and ease of application. 2- Ana-lyses based on measurements taken from radiographs [4,5] of unerupted teeth. 3- Analyses based on a combin-ation of correlcombin-ations and regression equcombin-ations and mea-surements on radiographs [6-8].
However, bearing in mind that these prediction methods are based on individuals of North American ancestry, it is not appropriate to use them on different populations of different biological origin. For this reason, several linear regression equations have been proposed for different populations [9-23].
Odontometric data from Spanish ancestry children are not so widely available and, to date, there is no study in the literature examining the accuracy of Moyers prob-ability tables and Tanaka and Johnston equations in pre-dicting the size of unerupted canines and premolars in a Spanish ancestry sample. The aims of the present study were, therefore, to evaluate the applicability of the Moyers and Tanaka-Johnston methods to Spanish ances-try individuals; to propose new regression equations using the lower four permanent incisors as predictors of the sum of the widths of the lower and upper permanent canine and premolars; and to compare the new data with those of other populations.
* Correspondence:[email protected] 1
Orthodontics Department, Faculty of Dentistry and Medicine, University of Valencia, Gasco Oliag nº1, 46010 Valencia, Spain
Full list of author information is available at the end of the article
Material and methods
500 patients attending the Orthodontics Department of the University of Valencia, Spain were chosen. Subjects presented to the orthodontic clinic in sequential order over a fixed period of time (January 2010-January 2012). A retrospective study was carried out and approved by the Ethics Committee of Research into Humans of the Experimental Research Ethics Committee at Valencia University, Spain. Reference number H1373014083626. All patients whose records were used in this work re-ceived detailed information about the study, reflected on an informed consent. There was also a confidentiality agreement stating that patients’ personal data and their records would only be used for scientific purposes.
In order to predict unerupted teeth sizes under the best conditions, patient selection criteria were:
Permanent dentition from first molar to first molar. Lower and upper first molar totally erupted and
without the gingiva overlapping the distal surface of the tooth.
Good quality casts.
No tooth agenesis or extractions. No previous orthodontic treatment.
No restorations or teeth with anomalous shapes that could change the mesiodistal diameter of the tooth or bruxism.
Spanish ancestors from at least 1 previous generation (Spanish means people living in Spain, Europe with at least 1 previous generation of Spanish ancestors). Class I relationship with no arch discrepancy.
The Spanish ancestry sample finally included 359 pa-tients (169 = 47.1% males and 190 = 52.9% females), with a mean age of 14.8 years (range 11.2-19.2) similar for both sex.
The power analysis showed that 359 patients were needed to achieve 90% power to detect clinically mean-ingful differences of the values. To compensate for possible dropouts during the study, more patients were we enrolled.
All the study casts were digitized with a conventional scanner and calibrated before any measurement was taken, using a simple method. In this calibration system, dental casts were surrounded by millimeter paper sheet. When the arches have been digitized, the magnification of the millimeter paper in the two axes is known and the dental cast magnification can be calculated [24]. A 2D digital software program designed by the University of Valencia, previously tested and found to be accurate and reliable [16], was used to determine dental sizes (in millimeters) of the lower four permanent incisors. With the aid of the mouse as a user interface, mesiodistal size of each permanent tooth on the image of the casts was
marked. The software determines dental sizes in milli-meters automatically.
The Tanaka and Johnston [3] equations used are as follow;
1=2MD Lower Incisors LIð Þwidthþ10:5mm
¼Estimated LCPM width1=2MD Lower Incisors LIð Þwidth
þ11:0mm¼Estimated UCPM width
Statistical analysis
All statistical analyses were performed using the SPSS© Vs. 10.0 Inc 1989–1999 Copyright, statistics package for Windows.
The descriptive analysis provides the relevant statistics for primary analysis variables: the mesiodistal sizes of the lower incisors (LI), the upper canine-premolars (UCPM) and lower canine-premolars (LCPM). The two latter ones are calculated as a mean of those recorded on both sides of each arch.
To evaluate the predictive power of the Moyers table, differences were calculated between the real values of those parameters (UCPM, LCPM) in the sample and those predicted by tables for percentiles in accordance with LI values. Likewise, the differences between the real values of the UCPM, LCPM and the values predicted by the Tanaka-Johnston [3] formula were calculated. For all of them, basic descriptive statistics and confidence levels of 95% are provided. All the mentioned information is segmented by sex, as sexual dimorphism is a key aspect of this investigation.
Regarding the inferential analysis undertaken, unpaired Student t-tests were applied to compare the mean equal-ity hypothesis of UCPM and LCPM in males and females. The Student t-test for paired samples was ap-plied to reach a conclusion over the equality of real mean values and estimated values, whether those of the Moyers’ tables [2] or the Tanaka-Johnston equation [3]. Assumptions regarding normality of parameters and homogeneity of variances were checked by means of Kolmogorov-Smirnov and Levene´s test respectively.
of x. Hypothesis of normality; homoscedasticity and no autocorrelation of residuals were checked. Re-estimation of equations was carried up in 75% of the sample in order to check its acceptance at an independent sample (25% remaining).
Results
The reproducibility of the digital method was analysed by determining intra- and inter-examiner measurement
errors, calculated by coefficients of variation (CVs = stand-ard deviation- 100/mean) expressed as a percentage. Twenty dental casts from the present study were ran-domly selected. The measurements of the twenty dental casts were again determined by the same examiner (VP) (intra-examiner error) and by two different examiners (RC and JLG) (inter-examiner error) in order to obtain the CV. All CVs were very low (below 5.8 per cent) and similar be-tween examiners. Digital methods CVs were 0.05 – 2.88 Table 1 Mesiodistal Lower Incisor (LI), Upper Canine and Premolar (UCPM) and Lower Canine and Premolar (LCPM) tooth sizes per sex
N Mean ± SD(mm) Minimum Maximum S. Error CI 95% P value
LI Sex T 359 23.04 ± 1.45 17.77 26.39 .08 22.89–23.19
M 169 23.04 ± 1.46 17.77 26.39 .11 22.82–23.26 n.s.
F 190 23.03 ± 1.44 19.39 26.11 .10 22.83–23.24
UCPM T 359 22.11 ± 1.07 19.49 25.49 .06 21.99–22.22
M 169 22.31 ± 1.06 19.68 25.25 .08 22.15–22.47 **
F 190 21.92 ± 1.04 19.49 25.49 .08 21.77–22.07
LCPM T 359 21.60 ± 1.12 18.37 24.62 .06 21.48–21.71
M 169 21.82 ± 1.11 19.35 24.62 .09 21.65–21.99 **
F 190 21.40 ± 1.09 18.37 24.47 .08 21.25–21.56
t-Test of independent samples for assessing homogeneity of measurements per sex. n.s = notsignificant; ** = p < 0.01. Male + Female(Total); Male(M) and Female(F).
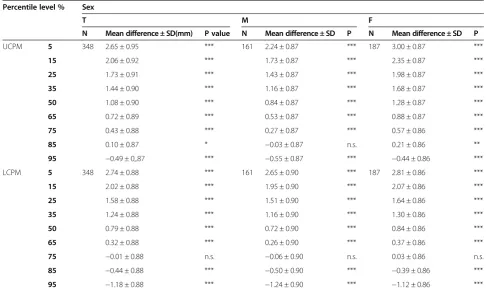
Table 2 The difference(mm) between the mean values of real Upper and Lower Canine and Premolar (UCPM, LCPM) tooth sizes and those predicted from Moyers’charts per sex
Percentile level % Sex
T M F
N Mean difference ± SD(mm) P value N Mean difference ± SD P N Mean difference ± SD P
UCPM 5 348 2.65 ± 0.95 *** 161 2.24 ± 0.87 *** 187 3.00 ± 0.87 ***
15 2.06 ± 0.92 *** 1.73 ± 0.87 *** 2.35 ± 0.87 ***
25 1.73 ± 0.91 *** 1.43 ± 0.87 *** 1.98 ± 0.87 ***
35 1.44 ± 0.90 *** 1.16 ± 0.87 *** 1.68 ± 0.87 ***
50 1.08 ± 0.90 *** 0.84 ± 0.87 *** 1.28 ± 0.87 ***
65 0.72 ± 0.89 *** 0.53 ± 0.87 *** 0.88 ± 0.87 ***
75 0.43 ± 0.88 *** 0.27 ± 0.87 *** 0.57 ± 0.86 ***
85 0.10 ± 0.87 * −0.03 ± 0.87 n.s. 0.21 ± 0.86 **
95 −0.49 ± 0,.87 *** −0.55 ± 0.87 *** −0.44 ± 0.86 ***
LCPM 5 348 2.74 ± 0.88 *** 161 2.65 ± 0.90 *** 187 2.81 ± 0.86 ***
15 2.02 ± 0.88 *** 1.95 ± 0.90 *** 2.07 ± 0.86 ***
25 1.58 ± 0.88 *** 1.51 ± 0.90 *** 1.64 ± 0.86 ***
35 1.24 ± 0.88 *** 1.16 ± 0.90 *** 1.30 ± 0.86 ***
50 0.79 ± 0.88 *** 0.72 ± 0.90 *** 0.84 ± 0.86 ***
65 0.32 ± 0.88 *** 0.26 ± 0.90 *** 0.37 ± 0.86 ***
75 −0.01 ± 0.88 n.s. −0.06 ± 0.90 n.s. 0.03 ± 0.86 n.s.
85 −0.44 ± 0.88 *** −0.50 ± 0.90 *** −0.39 ± 0.86 ***
95 −1.18 ± 0.88 *** −1.24 ± 0.90 *** −1.12 ± 0.86 ***
and 0.16–5.70 per cent for intra- and inter-examiner cali-brations, respectively.
Since right and left side values are highly correlated (and non-independent) within individuals, mean of right and left side values was chosen in these statistical com-parisons. Table 1 presents descriptive information on LI, UCPM and LCPM, sizes segmented by sex.
The first method used for prediction was Moyers’ tables. Table 2 provides the descriptive statistics for the difference in mm between the real values and those estimated by Moyers for the UCPM and LCPM, for the different percentile levels. For this analysis, those indi-viduals whose LI values were either below or above the Moyers’ limits (1 and 10 respectively) were excluded, a margin of 0.25 mm. being accepted. Hence the effective sample in this section consisted of 348 cases. Moyers’ values systematically tend to underestimate the real values in the Spanish population.
The second method used was Tanaka-Johnston regres-sion equations. For that, the difference between the real value and the predicted value was calculated using these equations for the UCPM and LCPM sizes (Table 3). In contrast to Moyers’tables, these equations tend to over-estimate the real values of the UCPM and LCPM sizes in the Spanish population. Thirdly, estimation from an own regression equation was proposed. Table 4 summa-rises the results of the 6 regression models undertaken: total maxilla, male maxilla, female maxilla, total mandible, male mandible and female mandible. The equations for
estimating the combined width of the unerupted canine and premolars were:
Males:UCPM¼12:68þ0:42LI and LCPM
¼11:71þ0:44LI
Females:UCPM¼12:06þ0:43LI and LCPM
¼10:71þ0:46LI
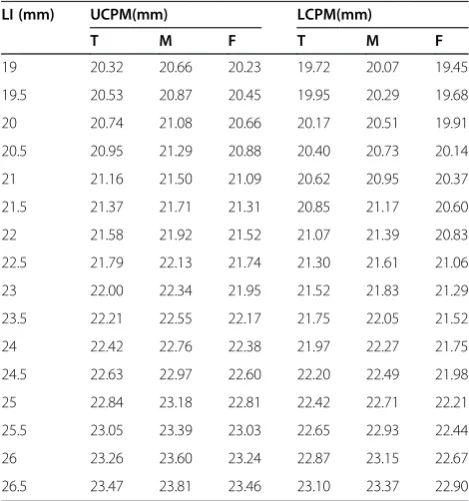
These regression equations allow the construction of a basic table of predictions to be constructed according to arch and sex, as showed in Table 5.
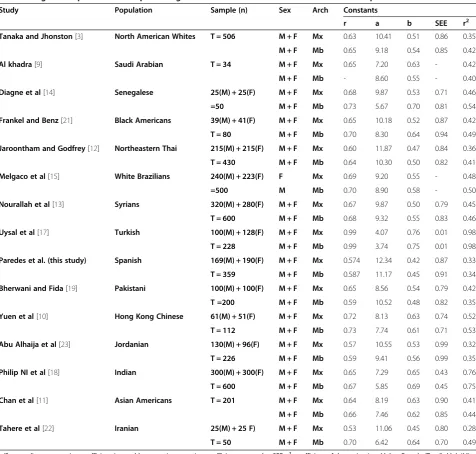
Table 6 presents a comparison of regression constants among different populations including the own sample.
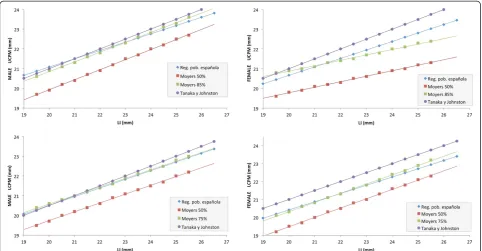
Finally, in Figure 1, predictions of the three methods are compared; estimated regression lines, Moyers tables at 50% and at 85%, and the Tanaka-Johnston Rule. Table 3 The difference (mm) between the mean values of real Upper and Lower Canine and Premolar(UCPM, LCPM) tooth sizes and those predicted from Tanaka-Johnston’s equations per sex
Sex
T M F
N Mean difference ± SD(mm) P N Mean ± SD P N Mean ± SD P
UCPM 359 −0.41 ± 0.88 *** 169 −0.21 ± 0.88 ** 190 −0.59 ± 0.85 ***
LCPM −0.42 ± 0.91 *** −0.20 ± 0.91 ** −0.61 ± 0.86 ***
t-Test of dependent samples for assessing homogeneity of measurements between the realand predicted values of the sample. n.s = not significant; ** = p < 0.01; *** = p < 0.001.Male + Female(Total); Male(M) and Female(F).
Table 4 Regression parameters for predictions of UCPM and LCPM tooth sizes in each arch and per sex
Constants
r a b SEE r2
UCPM T 0.574 12.34*** 0.42*** 0.87 0.330
Sex M 0.574 12.68*** 0.42*** 0.87 0.330
F 0.592 12.06*** 0.43*** 0.84 0.351
LCPM T 0.587 11.17*** 0.45*** 0.91 0.345
Sex M 0.577 11.71*** 0.44*** 0.91 0.333
F 0.616 10.71*** 0.46*** 0.86 0.379
r (Pearson linear regression coefficients); a and b, regression equation coefficients y = a + bx; SEE (standard error of estimate); r2, coefficient of determination. n.s. not significant;*** p < 0.001. Male + Female(Total); Male(M) and Female(F).
Table 5 Prediction table for the Spanish population based on regression equations
LI (mm) UCPM(mm) LCPM(mm)
T M F T M F
19 20.32 20.66 20.23 19.72 20.07 19.45
19.5 20.53 20.87 20.45 19.95 20.29 19.68
20 20.74 21.08 20.66 20.17 20.51 19.91
20.5 20.95 21.29 20.88 20.40 20.73 20.14
21 21.16 21.50 21.09 20.62 20.95 20.37
21.5 21.37 21.71 21.31 20.85 21.17 20.60
22 21.58 21.92 21.52 21.07 21.39 20.83
22.5 21.79 22.13 21.74 21.30 21.61 21.06
23 22.00 22.34 21.95 21.52 21.83 21.29
23.5 22.21 22.55 22.17 21.75 22.05 21.52
24 22.42 22.76 22.38 21.97 22.27 21.75
24.5 22.63 22.97 22.60 22.20 22.49 21.98
25 22.84 23.18 22.81 22.42 22.71 22.21
25.5 23.05 23.39 23.03 22.65 22.93 22.44
26 23.26 23.60 23.24 22.87 23.15 22.67
26.5 23.47 23.81 23.46 23.10 23.37 22.90
Discussion
No statistically significant differences between males and females were found for LI mesiodistal size, unlike those of UCPM and LCPM, where males presented statistically higher mesiodistal sizes than females. These results for the LI agree with studies published on Chinese [10] and Indian [18] populations, but are contrary to studies on Brazilian [15], Pakistani [19], Turkish [17] or Thai [12] populations, where statistically significant differences were found in LI sizes, as well as in UCPM and LCPM sizes.
Moyers Tables [2] are classified from the 95th to 5th prediction level. The most practical level from the
clinical point of view is the 75th level, although in theory the 50th level of probability should be used, as any error will be evenly distributed in either direction.
Taking the prediction of upper arch at total level into account, as showed in Table 2, all differences are positive, indicating that the Moyer’s Tables tend to underestimate the real values of the UCPM in the sample of Spanish individuals, apart from for the 95% level. Practically, statistically significant differences were found at all confidence levels apart from those for males at the 85% confidence level, where no statistically significant difference was found and thus, homogeneity can be accepted. In females, homogeneity Table 6 Regression parameters for predicting UCPM and LCPM tooth sizes in each arch and per sex
Study Population Sample (n) Sex Arch Constants
r a b SEE r2
Tanaka and Jhonston[3] North American Whites T = 506 M + F Mx 0.63 10.41 0.51 0.86 0.35
M + F Mb 0.65 9.18 0.54 0.85 0.42
Al khadra[9] Saudi Arabian T = 34 M + F Mx 0.65 7.20 0.63 - 0.42
M + F Mb - 8.60 0.55 - 0.40
Diagne et al[14] Senegalese 25(M) + 25(F) M + F Mx 0.68 9.87 0.53 0.71 0.46
=50 M + F Mb 0.73 5.67 0.70 0.81 0.54
Frankel and Benz[21] Black Americans 39(M) + 41(F) M + F Mx 0.65 10.18 0.52 0.87 0.42
T = 80 M + F Mb 0.70 8.30 0.64 0.94 0.49
Jaroontham and Godfrey[12] Northeastern Thai 215(M) + 215(F) M + F Mx 0.60 11.87 0.47 0.84 0.36
T = 430 M + F Mb 0.64 10.30 0.50 0.82 0.41
Melgaco et al[15] White Brazilians 240(M) + 223(F) F Mx 0.69 9.20 0.55 - 0.48
=500 M Mb 0.70 8.90 0.58 - 0.50
Nourallah et al[13] Syrians 320(M) + 280(F) M + F Mx 0.67 9.87 0.50 0.79 0.45
T = 600 M + F Mb 0.68 9.32 0.55 0.83 0.46
Uysal et al[17] Turkish 100(M) + 128(F) M + F Mx 0.99 4.07 0.76 0.01 0.98
T = 228 M + F Mb 0.99 3.74 0.75 0.01 0.98
Paredes et al. (this study) Spanish 169(M) + 190(F) M + F Mx 0.574 12.34 0.42 0.87 0.330
T = 359 M + F Mb 0.587 11.17 0.45 0.91 0.345
Bherwani and Fida[19] Pakistani 100(M) + 100(F) M + F Mx 0.65 8.56 0.54 0.79 0.42
T =200 M + F Mb 0.59 10.52 0.48 0.82 0.35
Yuen et al[10] Hong Kong Chinese 61(M) + 51(F) M + F Mx 0.72 8.13 0.63 0.74 0.52
T = 112 M + F Mb 0.73 7.74 0.61 0.71 0.53
Abu Alhaija et al[23] Jordanian 130(M) + 96(F) M + F Mx 0.57 10.55 0.53 0.99 0.32
T = 226 M + F Mb 0.59 9.41 0.56 0.99 0.35
Philip NI et al[18] Indian 300(M) + 300(F) M + F Mx 0.65 7.29 0.65 0.43 0.76
T = 600 M + F Mb 0.67 5.85 0.69 0.45 0.75
Chan et al[11] Asian Americans T = 201 M + F Mx 0.64 8.19 0.63 0.90 0.41
M + F Mb 0.66 7.46 0.62 0.85 0.44
Tahere et al[22] Iranian 25(M) + 25 F) M + F Mx 0.53 11.06 0.45 0.80 0.28
T = 50 M + F Mb 0.70 6.42 0.64 0.70 0.49
r (Pearson linear regression coefficients); a and b, regression equation coefficients y = a + bx; SEE, r2
may be verified for a slightly higher percentile of around 90%.
Regarding the lower arch, the applicability of Moyer’s [2] tables is only useful for the 75th percentile, both at total level and for each sex where no statistically signifi-cant differences were found, contrary to all the other levels evaluated. Generally speaking, it can be stated that Moyer’s values systematically tend to underestimate real values in the Spanish population. These results coincide with studies in a Brazilian population [15] at the 50th and 75th percentile levels and in a Jordanian population [23] except for the 65th and 75th percentile for female subjects and the 85th for male subjects, in a Pakistani population [19] and for South Indian children [18]. On the other hand, Saudi Arabian population [9] studies found that the recommended 75th percentile overesti-mated the mesiodistal sizes of canine and premolars.
Estimates obtained from the Tanaka-Johnston equation [3] produced several equally disputable results as both at the mandible and maxilla level, in both males and females, the predictions tended to overestimate the real UCPM and LCPM sizes of individuals, with all the discrepancies found being statistically significant. These results coincide with those of other authors on Iranian [22] and Pakistani [19] populations, whereas they differ from those on a Jordanian population [23], where the regression equations underestimated the real teeth value. Finally, as it can be observed, adjustment for regression presents quite similar accuracy regardless of the arch and
sex of patients, even though it tends to be slightly greater among females, as showed in other studies.
Pearson’s linear correlation coefficient (r) ranges from between 0.57 and 0.61 depending on combinations. Therefore, the proportion of total variance of the UCPM or LCPM variable explained by the LI, ranges from be-tween 33.3% and 37.9%. SSE denotes the standard error in the predictions that were obtained with the corre-sponding regression equation. This fluctuates in the range of 0.84-0.91. The above mentioned equations pre-sented a degree of accuracy similar to studies performed on Saudi-Arabians [9], Hong Kong Chinese [10], Asian Americans [11], North-Eastern Thais [12], Syrians [13], Senegalese [14], white Brazilians [15], Indian [18], Pakistani [19], black Americans [21], Iranian [22] and Jordanian [23] individuals, but lower than for the Turkish population [17] as can be seen in Table 6. The reason may lie in a greater dispersion of the CPM spaces belonging to the dental morphology of the individuals of the studied group. Likewise, it can be observed that the mandibular arch obtained higher“r”values than the maxillar in almost all of the studied populations. However, the validity of some data can be questioned due to the sample sizes of some studies.
estimated by Moyer’s [2] at 85% and by Tanaka-Johnston [3]. However, from 24 mm upwards the trend is re-versed. In contrast, predictions for females present a clearly different pattern from those of males. With the exception of the lowest LI values, the predictions ob-tained with the regression model are situated at an inter-mediate level between the underestimate of Moyers [2] at 85% and the overestimate of Tanaka and Johnston [3].
For predictions of LCPM in males, the different methods present similar estimation lines to those of the UCPM. For predictions of LCPM in females, the graphic is again very similar to that of the UCPM, with the exception of the Moyers predictions at 75% that graphically present a very homogenous line to that of the regression line drawn up for the Spanish popula-tion. It can also be observed in the four graphics that Tanaka-Johnston method tends to overestimate more than other methods, UCPM and LCPM values.
Teeth size differ among people of various biological origins, tooth sizes differ. Some of the most used methods to predict the size of unerupted posterior permanent teeth were developed for North Americans ancestry, so the ap-plicability and the effectiveness of these methods in others populations are inadequate, hence the need to draw up ta-bles for each population.
Conclusions
The conclusions of the study are:
1. Predictions of UCPM and LCPM sizes from LI for the Spanish ancestry population are evaluated quite differently depending on the used method.
2. Moyer’s tables tend to underestimate UCPM and LCPM in Spanish ancestry subjects, only being of use at the 75% level percentile for the mandible, both in males and females, and for the maxilla at the 85% and 90% level percentile for males and females respectively.
3. Estimates obtained from the Tanaka-Johnston equation tend to overestimate UCPM and LCPM sizes in Spanish ancestry subjects.
4. The equations for estimating the combined width of the unerupted canine and premolars are:
Males:UCPM¼12:68þ0:42LI and LCPM ¼11:71þ0:44LI
Females:UCPM¼12:06þ0:43LI and LCPM ¼10:71þ0:46LI
Competing interests
All other authors declare that they have no competing interests.
Authors’contributions
All authors contributed extensively to the work presented in this paper. JLG provided the idea for the project. VP and BT treated the patients
orthodontically and contributed to the writing. NZ recruited the participants, collected the data, and compiled all medical records and RC carried out the statistical analyses. All authors approved the manuscript prior to submission.
Author details
1
Orthodontics Department, Faculty of Dentistry and Medicine, University of Valencia, Gasco Oliag nº1, 46010 Valencia, Spain.2Physiology Department, Faculty of Medicine and Dentistry, University of Valencia, Spain, Valencia, Spain.
Received: 16 November 2014 Accepted: 3 March 2015
References
1. Irwin RD, Herold JS, Richardson A. Mixed dentition analysis: a review of methods and their accuracy. Int J Pediatr Dent. 1995;5:137–42. 2. Moyers RE. Handbook of Orthodontics. 3rd ed. Chicago, IL: Mosby Year
Book; 1973. p. 230–40.
3. Tanaka MM, Johnston LE. The prediction of the size of unerupted canines and premolars in a contemporary orthodontic population. J Am Dent Assoc. 1974;88:798–801.
4. Nance HN. The limitation of Orthodontic treatment I. Mixed dentition diagnosis and treatment. Am J Orthod Oral Surg. 1947;33:177–233. 5. De Paula S, Almeida de Oliveira MA, Lee PCF. Prediction of mesiodistal
diameter of unerupted lower canines and premolars using 45° cephalometric radiography. Am J Orthod Dentofacial Orthop. 1995;107:309–14.
6. Hixon EH, Oldfather RE. Estimation of the sizes of unerupted cuspid and bicuspid teeth. Angle Orthod. 1958;28:236–40.
7. Bishara SE, Staley RN. Mixed dentition mandibular arch analysis. Am J Orthod. 1984;86:130–5.
8. Staley RN, Kerber RE. A review of the Hixon and Oldfather mixed dentition prediction Method. Am J Orthod Dentofacial Orthop. 1980;78:296–302. 9. Al-Khadra BH. Prediction of the size of unerupted canines and premolars
in a Saudi Arab population. Am J Orthod Dentofacial Orthop. 1993;104:369–72.
10. Yuen KK, Tang EL, So LL. Mixed dentition analysis for Hong-Kong Chinese. Angle Orthod. 1998;68:21–8.
11. Lee-Chan S, Jacobson BN, Chwa KH, Jacobson RS. Mixed dentition analysis for Asian Americans. Am J Orthod Dentofacial Orthop. 1998;113:293–9. 12. Jaroontham J, Godfrey K. Mixed dentition space analysis in a Thai
population. Eur J Orthod. 2000;22:127–34.
13. Nourallah AW, Gesch D, Khordaji MN, Splieth C. New regressions equations for predicting the size of unerupted canines and premolars in a contemporary population. Angle Orthod. 2002;72:216–21.
14. Diagne F, Diop-Ba K, Ngom PI, Mbow K. Mixed dentition analysis in Senegalese population: elaboration of prediction tables. Am J Orthod Dentofacial Orthop. 2003;124:178–83.
15. Melgaço CA, Araújo MT, Ruellas AC. Applicability of three tooth size prediction methods for white Brazilians. Angle Orthod. 2006;76:644–9. 16. Paredes V, Gandia JL, Cibrian R. A new, accurate and fast digital method to
predict unerupted tooth size. Angle Orthod. 2006;76:14–9.
17. Uysal T, Bascifici FA, Goyenc Y. New regression equations for mixed-dentition arch analysis in a Turkish sample with no Bolton tooth-size discrepancy. Am J Orthod Dentofacial Orthop. 2009;135:343–8.
18. Philip NI, Prabhakar M, Arora D, Chopra S. Applicability of the Moyers mixed dentition probability tables and new prediction aids for a contemporary population in India. Am J Orthod Dentofacial Orthop. 2010;138:339–45.
19. Bherwani AK, Fida M. Development of a prediction equation for the mixed dentition in a Pakistani sample. Am J Orthod Dentofacial Orthop. 2011;14:626–32.
20. Paredes V, Williams FD, Cibrian R, Williams FE, Meneses A, Gandia JL. Mesiodistal sizes and intermaxillary tooth-size ratios of two populations; Spanish and Peruvian. A comparative study. Med Oral Patol Oral Cir Bucal. 2011;16:e593–9.
21. Frankel HH, Benz EM. Mixed dentition analysis for black Americans. Pediatr Dent. 1986;8:226–30.
23. Abu Alhaija ES, Qudeimat MA. Mixed dentition space analysis in a Jordanian population: comparison of two methods. Int J Paediatr Dent.
2006;16:104–10.
24. Paredes V, Gandia JL, Cibrian R. New, fast, and accurate procedure to calibrate a 2-dimensional digital measurement method. Am J Orthod Dentofacial Orthop. 2005;127:518–9.
Submit your next manuscript to BioMed Central and take full advantage of:
• Convenient online submission
• Thorough peer review
• No space constraints or color figure charges
• Immediate publication on acceptance
• Inclusion in PubMed, CAS, Scopus and Google Scholar
• Research which is freely available for redistribution