RESEARCH
Association of glucose and blood pressure
variability on oxidative stress in patients
with type 2 diabetes mellitus and hypertension:
a cross-sectional study
Makoto Ohara
*, Yo Kohata, Hiroe Nagaike, Masakazu Koshibu, Hiroya Gima, Munenori Hiromura,
Takeshi Yamamoto, Yusaku Mori, Toshiyuki Hayashi, Tomoyasu Fukui and Tsutomu Hirano
Abstract
Background: The present study evaluated the effects of glucose and blood pressure (BP) variability on oxidative stress in patients with type 2 diabetes mellitus (T2DM) and hypertension.
Methods: A total of 60 inpatients with T2DM underwent continuous glucose monitoring (CGM) and ambulatory BP monitoring (ABPM). Oxidative stress was estimated using the diacron-reactive oxygen metabolites (d-ROMs) test. Glucose variability, mean glucose level, percentage coefficient of variation for glucose, mean amplitude of glycemic excursions (MAGE), and area under the postprandial plasma glucose curve were determined through CGM. BP vari-ability was assessed by measuring average BP, standard deviation (SD) of systolic and diastolic BP, and coefficient of variation (CV) of systolic and diastolic BP during daytime and nighttime ABPM.
Results: Participants had a mean age of 64.5 ± 13.3 years with the duration of the disease 13.9 ± 12.4 years and HbA1c of 8.5 ± 1.2%. Univariate analysis showed that MAGE, nighttime SDs of systolic and diastolic BP, and nighttime CV of systolic BP were significantly correlated with d-ROMs. Further, stepwise multiple regression analysis identified MAGE, nighttime SD and CV of diastolic BP, estimated glomerular filtration rate, and smoking as independent con-tributors to d-ROMs.
Conclusions: Oxidative stress was associated with daily glucose and nighttime diastolic BP variability in patients with T2DM and hypertension.
Trial registration UMIN Clinical Trial Registry UMIN000035615, Registered January 22, 2019—retrospectively registered Keywords: Glucose variability, Blood pressure variability, Continuous glucose monitoring, Ambulatory blood pressure monitoring, Oxidative stress, Type 2 diabetes mellitus
© The Author(s) 2019. This article is distributed under the terms of the Creative Commons Attribution 4.0 International License (http://creat iveco mmons .org/licen ses/by/4.0/), which permits unrestricted use, distribution, and reproduction in any medium, provided you give appropriate credit to the original author(s) and the source, provide a link to the Creative Commons license, and indicate if changes were made. The Creative Commons Public Domain Dedication waiver (http://creat iveco mmons .org/ publi cdoma in/zero/1.0/) applies to the data made available in this article, unless otherwise stated.
Background
The coexistence of diabetes and hypertension, which is considered as highly likely, has been associated with increased risk for death, cardiovascular events, and progression of microvascular complications, such as nephropathy and retinopathy [1, 2]. In some studies,
intensified intervention aimed at multiple risk factors has been shown to have beneficial effects with respect to macro and microvascular complications in patients with type 2 diabetes mellitus (T2DM) [3, 4]. In addition to chronic hyperglycemia and hypertension, recent studies have reported that not only visit-to-visit glucose variabil-ity but also visit-to-visit blood pressure (BP) variabilvariabil-ity is related to macro and microvascular complications in patients with T2DM [5, 6].
Oxidative stress plays an important role in the devel-opment and progression of diabetic complications [7].
Open Access
*Correspondence: s6018@nms.ac.jp
Hyperglycemic damage results from reactive oxygen species-induced activation of polyol, hexosamine, protein kinase C, and the advanced glycation end-product path-way [8]. Given that atherosclerosis can result from glu-cose variability-induced endothelial dysfunction through oxidative stress, the activation of oxidative stress could be a risk factor for diabetic complications [9]. Hypertension also induces endothelial dysfunction through oxidative stress [10]. Accordingly, angiotensin II has been reported to stimulate the production of reactive oxygen species, such as superoxide, through the activation of membrane-bound NADH or NADPH oxidase in hypertension [11, 12]. In addition, nitric oxide inactivation by oxygen free radicals contributes to endothelial dysfunction in essen-tial hypertension [13].
Short- and long-term variability has been observed for glucose and BP levels. Given the advances in medi-cal technology, such as continuous glucose monitoring (CGM) and 24 h ambulatory blood pressure monitor-ing (ABPM), short-term glucose and BP variability can be detected in greater detail. Although long-term glu-cose variability has been associated with oxidative stress in patients with T2DM [14], cross-sectional and inter-ventional studies have also found a correlation between short-term glucose variability and oxidative stress in patients with T2DM [15–17]. However, only a few reports have investigated the association between oxida-tive stress and BP variability in patients with T2DM and hypertension.
Therefore, the present study aimed to determine whether glucose and BP variability measured using CGM and ABPM, respectively, was associated with dia-cron-reactive oxygen metabolites (d-ROMs), a surrogate marker of oxidative stress in patients with T2DM [16, 17].
Methods
Study subjects
We performed a cross-sectional study, including 60 inpa-tients with T2DM and hypertension, who were treated at Showa University Hospital from June 2015 to January 2018. Reasons for hospital admission were to achieve glycemic control because of poor control or to evalu-ate glucose and BP variabilities. The inclusion criteria
were as follows: a diagnosis of T2DM and sion, age > 20 years, and stable diabetes and hyperten-sion treatment for ≥ 3 months before study. T2DM was defined according to the Japan Diabetes Society [18]. Hypertension was defined as a systolic blood pres-sure (SBP) ≥ 140 mmHg and/or diastolic blood pressure (DBP) ≥ 90 mmHg on at least two occasions according to current guidelines [19] or a previous diagnosis of hyper-tension with antihypertensive medication. The exclusion criteria were as follows: use of steroids or anti-inflamma-tory drugs, diabetic ketosis and coma within 3 months before the study, severe infection, severe trauma, malig-nancy, an estimated glomerular filtration rate (eGFR) of < 30 mL/min/1.73 m2 according to the Cockcroft–Gault formula, pre- and post-surgery, severe liver dysfunction, pregnancy, and secondary hypertension.
Study design
The study protocol is summarized in Fig. 1. This was a cross-sectional analysis of patients with T2DM who underwent a 72 h period of CGM and a 24 h period of ABPM. Clinical and laboratory parameters, including body mass index (BMI), fasting plasma glucose (FPG), HbA1c, eGFR, low-density lipoprotein cholesterol (LDL-C), high-density lipoprotein cholesterol (HDL-(LDL-C), and triglycerides (TG), were measured before breakfast on day 4. Plasma oxidant capacity against N,N-diethyl para-phenylenediamine was also measured using the d-ROMs test on day 4. Clinical data (age, sex, smoking status, dura-tion of diabetes, diabetes therapy, and antihypertensive and lipid-lowering drugs) were retrieved from medicals records. Parameters of glucose variability, such as mean glucose level (MGL), percentage coefficient of variation for glucose (%CV), mean amplitude of glycemic excur-sions (MAGE), and area under the postprandial plasma glucose curve (AUC PP), were measured on days 2 and 3. Parameters of BP variability, such as average (AV) BP, standard deviation (SD) of BP, and coefficient of variation for blood pressure (CV) were measured for 24 h begin-ning on day 2. All patients continued their original treat-ment during CGM and ABPM. The study protocol was approved by the Ethics Committee of the Showa Univer-sity School of Medicine. Informed consent was obtained from all subjects after receiving a clear explanation of the
Day 1 Day 2 Day 3 Day 4
Blood and urine tests (including d-ROMs) Admission to hospital
CGM period (72 h)
ABPM period (24 h)
study protocol. The study was designed in compliance with the Declaration of Helsinki. The present study was registered under the UMIN protocol registration system (ID: UMIN000035615).
Procedures and measurements
Venous blood samples were drawn for laboratory measurements on day 4 before breakfast. All patients received a weight-maintaining diet (25–30 kcal/kg ideal body weight) with salt restriction (< 6 g/day). The CGM sensor (ipro2; Medtronic MiniMed, Northridge, CA, USA) was subcutaneously inserted on day 1 and removed on day 4. Using CGM data, glucose variabil-ity was calculated only on days 2 and 3 to avoid bias. The MGL was measured from the date recorded on CGM and adjusted for self-monitored blood glucose. %CV was calculated using the coefficient of variation obtained by dividing the SD by the MGL and multiply-ing by 100. The MAGE was calculated to assess glucose variability [20]. The AUC PP was calculated using the incremental areas above preprandial glucose values 4 h after each meal [15]. After attaching the ABPM device (RAC-3502; Nihon Kohden Co., Ltd., Tokyo, Japan) on day 2, BP was measured in the left upper extremity using the oscillometric method and pulse rate at 30-min intervals for 24 h. Daytime and nighttime were defined on the basis of patients’ written diaries recorded during ABPM. BP variability was estimated using the SD and CV of SBP and DBP during the daytime and nighttime. AV SBP and DBP during the daytime and nighttime were also determined. Circadian rhythm of BP (%) was calculated as (awake SBP − asleep SPB)/awake SBP and
subsequently classified as follows: dipper (fall ≥ 10%),
non-dipper (fall ≥ 0% but < 10%), riser (fall < 0%), and
extreme-dipper (fall ≥ 20%) [21]. The ratio of
low-to-high-frequency power (LF/HF ratio) was used as a measure of sympathetic and parasympathetic activity and measured using a Holter electrocardiogram (RAC 3502; Nihon Kohden Co., Ltd., Tokyo, Japan) for 24 h on day 2. Further, coefficient of variation in R–R inter-vals (CVR–R) was used as a measure of sympathetic and parasympathetic activities, and it was measured using a noninvasive automatic waveform analyzer (Nihon Kohden Co., Ltd., Tokyo, Japan) on day 4.
Laboratory measurements
Oxidative stress was measured using a d-ROMs test [22] and dedicated photometer (F.R.E.E. System, imported by LTD Tokyo from Diacron International s.r.l. Grosseto, Italy) as previously reported [23]. In accordance with the Wismerll kinetic procedure, the
change in absorbance per minute was expressed as arbitrary units after correction (U.CARR, where 1 U.CARR = the oxidant capacity of a 0.08 mg/dL H2O2 solution; normal range = 250–300 U.CARR). Intra- and inter-assay coefficients of variation were 2.1% and 3.1%, respectively. Serum total cholesterol, LDL-C, HDL-C, TG, and creatinine levels were also measured using an automated analyzer (BM6070, Japan Electron Optics Laboratory, Tokyo, Japan). Plasma glucose was meas-ured using the glucose oxidase method, whereas HbA1c was measured using high-performance liquid chroma-tography [24].
Statistical analysis
Pearson’s correlation coefficient was used for univariate analysis. The Bonferroni correction was used to compare d-ROMs between four groups in low glucose variability and nighttime BP variability, high glucose variability, high BP variability, high glucose variability, and BP variability. Multiple stepwise regression analysis was then performed with d-ROMs as the dependent variable. Independent variables included sex (female), age, duration of diabetes, BMI, smoking status (current), use of insulin, glucose-like peptide-1 receptor agonists, dipeptidyl peptidase 4 inhib-itors, sulfonylureas, α-glucosidase inhibinhib-itors, metformin, thiazolidine, sodium glucose cotransporter 2 inhibitors, statins, angiotensin II receptor blockers, calcium channel blockers, diuretics, α and β blockers, eGFR, FPG, MGL, HbA1c, %CV, MAGE, AUC PP, circadian rhythm pattern of BP, daytime AV of SBP, daytime SD of SBP, daytime CV of SBP, daytime AV of DBP, daytime SD of DBP, daytime CV of DBP, nighttime AV of SBP, nighttime SD of SBP, nighttime CV of SBP, nighttime AV of DBP, nighttime SD of DBP, nighttime CV of DBP, HDL-C, LDL-C, and TG. Analyses were performed using IBM SPSS, Version 22, for Windows (IBM Corp, Armonk, NY, USA) with a p value of < 0.05 indicating statistical significance. Data were expressed as mean ± SD.
Results
Clinical characteristics
The clinical and laboratory characteristics of the 60 par-ticipants are shown in Table 1. Participants had a mean age of 64.5 ± 13.3 years, mean diabetes duration of
13.9 ± 12.4 years, and a mean HbA1c level of 8.5 ± 1.2%.
The study group included more men (n= 34) than women
(n= 26), with participants being slightly overweight
(BMI = 27.6 ± 4.5). At baseline, 35% of the patients were
Relationship between d‑ROMs, markers of diabetes and BP control, and non‑glycemic clinical and laboratory variables
Table 2 shows the correlation between d-ROMs and markers of diabetic control. Significant correlations were observed between d-ROMs and %CV (r = 0.329; p = 0.010), MAGE (r = 0.448; p < 0.001), and AUC PP (r = 0.307; p = 0.017). However, no significant correlation was observed between d-ROMs and FPG, MGL, HbA1c, and non-glycemic variables.
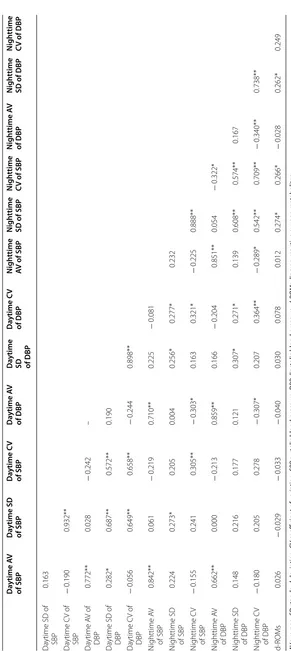
Table 3 shows the correlation between d-ROMS and markers of BP control. Significant correlations were observed between d-ROMs and nighttime SD of SBP (r = 0.274; p = 0.034), DBP (r = 0.262; p = 0.043), and CV of SBP (r = 0.266; p = 0.040). However, no significant cor-relation was observed between d-ROMs and other mark-ers of BP variability.
Additional file 1: Table S1 shows the relationship between glucose variability, nighttime BP variability, glucose variability + nighttime BP variability, and oxida-tive stress. Oxidaoxida-tive stress was significantly higher in the both high glucose variability and BP variability group compared with both low glucose variability and BP vari-ability groups.
In the univariate analysis, a strong correlation was observed between SDs of BP and CVs of BP (Table 3). Therefore, we designed two independent models: model 1 included SDs of BP and model 2 included CVs of BP. Multivariate analysis identified MAGE, eGFR, smok-ing, and nighttime SD and CV of DBP as independ-ent and significant determinants of d-ROMs (model 1: adjusted multiple R2= 0.396, model 2: adjusted multiple R2= 0.439; Table 4).
Table 1 Baseline clinical characteristics of subjects
Clinical characteristics Mean ± SD, n (%)
Age (years) 64.5 ± 13.3
Sex (male) 34 (56.7)
Body mass index (kg/m2) 27.6 ± 4.5
Smoking (%) 12 (20.0)
Drinking (%) 17 (28.3)
Duration of diabetes (years) 13.9 ± 12.4
Dyslipidemia 48 (80.0)
Low-density lipoprotein cholesterol (mg/dL) 108.3 ± 36.4 High-density lipoprotein cholesterol (mg/dL) 44.2 ± 12.0
Triglycerides (mg/dL) 152.3 ± 74.1
Estimated glomerular filtration rate (mL/min/1.73 m2) 75.0 ± 21.3
HbA1c (%) 8.5 ± 1.2
Mean glucose level (mg/dL) 182.2 ± 36.7
Markers of glucose variability
%CV 23.7 ± 5.7
MAGE (mg/dL) 125.9 ± 35.2
Fasting plasma glucose state (mg/dL) 141.9 ± 33.9
AUC PP (mg/dL/h) 470.6 ± 291.1
Markers of BP variability
Daytime average of SBP (mmHg) 129.9 ± 14.7
Daytime SD of SBP (mmHg) 15.0 ± 4.5
Daytime CV of SBP (mmHg) 11.6 ± 3.5
Daytime average of DBP (mmHg) 76.6 ± 10.8
Daytime SD of DBP (mmHg) 9.9 ± 3.1
Daytime CV of DBP (mmHg) 13.0 ± 4.1
Nighttime average of SBP (mmHg) 122.2 ± 17.8
Nighttime SD of SBP (mmHg) 13.4 ± 3.9
Nighttime CV of SBP (mmHg) 11.1 ± 3.3
Nighttime average of DBP (mmHg) 70.9 ± 12.6
Nighttime SD of DBP (mmHg) 8.3 ± 2.6
Nighttime CV of DBP (mmHg) 12.0 ± 4.2
Dipper/non-dipper/riser/extreme-dipper 16/27/16/1
LF/HF ratio 3.7 ± 2.3
CVR–R (%) 2.9 ± 2.1
d-ROMs (U.CARR) 356.1 ± 66.7
Macroangiopathy 14 (23.3)
Nephropathy 25 (41.7)
Neuropathy 31 (51.7)
Retinopathy 21 (35.0)
Diabetes therapy
Diet alone 16 (26.7)
Metformin 21 (35.0)
Sulfonylurea 24 (40.0)
Glinide 0 (0.0)
α-Glucosidase inhibitor 11 (18.3)
Thiazolidine 11 (18.3)
Dipeptidyl peptidase 4 inhibitor 25 (41.7)
Sodium glucose cotransporter 2 inhibitors 6 (10.0) Glucose-like peptide 1 receptor agonist 7 (11.7)
Table 1 (continued)
Clinical characteristics Mean ± SD, n (%)
Insulin 14 (23.3)
Antihypertensive drugs
Diet alone 23 (38.3)
Angiotensin II receptor blocker 26 (43.3)
Calcium channel blocker 29 (48.3)
Diuretic 5 (8.3)
α Blocker 1 (1.7)
β Blocker 4 (6.7)
Other treatments
Lipid-lowering drugs (statins) 33 (55.0)
Data are mean ± SD, n (%)
1 U.CARR (arbitrary unit) = the oxidant capacity of a 0.08 mg/dL H2O2 solution HbA1c hemoglobin A1c, %CV percentage coefficient of variation for glucose, MAGE mean amplitude of glycemic excursions, AUC PP area under the
Relationship between glucose and BP variabilities as well as between LF/RF ratio and CVR–R
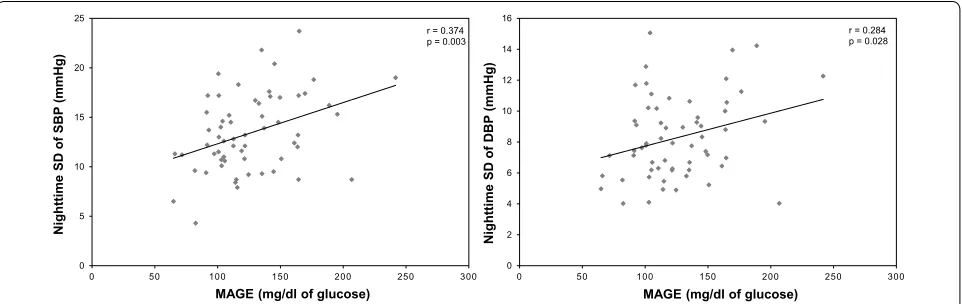
Additional file 2: Table S2 shows the correlation between MAGE and BP variability. Significant correla-tions were observed between MAGE and nighttime SD of SBP (r = 0.374; p = 0.003), DBP (r = 0.284; p = 0.028,) and nighttime CV of SBP (r = 0.276; p = 0.033; Fig. 2). However, no significant correlations were observed between MAGE and daytime AV of SBP and DBP, day-time SD and CV of SBP and DBP, and nightday-time AV of SBP and DBP.
Additional file 3: Table S3 shows the correla-tion between LF/HF ratio and CVR–R as well as that between glucose variability and markers of BP vari-ability. Significant correlation was observed between MAGE and LF/HF ratio at nighttime (r = 0.319; p = 0.013). However, no significant correlations of BP variability with LF/HF ratios at 24 h, daytime, and nighttime as well as with CVR–R were observed.
Discussion
A previous study has demonstrated that in patients with T2DM without hypertension, oxidative stress is associ-ated with glucose variability indexes, such as continuous overall net glycemic action, as well as with BP variabil-ity indexes, such as percent changes in systolic and DBP from daytime to nighttime [25]. However, no other study has investigated the relationship between oxidative stress and glucose and BP variability in patients with T2DM and hypertension. Therefore, the present study has been the first to demonstrate that oxidative stress is associated with not only daily glucose but also daily BP variability in patients with T2DM and hypertension. Our findings are significant and suggest the importance of not only HbA1c, maximum SBP, and DBP but also glucose and
BP variability in the clinical management of T2DM with hypertension.
The present study showed an association between oxi-dative stress, eGFR, and smoking, a finding consistent with that presented in previous studies [26, 27]. With regard to glucose metabolism, previous clinical studies have shown that glucose variability, evaluated through CGM, was associated with oxidative stress [16], a result similar to that presented in the present study. Conversely, only a few studies have investigated the association between BP variability, evaluated through 24 h ABPM, and oxidative stress in hypertension. The present study showed that nighttime but not daytime BP variability was associated with oxidative stress in patients with T2DM and hypertension. In support of our findings, Eguchi et al. [28] demonstrated that nighttime BP variability was a strong predictor for cardiovascular disease in patients with T2DM and hypertension. Another study on patients with diabetes showed that parasympathetic nerve activity was relatively low during the night, resulting in nocturnal sympathetic predominance [29]. Therefore, the involve-ment of diabetic autonomic nerves is surmised to be able to explain the association between nighttime BP vari-ability and oxidative stress. On the other hand, daytime BP variability was not related to oxidative stress, even though SDs of BP variability was higher during daytime than nighttime. The reason was due to the indicator that SDs of BP variability is dependent on average of BP. As a result, in the analysis using CVs of BP variability adjusted by average of BP, CVs of BP variability during nighttime associated with oxidative stress.
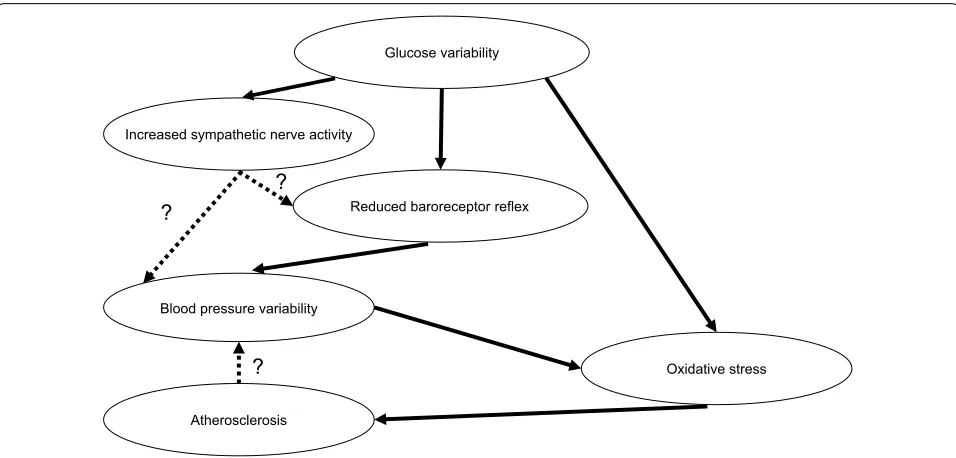
Reduced baroreceptor reflex, increased sympathetic nerve activity, and progress of atherosclerosis are factors contributing to BP variability [30, 31]. Further, patients with diabetes and hypertension have been reported to
Table 2 Correlations between d-ROMs and markers of diabetic control and non-glycemic metabolic variables
FPG fasting plasma glucose, MGL mean glucose level over 24 h, HbA1c hemoglobin A1c, %CV percentage coefficient of variation for glucose, MAGE mean amplitude of glycemic excursions, AUC PP area under the postprandial glucose curve, HDL-C high-density lipoprotein cholesterol, LDL-C low-density lipoprotein cholesterol, TG
triglycerides, d-ROMs diacron-reactive oxygen metabolites *p < 0.05, **p < 0.01
FPG MGL HbA1c %CV MAGE AUC PP HDL‑C LDL‑C TG
MGL 0.630**
HbA1c 0.709** 0.659**
%CV − 0.252 − 0.155 − 0.100
MAGE 0.300* 0.567** 0.334** 0.677**
AUC PP 0.176 0.453** 0.229 0.253 0.543**
HDL-C − 0.051 0.071 − 0.176 0.168 0.160 0.004
LDL-C 0.204 0.286* 0.310* − 0.110 0.066 0.262* 0.091
TG 0.098 0.219 0.252 − 0.151 − 0.016 0.024 − 0.256* 0.273*
Table 3 C orr ela tions b et w een d-R OMs and mar
kers of BP c
on tr ol AV a ver age , SD standar d devia tion, CV c oefficien
t of v
ar ia tion, SBP sy st
olic blood pr
essur
e,
DBP
diast
olic blood pr
essur e, d-R OMs diacr on-r eac tiv e o xy gen metabolit es *p < 0.05, **p < 0.01 Da ytime A V of SBP Da ytime SD of SBP Da ytime C V of SBP Da ytime A V of DBP Da ytime
SD of DBP
Da ytime C V of DBP N igh ttime AV of SBP N igh ttime SD of SBP N igh ttime CV of SBP N igh ttime A V of DBP N igh ttime SD of DBP N igh ttime CV of DBP Da
ytime SD of SBP
0.163 Da ytime C V of SBP − 0.190 0.932** Da ytime A V of DBP 0.772** 0.028 − 0.242 – Da
ytime SD of DBP
0.282* 0.687** 0.572** 0.190 Da ytime C V of DBP − 0.056 0.649** 0.658** − 0.244 0.898** N ighttime A V of SBP 0.842** 0.061 − 0.219 0.710** 0.225 − 0.081 N
ighttime SD of SBP
0.224 0.273* 0.205 0.004 0.256* 0.277* 0.232 N ighttime C V of SBP − 0.155 0.241 0.305** − 0.303* 0.163 0.321* − 0.225 0.888** N ighttime A V of DBP 0.662** 0.000 − 0.213 0.859** 0.166 − 0.204 0.851** 0.054 − 0.322* N
ighttime SD of DBP
have greater BP variability compared with those without such conditions [32]. This is due to reduced barorecep-tor reflex sensitivity [33], relatively increased sympathetic activity [34], and progress of atherosclerosis in T2DM [35]. Although baroreceptor reflex sensitivity has been
associated with diabetic neuropathy [36], the present study found no relationship between BP variability, LF/ HF ratio, and coefficient of variation in the R–R inter-vals. This result may support previous findings wherein baroreceptor reflex sensitivity had been found to be sig-nificantly reduced before the onset of autonomic dys-function in patients with diabetes [37]. Conversely, one recent report showed that glucose variability is inversely associated with baroreceptor reflex sensitivity [38]. Our results show a correlation between glucose variability and nighttime BP variability, which supports the notion that glucose variability attenuates baroreceptor reflex sensi-tivity. In addition, our results show a correlation between glucose variability and LF/HF ratio at nighttime. Our findings showed that glucose variability was related to nighttime but not daytime BP variability. Sasaki et al. [39] reported that impaired glucose tolerance and diabetes mellitus are associated with BP variability. They suggested that glucose metabolism disorder may modulate BP vari-ability through arteriosclerosis and decreased barorecep-tor reflex. Thus, we present our hypothesis regarding the association between glucose and BP variabilities in Fig. 3. In addition, we investigated whether MAGE and BP vari-abilities are synergistic or additive to d-ROMs. There was no significant interaction between MAGE and nighttime SD of DBP. This finding indicates that MAGE and night-time SD of DBP additively affect d-ROMs (two-away ANOVA; p = 0.497). However, we did not obtain consist-ent results regarding effects of sympathetic activities on the association between glucose and BP variabilities in the present study. Therefore, further investigation into the association of sympathetic nerve activity with glucose and BP variabilities is warranted.
Reports have shown a relationship between cardio-vascular disease and BP variability evaluated through ABPM. Accordingly, several studies have deter-mined nighttime SBP variability to be a risk factor for
Table 4 Linear multivariate analyses with changes
in d-ROMs as dependent variables
Multiple stepwise regression analysis, with d-ROMs as the dependent variable, adjusted for sex (female), age, duration of diabetes, body mass index, smoking status (current), use of insulin, glucose-like peptide-1 receptor agonists, dipeptidyl peptidase 4 inhibitors, sulfonylureas, glinides, α-glucosidase inhibitors, metformin, thiazolidine, sodium glucose cotransporter 2 inhibitors, statins, angiotensin II receptor blockers, calcium channel blockers, diuretics, α and β blockers, estimated glomerular filtration rate, FPG, MGL, HbA1c, %CV, MAGE, AUC PP, daytime AV of SBP, daytime SD of SBP, daytime AV of DBP, daytime SD of DBP, nighttime AV of SBP, nighttime SD of SBP, nighttime AV of DBP, nighttime SD of DBP, HDL-C, LDL-C, and TG
d-ROMs diacron-reactive oxygen metabolites, FPG fasting plasma glucose state, MGL mean glucose level over 24 h, HbA1c hemoglobin A1c, MAGE mean amplitude of glycemic excursions, AUC PP total area under the postprandial
plasma glucose curve, AV average, SD standard deviation, CV coefficient of variation, SBP systolic blood pressure, DBP diastolic blood pressure, HDL-C high-density lipoprotein cholesterol, LDL-C low-density lipoprotein cholesterol, TG triglyceride
*p < 0.05, **p < 0.01
Dependent variables: d‑ROMs (U.CARR) β coefficient t value p value Full‑model R2
Model 1 < 0.001** 0.396
MAGE 0.311 2.831 0.006**
eGFR −0.228 −2.211 0.031*
Smoking 0.365 3.376 0.001**
Nighttime SD of
DBP 0.225 2.036 0.047*
Model 2 < 0.001** 0.439
MAGE 0.321 3.147 0.003**
eGFR − 0.204 − 2.032 0.047*
Smoking 0.379 3.646 0.001**
Nighttime CV of
DBP 0.258 2.484 0.016*
0 5 10 15 20 25
0 50 100 150 200 250 300
Nighttime
SD of
SBP (mmHg)
MAGE (mg/dl of glucose)
r = 0.374 p = 0.003
0 2 4 6 8 10 12 14 16
0 50 100 150 200 250 300
MAGE (mg/dl of glucose)
Nighttime
SD of
DBP (mmHg)
r = 0.284 p = 0.028
cardiovascular disease [28, 40, 41]. On the other hand, the present study showed that nighttime DBP variability was associated with oxidative stress. However, the mech-anism leading to this result is unknown. The results of the ONTARGET study, wherein, regardless of SBP level, car-diovascular disease increased when DBP was low among patients with diabetes were reported [42]. This can be explained by the following pathophysiologic mechanism: low DBP could compromise blood flow to the target organs, impairing coronary perfusion and causing car-diac ischemia [43]. Therefore, we considered the possi-bility that hypotension caused by higher DBP variapossi-bility causes oxidative stress. However, at the quartile of DBP variability, DBP was less than 60 mmHg at the same rate (first quartile 〈nighttime SD of DBP: 5.3 ± 0.8〉: 18.3%,
second quartile 〈nighttime SD of DBP: 7.0 ± 0.5〉: 13.3%,
third quartile 〈nighttime SD of DBP: 8.9 ± 0.6〉: 16.7%,
fourth quartile 〈nighttime SD of DBP: 11.9 ± 1.5〉: 16.7%,
p = 0.723).
The present study has several limitations worth not-ing. First, this was a cross-sectional study, precluding the evaluation of any cause–effect relationship between BP variability and oxidative stress. Further studies should examine whether interventions aimed at reducing BP variability are required. Second, given that the sample size was relatively small, any subgroup comparison may lack statistical power. Third, other markers of oxida-tive stress had not been measured for comparison. It is reported that the d-ROMs measured in the present study are not only quick and inexpensive for use in the clinical
settings but also have high reproducibility and correla-tion with Electron Spin Resonance [44]. Actually, it has been reported that d-ROMs predict morbidity and mor-tality [45, 46]. We also reported their association with glucose variability in T2DM [16, 17]. However, d-ROMs are a new oxidative stress marker, and there are not as much data for them as for 8-hydroxydeoxyguanosine [14] or 8-iso-prostaglandin F2α [9, 15]. Fourth, because the glycemic control in these subjects was poor, hypergly-cemia and glucose variability may have had a significant effect on the results of this study. In the future, we should perform a study, including patients with good glycemic control. Finally, BMI ≥ 25 is diagnosed as obesity in Japan
[47]. As the average BMI of participants in the present study is 27.6, there is a possibility that obstructive sleep apnea (OSA) is included in some of the participants. OSA causes BP variability during sleep [48], and repeti-tive oxygen desaturation affects oxidarepeti-tive stress [49]. In the present study, it is possible that OSA may have influ-ence on the results from nighttime BP variability related to oxidative stress.
Conclusions
In conclusion, the present study has been the first to show that oxidative stress is associated with glucose and BP variability in patients with type 2 diabetes mellitus and hypertension. Although further intervention studies are required to determine whether reducing not only glu-cose variability but also BP variability is associated with reduced oxidative stress, the results presented herein Glucose variability
Blood pressure variability
Reduced baroreceptor reflex
Oxidative stress Increased sympathetic nerve activity
? ?
Atherosclerosis
?
suggest that glucose and BP variability is an important factor affecting oxidative stress.
Additional files
Additional file 1: Table S1. Relationship between glucose variability,
nighttime blood pressure variability, glucose variability + nighttime blood
pressure variability, and oxidative stress.
Additional file 2: Table S2. Correlations between MAGE and blood pres-sure variability.
Additional file 3. Correlations between LF/HF ratio and CVR–R, glucose variability, and markers of blood pressure control.
Abbreviations
T2DM: type 2 diabetes mellitus; BP: blood pressure; CGM: continuous glucose monitoring; ABPM: ambulatory blood pressure monitoring; d-ROMS: diacron-reactive oxygen metabolites; SBP: systolic blood pressure; DBP: diastolic blood pressure; eGFR: estimated glomerular filtration rate; FPG: fasting plasma glucose; LDL-C: low-density lipoprotein cholesterol; HDL-C: high-density lipo-protein cholesterol; TG: triglycerides; MGL: mean glucose level; %CV: percent-age coefficient of variation for glucose; MAGE: mean amplitude of glycemic
excursions; AUC PP: area under the postprandial plasma glucose curve; AV:
aver-age; LF/HF ratio: the ratio of low- to high-frequency power; CVR–R: coefficient of variation in the R–R intervals.
Authors’ contributions
MO contributed to study design, data acquisition, and data analysis and wrote the manuscript. TY, YM, TH, TF and TH reviewed and edited the manuscript for intellectual content. MO and TH drafted the manuscript. MO, HN, YK, MK, HG, MH, TY, YM, TH, TF, and TH interpreted data and critically revised and com-pleted the manuscript. All authors read and approved the final manuscript.
Acknowledgements
We thank Dr. Satoshi Goto, Dr. Ayako Fukase, Dr. So, Yamamura, and Dr. Nobuko Sato for their assistance with data collection. We would like to thank
Enago (http://www.enago .jp) for the English language review of this article.
Competing interests
The authors of this manuscript have the following competing interests: T. Hirano received lecture fees from Kowa, MSD, Takeda, Astra Zeneca, Ono, Novo Nordisk, Eli Lilly, and Boehringer Ingelheim. The other authors declare that they have no competing interests.
Availability of data and materials
The datasets used and analyzed during the current study are available from the corresponding author on reasonable request.
Consent for publication Not applicable.
Ethics approval and consent to participate
The study protocol was approved by the Ethics Committee of Showa Univer-sity School of Medicine.
Funding
No specific funding was received for the study.
Publisher’s Note
Springer Nature remains neutral with regard to jurisdictional claims in pub-lished maps and institutional affiliations.
Received: 30 January 2019 Accepted: 2 April 2019
References
1. Chen G, McAlister FA, Walker RL, Hemmelgarn BR, Campbell NR. Car-diovascular outcomes in Framingham participants with diabetes: the importance of blood pressure. Hypertension. 2011;57:891–7. 2. Adler AI, Stratton IM, Neil HA, Yudkin JS, Matthews DR, Cull CA, et al.
Association of systolic blood pressure with macrovascular and micro-vascular complications of type 2 diabetes (UKPDS 36): prospective observational study. BMJ. 2000;321:412–9.
3. Gaede P, Vedel P, Larsen N, Jensen GV, Parving HH, Pedersen O. Multi-factorial intervention and cardiovascular disease in patients with type 2 diabetes. N Engl J Med. 2003;348:383–93.
4. Ueki K, Sasako T, Okazaki Y, Kato M, Okahata S, Katsuyama H, et al. Effect of an intensified multifactorial intervention on cardiovascular out-comes and mortality in type 2 diabetes (J-DOIT3): an open-label, ran-domised controlled trial. Lancet Diabetes Endocrinol. 2017;5:951–64. 5. Hirakawa Y, Arima H, Zoungas S, Ninomiya T, Cooper M, Hamet P, et al.
Impact of visit-to-visit glycemic variability on the risks of macrovascular and microvascular events and all-cause mortality in type 2 diabetes: the ADVANCE trial. Diabetes Care. 2014;37:2359–65.
6. Hata J, Arima H, Rothwell PM, Woodward M, Zoungas S, Anderson C, et al. Effects of visit-to-visit variability in systolic blood pressure on macrovascular and microvascular complications in patients with type 2 diabetes mellitus: the ADVANCE trial. Circulation. 2013;128:1325–34. 7. Giugliano D, Ceriello A, Paolisso G. Oxidative stress and diabetic
vascu-lar complications. Diabetes Care. 1996;19:257–67.
8. Brownlee M. The pathobiology of diabetic complications: a unifying mechanism. Diabetes. 2005;54:1615–25.
9. Ceriello A, Esposito K, Piconi L, Ihnat MA, Thorpe JE, Testa R, et al. Oscil-lating glucose is more deleterious to endothelial function and oxida-tive stress than mean glucose in normal and type 2 diabetic patients. Diabetes. 2008;57:1349–54.
10. Higashi Y, Sasaki S, Nakagawa K, Matsuura H, Oshima T, Chayama K. Endothelial function and oxidative stress in renovascular hypertension. N Engl J Med. 2002;346:1954–62.
11. Romero JC, Reckelhoff JF. State-of-the-art lecture. Role of angio-tensin and oxidative stress in essential hypertension. Hypertension. 1999;34:9439.
12. Rajagopalan S, Kurz S, Münzel T, Tarpey M, Freeman BA, Griendling KK, et al. Angiotensin II-mediated hypertension in the rat increases vascular superoxide production via membrane NADH/NADPH oxidase activation. Contribution to alterations of vasomotor tone. J Clin Invest. 1996;97:1916–23.
13. Taddei S, Virdis A, Ghiadoni L, Magagna A, Salvetti A. Vitamin C improves endothelium-dependent vasodilation by restoring nitric oxide activity in essential hypertension. Circulation. 1998;97:2222–9.
14. Chang CM, Hsieh CJ, Huang JC, Huang IC. Acute and chronic fluctuations in blood glucose levels can increase oxidative stress in type 2 diabetes mellitus. Acta Diabetol. 2012;49:S171–7.
15. Monnier L, Mas E, Ginet C, Michel F, Villon L, Cristol JP, et al. Activa-tion of oxidative stress by acute glucose fluctuaActiva-tions compared with sustained chronic hyperglycemia in patients with type 2 diabetes. JAMA. 2006;295:1681–7.
16. Ohara M, Fukui T, Ouchi M, Watanabe K, Suzuki T, Yamamoto S, et al. Relationship between daily and day-to-day glycemic variability and increased oxidative stress in type 2 diabetes. Diabetes Res Clin Pract. 2016;122:62–70.
17. Ohara M, Nagaike H, Goto S, Fukase A, Tanabe Y, Tomoyasu M, et al. Improvements of ambient hyperglycemia and glycemic variability are associated with reduction in oxidative stress for patients with type 2 diabetes. Diabetes Res Clin Pract. 2018;139:253–61.
18. Seino Y, Nanjo K, Tajima N, Kadowaki T, Kashiwagi A, Araki E, et al. Report of the committee on the classification and diagnostic criteria of diabetes mellitus. J Diabetes Invest. 2010;1:212–28.
•fast, convenient online submission
•
thorough peer review by experienced researchers in your field
• rapid publication on acceptance
• support for research data, including large and complex data types
•
gold Open Access which fosters wider collaboration and increased citations maximum visibility for your research: over 100M website views per year
•
At BMC, research is always in progress.
Learn more biomedcentral.com/submissions
Ready to submit your research? Choose BMC and benefit from: 20. Service FJ, Molnar GD, Rosevear JW, Ackerman E, Gatewood LC, Taylor WF.
Mean amplitude of glycemic excursions, a measure of diabetic instability. Diabetes. 1970;19:644–55.
21. Kario K, Pickering TG, Matsuo T, Hoshide S, Schwartz JE, Shimada K. Stroke prognosis and abnormal nocturnal blood pressure falls in older hyperten-sives. Hypetension. 2001;38:852–7.
22. Gerardi G, Usberti M, Martini G, Albertini A, Sugherini L, Pompella A, et al. Plasma total antioxidant capacity in hemodialyzed patients and its rela-tionships to other biomarkers of oxidative stress and lipid peroxidation. Clin Chem Lab Med. 2002;40:104–10.
23. Cesarone MR, Belcaro G, Carratelli M, Cornelli U, De Sanctis MT, Incandela L, et al. A simple test to monitor oxidative stress. Int Angiol. 1999;18:127–30.
24. Schnedl WJ, Lahousen T, Wallner SJ, Krause R, Lipp RW. Silent hemoglobin variants and determination of HbA(1c) with the high-resolution program of the HPLC HA-8160 hemoglobin analyzer. Clin Biochem. 2005;38:88–91. 25. Di Flaviani A, Picconi F, Di Stefano P, Giordani I, Malandrucco I, Maggio
P, et al. Impact of glycemic and blood pressure variability on surrogate measures of cardiovascular outcomes in type 2 diabetic patients. Diabe-tes Care. 2011;34:1605–9.
26. Kato T, Umeda A, Miyagawa K, Takeda H, Adachi T, Toyoda S, et al. Varenicline-assisted smoking cessation decreases oxidative stress and restores endothelial function. Hypertens Res. 2014;7:655–8.
27. Ishizaka Y, Yamakado M, Toda A, Tani M, Ishizaka N. Relationship between estimated glomerular filtration rate, albuminuria, and oxidant status in the Japanese population. Nephrology. 2013;14:191.
28. Eguchi K, Ishikawa J, Hoshide S, Pickering TG, Schwartz JE, Shimada K, et al. Night time blood pressure variability is a strong predictor for cardiovascular events in patients with type 2 diabetes. Am J Hypertens. 2009;22:46–51.
29. Vinik AI, Ziegler D. Diabetic cardiovascular autonomic neuropathy. Circu-lation. 2007;115:387–97.
30. Mancia G, Parati G, Pomidossi G, Casadei R, Di Rienzo M, Zanchetti A. Arterial baroreflexes and blood pressure and heart rate variabilities in humans. Hypertension. 1986;8:147–53.
31. Narkiewicz K, Winnicki M, Schroeder K, Phillips BG, Kato M, Cwalina E, et al. Relationship between muscle sympathetic nerve activity and diur-nal blood pressure profile. Hypertension. 2002;39:168–72.
32. Ozawa M, Tamura K, Iwatsubo K, Matsushita K, Sakai M, Tsurumi-Ikeya Y, et al. Ambulatory blood pressure variability is increased in diabetic hypertensives. Clin Exp Hypertens. 2008;30:213–24.
33. Rowaiye OO, Jankowska EA, Ponikowska B. Baroreceptor sensitivity and diabetes mellitus. Cardiol J. 2013;20:453–63.
34. Maser RE, Lenhard MJ. Cardiovascular autonomic neuropathy due to diabetes mellitus: clinical manifestations, consequences, and treatment. J Clin Endocrinol Metab. 2005;90:5896–903.
35. Tamura K, Tsurumi Y, Sakai M, Tanaka Y, Okano Y, Yamauchi J, et al. A possible relationship of nocturnal blood pressure variability with coronary artery disease in diabetic nephropathy. Clin Exp Hypertens. 2007;29:31–42.
36. Ruiz J, Monbaron D, Parati G, Perret S, Haesler E, Danzeisen C, et al. Dia-betic neuropathy is a more important determinant of baroreflex sensitiv-ity than carotid elasticsensitiv-ity in type 2 diabetes. Hypertension. 2005;46:162–7.
37. Frattola A, Parati G, Gamba P, Paleari F, Mauri G, Di Rienzo M, et al. Time and frequency domain estimates of spontaneous baroreflex sensitivity provide early detection of autonomic dysfunction in diabetes mellitus. Diabetologia. 1997;40:1470–5.
38. Matsutani D, Sakamoto M, Iuchi H, Minato S, Suzuki H, Kayama Y, et al. Glycemic variability in continuous glucose monitoring is inversely associ-ated with baroreflex sensitivity in type 2 diabetes: a preliminary report. Cardiovasc Diabetol. 2018;17:36.
39. Sasaki N, Ozono R, Fujiwara S, Maeda R, Kihara Y. Impaired glucose metabolism is associated with visit-to-visit blood pressure variabil-ity in participants without cardiovascular disease. Int J Hypertens.
2018;2018(23):5126270. https ://doi.org/10.1155/2018/51262 70.
40. Verdecchia P, Angeli F, Gattobigio R, Rapicetta C, Reboldi G. Impact of blood pressure variability on cardiac and cerebrovascular complications in hypertension. Am J Hypertens. 2007;20:154–61.
41. Pringle E, Phillips C, Thijs L, Davidson C, Staessen JA, de Leeuw PW, et al. Systolic blood pressure variability as a risk factor for stroke and cardio-vascular mortality in the elderly hypertensive population. J Hypertens. 2003;21:2251–7.
42. Redon J, Mancia G, Sleight P, Schumacher H, Gao P, Pogue J, et al. Safety and efficacy of low blood pressures among patients with diabetes: subgroup analyses from the ONTARGET (ONgoing Telmisartan Alone and in combination with Ramipril Global Endpoint Trial). J Am Coll Cardiol. 2012;59:74–83.
43. Messerli FH, Mancia G, Conti CR, Hewkin AC, Kupfer S, Champion A, et al. Dogma disputed: can aggressively lowering blood pressure in hyper-tensive patients with coronary artery disease be dangerous? Ann Intern Med. 2006;144:884–93.
44. Alberti A, Bolognini L, Macciantelli D, Carratelli M. The radical cation of
N,N-diethyl-para-phenylendiamine: a possible indicator of oxidative stress
in biological samples. Res Chem Intemed. 2000;26:253–67.
45. Vassalle C, Boni C, Di Cecco P, Landi P. Elevated hydroperoxide levels as a prognostic predictor of mortality in a cohort of patients with cardiovas-cular disease. Int J Cardiol. 2006;110:415–6.
46. Vassalle C, Bianchi S, Battaglia D, Landi P, Bianchi F, Carpeggiani C. Elevated levels of oxidative stress as a prognostic predictor of major adverse cardiovascular events in patients with coronary artery disease. J Atheroscler Thromb. 2012;19:712–7.
47. Kanazawa M, Yoshiike N, Osaka T, Numba Y, Zimmet P, Inoue S. Criteria and classification of obesity in Japan and Asia-Oceania. World Rev Nutr Diet. 2005;94:1–12.
48. Shirasaki O, Yamashita S, Kawara S, Tagami K, Ishikawa J, Shimada K, et al. A new technique for detecting sleep apnea-related “midnight” surge of blood pressure. Hypertens Res. 2006;29:695–702.