A
m i\\
UCL
University College London
An Investigation of the Liquid Fuel Films within the Cylinder
of a Spark Ignition Engine
Ph.D. Thesis
Marios loannou
August 2000
ProQuest Number: 10042721
All rights reserved
INFORMATION TO ALL USERS
The quality of this reproduction is dependent upon the quality of the copy submitted.
In the unlikely event that the author did not send a complete manuscript and there are missing pages, these will be noted. Also, if material had to be removed,
a note will indicate the deletion.
uest.
ProQuest 10042721
Published by ProQuest LLC(2016). Copyright of the Dissertation is held by the Author.
All rights reserved.
This work is protected against unauthorized copying under Title 17, United States Code. Microform Edition © ProQuest LLC.
ProQuest LLC
789 East Eisenhower Parkway P.O. Box 1346
ABSTRACT
The work reported in this thesis was conducted to investigate the liquid fuel behaviour within the cylinder bore of spark ignition engines. This liquid fuel, most of which results from engine starting and the subsequent warm-up period, is one of the main contributors to unbumed hydrocarbon (uHC) emissions. In modem port fuel injected (PFI) engines, fuel is injected into the port just upstream of the intake valves of each cylinder. The rate of fuel vaporisation at cold conditions is very low and more fuel than is immediately required has to be injected to form a combustible mixture at the time of ignition. It is this excess fuel that results in the high uHC emissions during the warm-up period following a start. The mixture formation process depends on several factors, the most important ones being the cylinder head (intake port and combustion chamber designs), the surface temperature (of the port, the valves and the combustion chamber), the injection timing (closed valve injection - CVI, or open valve injection - OVl), droplet size (injector type), engine load (manifold pressure) and engine speed (the higher the speed the less time for evaporation). This study was aimed at increasing the understanding of how these factors affect the liquid fuel behaviour within the cylinder, and to a lesser extent the uHC emissions.
The first phase of this work involved the application of a known and reliable technique to measure liquid fuel impaction on the cylinder bore, so as to provide information on a relatively short time-scale as to how cylinder head design influences fuel impaction. The porous-liner technique, as the name implies, was based on the positioning of a porous insert in the top of the cylinder bore, through which any liquid fuel that impacted on it, was drawn off, collected and measured. However, this technique could only be applied on a pulsating flow rig and not on a running engine. Under the non-realistic operating conditions involved, the arrangement provided a worst-case indication of the liquid fuel quantity on the bore, during the first cycles of cold start. Furthermore, it can be used for comparison purposes of different operating conditions (speed, load and injection timing), or even different cylinder head configurations.
ACKNOW LEDGEMENTS
Many individuals have helped me in various ways throughout this study. I will always be grateful to my supervisor Dr. Chris Nightingale whose guidance, support and patience are most appreciated. Without his help this work would not have been completed.
Many thanks also go to my second supervisor, Dr. Paul Williams, for his advice throughout the programme of work.
The IC engine research group at UCL has played an important part during my studies, as it provided an interesting environment within which to work.
I am also grateful to the UCL Mechanical Engineering workshop, especially Kevin Crowley, Phil Jeavons, John Inns and Derek Williams for the manufacture of engine parts.
The research work was funded by the Committee of Vice-Chancellors and Principals (CVCP), with further support from Ford Motor Company (US), and this is most gratefully acknowledged.
TABLE OF CONTENTS
Abstract i
Acknowledgements ii
List of Figures viii
List of Tables xvi
Nomenclature xvii
CHAPTER 1: A LITERATURE SURVEY
1.0 Introduction... 1
1.0.1 Engine parameters... 2
1.0.1.1 Air-Fuel and Equivalence Ratios... 2
1.0.1.2 Spark timing... 3
1.0.1.3 Compression ratio... 4
1.0.1.4 Influence of emissions controls... 4
1.1 Emissions... 5
1.1.1 Introduction... 5
1.1.2 European and US legislation for tailpipe emissions... 5
1.1.3 Principal pollutants from si engines... 7
1.1.3.1 Nitrogen oxides (NOx)... 7
1.1.3.2 Carbon monoxide (CO)... 8
1.1.3.3 Particulate matter (PM)... 9
1.1.3.4 Unbumed hydrocarbons... 9
1.1.4 Measures adopted to meet emissions legislation... 13
1.1.4.1 Three-way catalyst (TWC)... 13
1.1.4.2 Combination of close-coupled and under-floor catalyst... 14
1.1.4.3 Electrically Heated Catalyst (EHC)... 14
1.1.4.4 Hydrocarbon trap s... 15
1.1.4.5 Exhaust Gas Ignition (EGI)... 16
1.1.5 Conclusions... 16
1.2 Mixture preparation... 17
1.2.1 Introduction... 17
1.2.2 Mixture formation during cold start... 17
1.2.2.1 The intake process... 19
1.2.2.2 Injection timing (CVI and OVI)... 20
1.2.2.3 Injector type (droplet diameter ) and coolant temperature... 20
1.2.3 Miscellaneous mechanisms for mixture preparation during cold-start... 23
1.2.4 Conclusions... 24
1.3 Lean bum engines... 25
1.3.1 Introduction... 25
1.3.2 In-Cylinder motion... 25
1.3.3 Lean Bum Port Fuel Injected (PFI) engines... 26
1.3.4 Gasoline Direct Injection (GDI) engines... 28
1.3.5 Conclusions... 29
1.4 Variable Valve Timing (W T )... 31
1.4.1 Introduction... 31
1.4.2 W T potential... 31
1.4.3 Conclusions... 33
1.5 Methods of measuring liquid fuel films on the port and bore surfaces... 34
1.5.1 Introduction... 34
1.5.2 Heat Transfer measurements... 34
1.5.2.1 Heat flux sensors... 34
1.5.2.2 Thermocouples... 38
1.5.2.3 Discussion... 39
1.5.3 Laser Induced Fluorescence (LIF)... 41
1.5.3.1 LIF application in the intake port... 42
1.5.3.2 LIF application in the cylinder... 45
1.5.3.3 Discussion... 48
1.5.4 Miscellaneous methods of measuring liquid fuel... 49
1.5.4.1 Laser type optical sensor... 49
1.5.4.2 High-speed video recording... 50
1.5.4.3 Cylinder content isolation and fuel vapour extraction... 51
1.5.4.4 Use of in-cylinder FFID readings... 53
1.5.4.5 In-cylinder liquid fuel absorption through a porous cylinder bore... 54
1.5.5 Conclusions... 54
CHAPTER 2: THE POROUS - LINER TECHNIQUE 2.0 Introduction... 56
2.1 Pulsating flow rig design... 56
2.1.1 Existing components... 56
2.1.2 Specially designed components... 57
2.1.2.1 Pulsating flow rig bench... 59
2.1.3 Pulsating flow rig accessories... 60
2.1.3.1 Fuel system... 60
2.1.3.2 Control units... 61
2.2 Calibration procedures for rig operation... 63
2.2.1 Injector and HWA calibrations... 63
2.2.2 Calibration for optimum pressure drop across porous material... 64
2.2.3 Calibration for gasoline evaporation... 65
2.3 Experimental procedure... 65
CHAPTER 3: POROUS - LINER TECHNIQUE RESULTS 3.0 Introduction... 67
3.1 Commissioning of the pulsating flow rig... 68
3.2 Wall wetting results from cylinder head CHI (2VMY1993)... 73
3.3 Wall wetting results from cylinder head CH2 (2V MY1996)... 75
3.4 Wall wetting results from cylinder head CH3 (4V MY1997)... 79
3.5 Discussion of the porous-liner technique... 80
3.5.1 Relevance of motoring rig tests to real engine behaviour... 80
3.5.2 Discussion of the bore wetting results... 82
3.5.3 Conclusions with respect to design parameters... 84
CHAPTER 4: THE HEAT FLUX SENSOR TECHNIQUE 4.0 Introduction... 85
4.1 Heat transfer - a summary... 85
4.2 Heat flux measurement... 86
4.3 The Heat Flux Sensor (HFS)... 86
4.4 Calibration of the sensor... 90
4.5 Application of the HFS to investigate the liquid fuel on the bore... 93
CHAPTER 5: ENGINE DESIGN 5.0 Introduction... 94
5.1 Engine components... 95
5.1.1 Existing components... 95
5.1.2 Specially designed components... 95
5.1.2.1 Cylinder block design... 96
5.1.2.3 Test bed design... 99
5.1.3 Engine balance analysis... 99
5.2 Engine systems... 100
5.2.1 Drive systems... 100
5.2.2 Lubrication systems... 100
5.2.3 Fuel systems... 100
5.2.3.1 Gasoline fuel system... 100
5.2.3.2 Propane fuel system... 100
5.2.4 Water cooling / heating system... 101
5.3 Engine control units... 102
5.3.1 Fuel injection system... 102
5.3.2 Ignition system... 104
5.3.3 Air flow control system... 105
5.4 Instrumentation set-up to acquire results and monitor engine performance... 105
5.4.1 Heat Flux Sensor (HFS) instrumentation... 105
5.4.1.1 Lab VIEW Vis for HFS readings... 105
5.4.1.2 The HFS arrangement... 108
5.4.2 Cylinder pressure measurements... 108
5.4.3 Temperature measurements... 109
5.4.4 Engine load measurements... 109
5.4.5 Exhaust gas sampling... 109
CHAPTER 6: HEAT FLUX MEASUREMENTS 6.0 Introduction... 110
6.1 Engine parameters... 110
6.2 Notation used... 112
6.3 Heat Flux measurements... 112
6.3.1 Introduction to heat flux traces... 112
6.3.2 Heat flux measurements with the 2-valve cylinder head... 118
6.3.2.1 Motoring heat flux traces... 119
6.3.2.2 Discussion of the motoring heat flux measurements... 125
6.3.2.3 Firing heat flux traces... 126
6.3.2.4 Discussion of the firing heat flux measurements and further test results... 144
6.3.3 Heat Flux measurements with the 4-valve cylinder head... 155
6.3.3.1 Motoring heat flux traces... 155
6.3.3.2 Firing heat flux traces... 157
6.3.3.3 Discussion of the heat flux measurements and further test results... 171
CHAPTER 7: DISCUSSION AND CONCLUSIONS
7.0 Discussion and Conclusions... 176 7.1 Original aspects of this study... 181 7.2 Recommendations for further work... 182
APPENDICES
Appendix I (Chapter 3) : Injector performance investigation
Appendix II (Chapter 5)
Appendix II - la : Upper cylinder block Appendix II - lb : Lower cylinder block Appendix II - 2a : Lower piston
Appendix II - 2b : Upper piston part A Appendix II - 2c : Upper piston part B Appendix II - 3 : Engine balance analysis
Appendix II - 4 : VI to convert voltage into heat flux and temperature
Appendix III (Chapter 6)
Appendix III - 1 : Method of obtaining stoichiometric AFR Appendix III - 2 : Subsequent cycle analysis during CVI Appendix III - 3 : Subsequent cycle analysis during OVI
Appendix IV (Chapter 7): Quantitative analysis of heat flux traces
LIST OF FIGURES
Chapter 1
Figure 1.1a Ideal air standard Otto cycle... 1
Figure 1.1b Standard cycle for four-stroke engine... 1
Figure 1.2 Brake mean effective pressure and specific fuel consumption changes w.r.t. equivalence ratio ... 2
Figure 1.3 Ignition timing effect on power output and brake thermal efficiency... 4
Figure 1.4 Comparison of proposed EU standards with those of US and Japan... 6
Figure 1.5 Previous (1997) and Present (2000) European Driving Cycles... 6
Figure 1.6 Variation of NO, HC and CO, with A F R ... 8
Figure 1.7a Major sources of uHC... 10
Figure 1.7b Percentage contribution of the uHCs mechanisms to the 9% fuel that escapes combustion... 10
F igure 1.8 Unbumed hydrocarbon signature versus crank angle... 13
Figure 1.9 Basic layout of the divided catalyst system... ; ... 14
Figure 1.10 Schematic diagram of the in-line absorber arrangement to meet ULEV standards... 15
F igure 1.11 Schematic of the Exhaust Gas Ignition system... 16
Figure 1.12 Schematic form of the possible paths of the injected fuel in the port and cylinder... 18
Figure 1.13 HC emissions w.r.t. injection timing (1500 rev/min, 3.78 bar IMEP)... 21
Figure 1.14 Tumble development in a 4-valve cylinder head... 25
F igure 1.15a Barrel stratification... 27
F igure 1.15b Swirl generation... 27
Figure 1.16 Injection strategies of the Mitsubishi GDI engine... 29
F igure 1.17 Valve lift characteristics for improved engine performance... 31
Figure 1.18 Equal camshaft phase shifting of intake and exhaust events by 30° CA 32 F igure 1.19a Heat Flux sensor positions within the inlet port... 34
Figure 1.19b Heat Flux sensor... 34
Figure 1.20a Crank-angle resolved heat flux data (1000 rev/min, 0.79 bar MAP, EOI at 270° ATDC, stoichiometric AFR {gasoline} fully warm conditions)... 36
Figure 1.20b Heat flux variation with coolant temperature (1000 rev/min, 0.53 bar MAP, stoichiometric AFR {isooctane}, EOI at 0° ATDC)... 36
Figure 1.21a Variation of Heat Flux w.r.t. Injection Timing (fully warm conditions, 1000 rev/min, 0.79 bar MAP, stoichiometric AFR {gasoline})... 37
Figure 1.22 Arrangement for fibre-optic based wall film thickness measurements by
laser induced fluorescence... 41
Figure 1.23a Schematic diagram of the optical arrangement to measure wall film thickness within the intake manifold using L IF ... 42
Figure 1.23b Calibrating c e ll... 43
Figure 1.24 Optical arrangement for film thickness measurements using LIF... 44
Figure 1.25 Optical fibre locations within the intake port for measurements using LIF 45 Figure 1.26 Optical set-up for LIF imaging of the combustion chamber... 45
Figure 1.27a Optical set-up for oil film thickness measurements using LIF... 47
Figure 1.27b Apparatus used for the calibration of oil film thickness... 47
Figure 1.28 LIF set-up on L-head single cylinder engine... 47
Figure 1.29 Path of the light ray with the incident beam ... 49
Figure 1.30a Principle of operation of optical sensor... 50
Figure 1.30b Sensor’s (top conical part - side view) output w.r.t. film thickness... 50
F igure 1.31 Optical arrangement for high speed imaging... 51
Figure 1.32 Schematic drawing of the arrangement used to measure liquid fuel in the intake port and cylinder... 52
Figure 1.33 Measurement procedure for quantitative analysis... 52
Figure 1.34 The porous - liner arrangement... 54
Chapter 2 Figure 2.1 Complete set-up for pulsating flow-rig... 57
Figure 2.2 Pulsating flow rig assembly at 45° (top view) and 90° (bottom view) orientations... 58
Figure 2.3 Cylinder head bench components... 59
Figure 2.4 Dummy cylinder and porous material... 60
Figure 2.5 Glass chamber assembly... 60
Figure 2.6 Fuel system... 61
Figure 2.7 Schematic diagram of electrical connections... 62
Figure 2.8 Calibration graph for injectors supplied by Ford... 63
Figure 2.9 Hot Wire Anemometer (HWA) calibration graph... 64
F igure 2.10 Fuel collected w.r.t. pressure drop across porous material, at 1500 rev/min.... 64
Figure 2.11 Evaporation curve of unleaded gasoline... 65
F igure 2.12a Principle of operation of pulsating flow rig... 66
Chapter 3
Figure 3.1
Figure 3.2 Figure 3.3a Figure 3.3b Figure 3.4a Figure 3.4b Figure 3.4c Figure 3.5 Figure 3.6
Figure 3.7
Figure 3.8
Figure 3.9
Figure 3.10
Figure 3.11
Chapter 4
Figure 4.1 Figure 4.2 Figure 4.3a Figure 4.3b Figure 4.4 Figure 4.5 Figure 4.6
Chapter 5
Figure 5.1 Figure 5.2a
Actual and corrected liquid fuel quantities, obtained from CH2 w.r.t end
of injection timing... 68
Schematic of visual observation... 69
Visual observations at 1500 rev/min, CHI with PM37... 70
Visual observations at 1500 rev/min,.CHI with PM 10... 70
Visual observations at 1500 rev/min, CH2 with PM37... 71
Visual observations at 1500 rev/min,.CH2 with PM 10... 71
Visual observations at 1500 rev/min, CH2 with PM37 in 90° orientation 72 Visual observations at 1500 rev/min,.CH3 with PM37... 72
Liquid fuel collected w.r.t. end of injection timing, at 1500 and 620 rev/min, CHI with PM37... 73
Liquid fuel collected w.r.t. end of injection timing, at 1500 rev/min (PM37 and PMIO), with CHI... 74
Liquid fuel collected w.r.t. end of injection timing, at 1500 and 620 rev/min, CH2 with PM37... 76
Liquid fuel collected w.r.t. end of injection timing, at 1500 rev/min (PM37 and PMIO), with CH2... 77
Liquid fuel collected w.r.t. end of injection timing, at 1500 and 620 rev/min, CH2 with PM37 in 90° orientation... 78
Liquid fuel collected w.r.t. end of injection timing, at 1500 and 620 rev/min, CH3 with PM37... 79
Conduction, Convection, Radiation heat transfer m odes... 85
Seebeck effect... 86
HFS thermopile structure... 87
HFS surface structure... 87
Sensor’s face, showing both HFS and R T S ... 88
Heat flux sensor mounting arrangement... 89
Hysteresis effect ofHFS... 90
The single - cylinder research engine... 94
Figure 5.2b The cylinder block... 97
Figure 5.3a The extended piston... 98
Figure 5.3b The three piston parts... 98
Figure 5.4 Assembly of single-cylinder research engine... 99
Figure 5.5a Propane gas carburettor... 101
Figure 5.5b Cross-sectional view of carburettor assembly... 101
Figure 5.6 Schematic diagram of electrical connections... 103
Figure 5.7 Lab VIEW front panel and internal operation, for injection process... 104
Figure 5.8 Front panel displayed on screen to be accessed by u se r... 106
Figure 5.9 Lab VIEW display panel for showing results on a cycle-by-cycle b asis 107 Figure 5.10 Lab VIEW display panel for showing results on an average cycle b asis 107 Figure 5.11 The Heat Flux Sensor (HFS) instrumentation... 108
F igure 5.12 Pressure transducer instrumentation... 109
Chapter 6 F igure 6.1 Setting sequence for test variables... 110
Figure 6.2 Sensor L-l-r output when motoring with injector switched-off (20°C coolant temperature)... 113
Figure 6.3 Sensor L-2-r output when motoring with injector switched-off (20°C coolant temperature)... 114
F igure 6.4a Sensor L-1 -c output when firing with propane (20°C coolant temperature)... 116
F igure 6.4b Sensor L-1 -c output when firing with propane during induction period.. 116
F igure 6.5 Sensor L-2-r output when firing with propane (20°C coolant temperature)... 117
Figure 6.6 Notations for HFS locations around the bore for the 2-valve cylinder head tests... 118
F igure 6.7 Sensor L-1 -r output when motoring for different coolant temperatures.. 119
Figure 6.8 Sensor L-l-r output when motoring and injecting at OVI for different coolant temperatures... 120
Figure 6.9 Sensor L-l-r output when motoring and injecting at CVI for different coolant temperatures... 121
F igure 6.10 Sensor U-1-1 output when motoring for different coolant temperatures 122 Figure 6.11 Sensor U-1-1 output when motoring and injecting at OVI for different coolant temperatures... 122
Figure 6.14 Sensor L-2-r output when motoring and injecting at OVI for
different coolant temperatures... 124 Figure 6.15 Sensor L-2-r output when motoring and injecting at CVI for
different coolant temperatures... 125 Figure 6.16a Sensor L-l-c output when firing with CVI for different coolant
temperatures... 126 F igure 6.16b Sensor L-1 -c output during induction period, when firing with C V I... 127 F igure 6.17a Sensor L-1 -c output when firing with OVI for different coolant
temperatures... 128 Figure 6.17b Sensor L-l-c output during induction period, when firing with O V I... 128 F igure 6.18a Sensor L-1 -c output when firing with propane for different coolant
temperatures... 129 F igure 6.18b Sensor L-1 -c output during induction period, when firing with propane 129 F igure 6.19a Sensor L-1 -r output when firing with CVI for different coolant
temperatures... 130 Figure 6.19b Sensor L-l-r output during induction period, when firing with C V I... 130 Figure 6.20a Sensor L-l-r output when firing with OVI for different coolant
temperatures... 132 Figure 6.20b Sensor L-l-r output during induction period, when firing with O V I... 132 F igure 6.21a Sensor L-1 -r output when firing with propane for different coolant
temperatures... 133 Figure 6.21b Sensor L-l-r output during induction period, when firing with propane 133 Figure 6.22a Sensor L-2-r output when firing at CVI for different coolant temperatures... 134 Figure 6.22b Sensor L-2-r output during induction period, when firing with C V I... 134 Figure 6.23a Sensor L-2-r output when firing with OVI for different coolant
temperatures... 135 Figure 6.23b Sensor L-2-r output during induction period, when firing with O V I... 136 Figure 6.24a Sensor L-2-r output when firing with propane for different coolant
temperatures... 136 Figure 6.24b Sensor L-2-r output during induction period, when firing with propane 137 Figure 6.25a Sensor U-1-1 output when firing with CVI for different coolant
temperatures... 138 Figure 6.25b Sensor U-1-1 output during induction period, when firing with C V I... 138 Figure 6.26a Sensor U-1-1 output when firing with OVI for different coolant
temperatures... 139 Figure 6.26b Sensor U-1-1 output during induction period, when firing with O V I... 140 Figure 6.27a Sensor U-1-1 output when firing with propane for different coolant
F igure 6.27b Sensor U-1-1 output during induction period, when firing with propane 141 Figure 6.28 Sensor P-1 output when firing with CVI for different coolant temperatures... 142 F igure 6.29 Sensor P-1 output when firing with OVI for different coolant temperatures... 142 Figure 6.30 Sensor P-1 output when firing with propane for different coolant
temperatures... 143 Figure 6.31 Cross-sectional view of the intake manifold and cylinder bore of the
Ford 4.6 litre, 2-valve engine... 144 Figure 6.32a Sensor L-l-r output when firing at CVI, for different injector pulsewidths,
at 80° C bore coolant temperature and 20°C cylinder head coolant
temperature... 146 Figure 6.32b Sensor L-l-r output during induction period, when firing with CVI,
for different injector pulsewidths (80° C bore coolant temperature and
20° C cylinder head coolant temperature... 146 Figure 6.33a Sensor L-l-c output when firing with CVI, for different injector
pulsewidths, at 80° C bore coolant temperature and 20°C cylinder
head coolant temperature... 147 Figure 6.33b Sensor L-l-c output during induction period, when firing with CVI,
for different injector pulsewidths (80° C bore coolant temperature and
20° C cylinder head coolant temperature... 147 Figure 6.34a Sensor L-l-r output when firing with different OVI timings,
8ms injector pulsewidth and 80° C coolant temperature... 148 Figure 6.34b Sensor L-l-r output during induction period, when firing with different
OVI timings, 8ms injector pulsewidth and 80° C coolant temperature 148 Figure 6.35a Sensor L-2-r output when firing with different OVI timings,
8ms injector pulsewidth, and 80° C coolant temperature... 149 Figure 6.35b Sensor L-2-r output during induction period, when firing with different
OVI timings, 8ms injector pulsewidth and 80° C coolant temperature 149 Figure 6.36a Output fi*om sensors L-l-r and L-2-r during induction period,
for 10° CA OVI timing... 150 Figure 6.36b Output from sensors L-l-r and L-2-r during induction period,
for 40° CA OVI timing... 150 Figure 6.36c Output from sensors L-l-r and L-2-r during induction period,
for 60° CA OVI timing... 151 Figure 6.37 Sensor P-1 output when firing at different CVI timings with
8ms injector pulsewidth and 80° C coolant temperature... 152 Figure 6.38 Sensor P-1 output when firing at different OVI timings with
Figure 6.39 Notations for HFS locations around the bore for the 4-valve cylinder
head tests... 155 F igure 6.40 Sensor L -1 -r output when motoring at different injection timings
(no injection, CVI and OVI), for different coolant temperatures... 159 Figure 6.41 Sensor L -1 -1 output when motoring at different injection timings
(no injection, CVI and OVI), for different coolant temperatures... 160 Figure 6.42 Sensor L-2-r output when motoring at different injection timings
(no injection, CVI and OVI), for different coolant temperatures... 161 Figure 6.43 Sensor L-2-1 output when motoring at different injection timings
(no injection, CVI and OVI), for different coolant temperatures... 162 Figure 6.44 Sensor U -l-r output when motoring at different injection timings
(no injection, CVI and OVI), for different coolant temperatures... 163 Figure 6.45 Sensor U-1-1 output when motoring at different injection timings
(no injection, CVI and OVI), for different coolant temperatures... 164 Figure 6.46 Sensor L -l-r output when firing with gasoline (OVI, CVI) and propane,
for different coolant temperatures... 165 Figure 6.47 Sensor L-1-1 output when firing with gasoline (OVI, CVI) and propane,
for different coolant temperatures... 166 Figure 6.48 Sensor L-2-r output when firing with gasoline (OVI, CVI) and propane,
for different coolant temperatures... 167 Figure 6.49 Sensor L-2-1 output when firing with gasoline (OVI, CVI) and propane,
for different coolant temperatures... 168 Figure 6.50 Sensor U -1 -r output when firing with gasoline (OVI, CVI) and propane,
for different coolant temperatures... 169 Figure 6.51 Sensor U -1 -1 output when firing with gasoline (OVI, CVI) and propane,
for different coolant temperatures... 170 Figure 6.52a Sensors L-l-r and L-1-1 output when firing at different OVI timings,
and 80° C coolant temperature... 172 Figure 6.52b Sensors L-l-r and L-1-1 output during induction period, when firing
at different OVI timings, and 80° C coolant temperature... 172 Figure 6.53a Sensors L-2-r and L-2-1 output when firing at different OVI timings,
and 80° C coolant temperature... 173 Figure 6.53b Sensors L-2-r and L-2-1 output during induction period, when firing
at different OVI timings, and 80° C coolant temperature... 173 Figure 6.54a Sensors U -l-r and U-1-1 output when firing at different OVI timings,
F igure 6.54b Sensors U-l-r and U-1 -1 output during induction period, when firing
at different OVI timings, and 80° C coolant temperature... 174
Chapter 7
Figure 7.1 Intake flow path for the 2-valve and 4-valve cylinder head designs... 177 Figure 7.2a Wall film formation mechanisms when cylinder head is at 45° orientation ... 177 Figure 7.2b Wall film formation mechanisms when cylinder head is at 90° orientation ... 178 Figure 7.3 Comparison of results from the heat flux sensor technique,
LIST OF TABLES
Chapter 1
Table 1.1 European exhaust emissions standards for passenger petrol cars... 5
Chapter 2
Table 2.1 Ford cylinder heads used in the porous - liner technique tests... 56
Chapter 3
Table 3.1 Simulated operating conditions... 67 Table 3.2 Comparison of CHI and CH2 results w.r.t. Lgf and Ldr (10-37),
at 1500rev/min... 82 Table 3.3 Comparison of all cylinder head results w.r.t. total liquid fiiel collected
by PM37, at 1500rev/min... 82
Chapter 4
Table 4.1 HFS specifications... 89 Table 4.2 Amplifier AMP-6 specifications... 90
Chapter 5
Table 5.1 Ford cylinder heads used in the HFS technique tests... 95 Table 5.2 Sources connected to the Lab VIEW data input channels... 106
Chapter 6
Table 6.1 Valve timing events, fuel and ignition system settings for the
NOM ENCLATURE
AA Air assisted
A/D Analogue/Digital
AF Air forced
AFR Air Fuel Ratio
BDC Bottom Dead Centre (ABDC - After BDC), l(BBDC - Before BDC)
bmep break mean effective pressure
CA Crank angle
CCD Charge Couple Device (ICCD - Intensified CCD)
CFC Chlorofluorocarbons
CH Cylinder Head (e.g. CHI, CH2 and CH3)
CO Carbon Monoxide
COV Coefficient of Variance
CVI Closed Valve Injection
D/A Digital/Analogue
DI Direct Injection
EC European Commission
EGI Exhaust Gas Ignition
EGR Exhaust Gas Recirculation (lEGR - Internal), (EEGR- External EGR)
EHC Electrically Heated Catalyst
EOI End of Inj ection
FID Flame Ionisation Detector (FFID -Fast FID)
FTP Federal Test Procedure
GDI Gasoline Direct Injection
HC Hydrocarbon
HFS Heat Flux Sensor
HWA Hot Wire Anemometer
IC Internal Combustion
IMEP Indicated Mean Effective Pressure
I/O Input / Output
IR Infra Red
LEV Low Emission Vehicle
LIF Laser Induced Fluorescence
MAP Manifold Absolute Pressure
MET Maximum Brake Torque
M W Mitsubishi Vertical Vortex
MY Model Year
NOx Nitrogen Oxides
OBD On - Board Diagnostic
OVI Open Valve Injection
PDPA Phase Doppler Particle Analyser
PEEK PolyEtherEtherKetone
PFI Port Fuel Injection
ppm particles per million
PM Particulate Matter (e.g. PMio)
PM Porous Material (PM37 = 37mm height, and PMIO = 10mm height)
PTFE PolyTetraFluoroEthylene
RAM Random Access Memory
RGF Residual Gas Fraction
RPM Revolutions per Minute
RTS Resistance temperature sensor
si spark ignition
SI Système International
sfc specific fuel consumption (isfc - indicated sfc)
SMD Sauter Mean Diameter
SOHC Single Overhead Camshaft
SOI Start of Inj ection SOx Sulphur Oxides
SS Single spray
TDC Top Dead Centre (ATDC - After TDC), (BTDC - Before TDC)
TLEV Transitional Low Emission Vehicle
TTL Transistor Transistor Logic
TWC Three Way Catalyst
ULEV Ultra Low Emission Vehicle
uHC unbumed Hydrocarbons
UV Ultra Violet
VI Virtual Instrument
VOC Volatile Organic Compound
VTEC Variable valve Timing and lift Electronic Control system
W T Variable Valve Timing
WOT Wide Open Throttle
w.r.t With respect to
CHAPTER 1
CHAPTER 1 A Literature Survey
1.0 Introduction
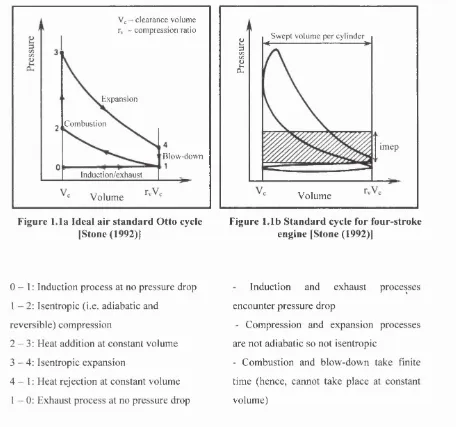
Internal com bustion engines are the m ain prim e m overs used in tran sp o rtatio n and pow er g eneration. They produce m echanical pow er from the energy released by burning a m ixture o f air and fuel w ithin a com bustion cham ber. In spark ignition (si) engines fuel is injected either into the intake port (P ort Fuel Injection - PFI) o r directly into the cylinder (D irect Injection - D l). The fuel first evaporates and then m ixes w ith the incom ing air, and the resulting com bustible m ixture is ignited w ith the aid o f a spark. T his im plies that the w orking fluid is a com bination o f the m ixture form ed before com bustion and the burned gases from com bustion. The pow er o utput from the engine is directly related to the w ork tran sfers betw een these w orking fluids and the m echanical com ponents o f the engine. The ideal therm odynam ic O tto cycle, show n in figure 1.1a, is often used to give a sim ple representation o f the processes involved, but the processes o f a real si engine are far m ore com plex, as show n in figure 1.1b.
Vc - clearance volum e fv - com p ression ratio
Expansion C om bustion
B low -d ow n Induction/exhaust
V olum e
Figure 1.1a Ideal air standard Otto cycle [Stone (1992)1
§
I
S w ept volu m e per cylinder
< >
im ep
V olum e
Figure 1.1b Standard cycle for four-stroke engine [Stone (1992)]
0 - 1 : Induction process at no pressure drop 1 - 2 : Isentropic (i.e. adiabatic and
reversible) com pression
2 - 3 : H eat addition at constant volum e 3 - 4 : Isentropic expansion
4 - 1 : H eat rejection at constant volum e 1 - 0 : E xhaust process at no pressure drop
Induction and exhaust processes en counter pressure drop
- C om pression and expansion processes are not adiabatic so not isentropic
CHAPTER 1 A Literature Survey
1.0.1 Engine Parameters
T he perform ance o f an si engine is influenced by a num ber o f operating variables. The air-fuel ratio (A FR ), spark tim ing, load/speed and com pression ratio are the m ain factors th at affect this p erform ance, in term s o f efficiency and em issions.
1.0.1.1 Air-Fuel and Equivalence Ratios
T he relative proportions o f air and fuel can be given eith er in term s o f m ass flow rates (A FR ) or as an equivalence ratio (O ).
A F R = M air Mfuel
A F R stoich
A F R actual
C om plete com bustion takes place only w hen the am ount o f oxygen is ju s t enough to fully o xidise the hydrocarbon fuel. T hese proportions o f air and fuel are defined as stoichiom etric, and they can be calculated from the follow ing com bustion equation:
Cx Hy +
4 /
(O
2 + 3.7 6A2 ) — x'COj + - ^ / / 2 0 + 3.76
V
C hanges in A FR can affect brake m ean effective pressu re (bm ep) and specific fuel consum ption (sfc) as show n in figure 1.2.
0.2 sfc (kg/MJ)
bmep (bar)
0.15
0 .1
-0.05
-W ide open throttle (-W O T ) — 2 Constant speed
0.6
R ich L ean
Equivalence ratio (O)
CHAPTER 1__________________________________________________________ A Literature Survey
The bmep peaks slightly rich of stoichiometiy (0=1) due to the presence of molecular oxygen in the burned gases under stoichiometric conditions, that results from dissociation taking place at the high temperatures of combustion.
On the other hand, sfc is a minimum at an AFR leaner than stoichiometric. The products of combustion of leaner mixtures are at lower temperatures, therefore less dissociation of CO2 and
H2O takes place. Consequently, a greater fraction of the fuel’s chemical energy is released as
sensible energy, which in turn is converted to work at the piston, bringing about a reduction in sfc. A point is reached where further leaning of the mixture results in a significantly longer bum duration, or even misfire, and consequently the engine’s efficiency deteriorates.
The optimum AFR for part load conditions is the one that gives minimum sfc and therefore optimum efficiency for a given speed. At very low load operation, such as idle, the lowest sfc is achieved with a relatively rich AFR in order to compensate for the slower bum rate, partly resulting from the increased residual gas fraction. In practice most modem si engines are operated at the stoichiometric AFR for part load conditions as this is required for satisfactory operation of the catalyst mounted in the exhaust to reduce concentrations of polluting gases. The mixture is richened to obtain maximum power for full load (wide open throttle - WOT) operation.
1.0.1.2 Spark Timing
The combustion process is initiated by a spark towards the end of the compression stroke and terminates somewhere in the expansion stroke. If combustion starts too early, the sharp rise in pressure will increase the work done by the piston on the gases during the compression stroke. Consequently, the work done on the piston during the expansion stroke will reduce. This peak in pressure and temperature will also promote ‘knocking’ which is the spontaneous ignition of the remaining air/fuel mixture. Late ignition results in a reduced peak cylinder pressure thus reducing the work done by the piston during the expansion stroke.
CHAPTER 1 A Literature Survey
1 1
Fixed: speed, throttle, APR bmep
(bar)
M B T tim ing
10
9
8
0 10 20 30 4 0
Ignition Timing (°BTDC)
Figure 1.3 Ignition timing effect on power output and brake thermal efficiency (Stone (1992)1
1.0.1.3 Compression Ratio
A nalysis o f the ideal air standard O tto cycle (figure 1.1a) indicates th at efficiency {if) increases w ith com pression ratio (a*v).
1
'7 = 1 .r-1
• K
W here Vj is sw ept volum e, Vc is clearance volum e and y is the ratio o f the p rincipal specific heats.
O n a real engine the com pression ratio affects the com bustion rate, heat tran sfer and friction processes, w hich in turn influence the en g in e’s efficiency. The v arious counterb alan cin g effects tend to bring about a peak in efficiency. It is usually not po ssib le to set the com pression ratio at the value for peak engine efficiency, as the advent o f knock lim its the setting to one below optim um . It is also im portant to note that k nock is also greatly influenced by the p ro p erties o f the fuel, as indicated by octane num ber. The low er th e octane num ber the h ig h er the tendency to knock.
I.0.1.4 Influence of emissions controls
CHAPTER 1 A Literature Survey
1.1 Emissions
1.1.1 Introduction
Spark ignition and diesel engines are two of the major contributors to the emission of pollutants such as nitrogen oxides (NO%), unbumed hydrocarbons (uHC), carbon monoxide (CO) and particulate matter (PM). It is established that these pollutants are responsible for environmental problems such as:
• the increase in the ‘greenhouse effect’ through build up of CO2, NO2, and
chlorofluorocarbons (CFCs - produced from escaped refrigerants and from aerosols), resulting in the warming of the planet
• the depletion of the stratospheric ozone layer, leading to the thinning of the shield against ultraviolet radiation
• the formation of low-level ozone by the action of sunlight on NO% and volatile organic compounds (VOCs)
• the increase of photochemical smog resulting from the NOx and VOC reactions • the effect of acid rain (NOx, SOx) on forests and lakes
This study concentrates on pollutant formation from spark ignition engines and the emission control strategies adapted by current automotive manufacturers to meet the legislation.
1.1.2 European and U.S. Legislation for Tailpipe Emissions
The European Commission’s [1996] document concerning car emission standards in the years 2000 and 2005 requires further reduction of tailpipe emissions (about 20 - 40% and 50 - 70%, respectively, compared to 1996 levels), these shown in table 1.1, together with a modification of the testing procedure. In addition, the proposal requires the fitting of an on-board diagnostic (OBD) system for all petrol vehicles equipped with electronically controlled catalytic converters. This system detects any failures in the anti-pollution equipment of the vehicle, such as the catalyst, the oxygen sensor, the evaporative system purge control, and indicates these to the driver.
POLLUTANT EC 1996 EC 2000 EC 2005
CO 2.2 2.3 1.0
HC + NOx 0.5 N/A N/A
HC N/A 0.2 0.1
NOx N/A 0.15 0.08
Table 1.1 European exhaust emissions standards for passenger petrol cars (g/km)
CHAPTER A Literature Survey
F ig u re 1.4 provides a com parison o f the em issions standards betw een E urope, U.S. and Japan, It is evident that the E uropean legislation is the m ost stringent, hig h lig h tin g the significance o f p o llution across Europe,
3.5
2.5
□ NOx
■ HCs
□ CO
2 15
0.5
Figure 1.4 Comparison of proposed EU standards with those of US and Japan [European Commission (1996)]
W ebster [1996] highlights that in th e present driving cycle (figure 1,5b), gas sam pling is initiated at th e start o f engine cranking and only 11 seconds is allow ed before the first acceleration, instead o f the 40 seconds o f the previous cycle (figure 1,5a), Sim ilarly, L ocker c/
al [1996] point out th at only 11 seconds are allow ed fo r w arm -up in the EU cycle w h ereas 21 seconds are perm itted in the US, The first vehicle acceleration in the EU is up to 18 km /hr com pared to 40 km /hr in the US, T hese suggest that catalysts w ill tend to w arm -up m ore slow ly during the E uropean cycle w ith a consequent need to reduce cold start em issions in o rd er to m eet the required standards.
!
j=i40
20
0
0 50 100 150
T est duration (s) a
120
100
0 200 40 0 600 800 1000 1200
T est duration (m in) b
CHAPTER 1__________________________________________________________ A Literature Survey
1.1.3 Principal Pollutants from SI Engines
1.1.3.1 Nitrogen oxides (NOrl
Nitrogen oxides represent the total emissions of nitric oxide (NO) and nitrogen dioxide (NO2),
the former being the most significant, especially in spark ignition engines, where the ratio of NO2/NO is quite small. They are one of the components in the production of acid rain and the
depletion of the ozone layer.
NO is produced in the flame jfront due to the high temperature of combustion. Additionally, the burned gases produced early in the combustion process are compressed to a higher temperature as combustion continues, and so NO formation also occurs in the postflame gases. The kinetics of the NO formation involve the reactions suggested by Zeldovich (1946):
O + N2 NO + N or N +O2 o NO + O
The forward direction of the reactions is promoted by the increase of temperature due to combustion, whereas the reverse of these reactions depends on the temperature drop of the exhaust gases during the expansion stroke. The rapid rate of temperature reduction during the expansion stroke causes the reaction rate constants to become so low that the dissociation of NO ceases and NO is ‘fi'ozen’ at a high concentration.
NO2 is formed in the post-flame gases during flame quenching which involves rapid reactions
such as: H + O2 o HO2 and HO2 + NO <=> NO2 + OH
Factors affecting NO, emissions
NOx emissions are mainly affected by the APR, residual gas fi*action (RGF) and spark timing. Increasing oxygen concentration in rich mixtures increases the temperature of combustion (since more oxidation takes place) and consequently NO% emissions increase too (figure 1.6). At about stoichiometric APR, oxygen balances out with fuel concentration, thus further leaning of the mixture results in lower temperatures and consequently reduced NO% emissions.
Due to their high heat capacity, residual gases act as a heat sink for the heat released during combustion, thereby reducing the peak temperature and consequently NO* production. On the other hand excessive dilution results in poor combustion quality, since combustion rate is reduced, with the consequence of slow burning and possibly misfire.
CHAPTER 1 A Literature Survey
m ade betw een fuel consum ption and NOx em issions since higher p ressures im ply increased efficiency.
S tudies by H arpster e t a l [1995] revealed th at engine deposits also affect NOx em issions. A 30% decrease w as reported in NOx from a d eposit-free engine com pared w ith m easurem ents taken w ith deposits form ed in the com bustion cham ber. T here are tw o m ain reasons for th is decrease. T he volum e occupied by the deposits results in an increased com pression ratio and consequently higher com bustion tem peratures. Secondly, the therm al conductivity o f com bustion cham ber deposits is tw o orders o f m agnitude less than that o f alum inium . This causes a decrease in the heat tran sfer from the com bustion products and consequently an increase in the peak tem perature o f the gases w ith in the cylinder.
S to ic h io m e tr ic
NO
HC
CO
0.7 0.9 1.0 1.1
Fuel/air eq u ivalen ce ratio
Figure 1.6 Variation of NO, HC and CO, with AFR [Heywood (1988)]
1.1.3.2 Carbon monoxide (CO)
C arbon m onoxide hinders breathing and dam ages co-ordination. It is form ed in the postflam e burned gases and is then oxidised to C O2 at a slow er rate, th e governing reaction being:
C O + OH <=> C O2 + H
CHAPTER 1__________________________________________________________ A Literature Survey
1.1.3.3 Particulate matter (PM)
Particulate matter is mainly of three classes, these being lead, organic particulates (including soot), and sulphates. Even though limited data is available on particulate emissions from si engines, recent publications in the U.S. have revealed a relationship with epidemiological effects.
Sawyer [1997] points out that, apart from the 10pm diameter particles (PMio) which are currently subjected to legislation for diesel engines, those having diameters of less than 2.5pm (PM2.5) also affect health. PM2.5 behave like gases and their high diffusion rates enable them to
penetrate deep into the lungs and cause respiratory problems due to increased deposition. Greenwood et al [1996] investigated particulate size distribution in the range of 0.01 to 1.00 pm from both diesel and gasoline engines. At idle and low loads gasoline vehicles produced much lower concentrations than diesels, but at the high loads the particulate numbers from both engines were similar. It was also found that diesel particulates were larger on average than those from gasoline engines, implying that their mass will be higher for the same particulate number concentration. A further conclusion was that gasoline engines might produce more PM2.5 than PMio.
The greater number of si engines means that, even if particulate emissions are lower by mass, the total contribution can be as high as that of diesel engines and should be the subject of legislation.
1.1.3.4 Unburned hydrocarbons (uHCs)
Unbumed hydrocarbons are another contributor to the reactions that deplete the stratospheric ozone layer. Their combination with nitrogen oxides results in photochemical reactions that produce smog and also, in the presence of sunlight, they are responsible for the formation of ozone at ground level. Ground-level ozone damages trees and crops, and causes respiratory problems and eye irritation due to its strong oxidising action. The uHCs that contribute to the formation of ground-level ozone are called volatile organic compounds (VOCs), the best known being benzene, and these are thought to be carcinogens.
Figure 1.6 shows that uHCs emissions are high for rich mixtures. This is due to the lack of oxygen to oxidise, either in the cylinder or the exhaust system, any unbumed hydrocarbons that escape the combustion process. As the mixture is leaned towards stoichiometric, the increasing oxygen concentration and exhaust gas temperatures result in oxidising a substantial amount of uHCs. Further leaning of the mixture continues to decrease the uHCs due to the increase in oxygen. When the operating limit of the engine is reached and combustion quality deteriorates, uHCs start to rise again due to the advent of partial buming cycles that finally result in misfire.
CHAPTER 1 A Literature Survey
B oam e t a l [1994] overview ed the m ain sources o f uH C s, and these are show n in fig u re 1.7a. S im ilar studies by C heng e t a l [1993] indicated th at about 9% o f the fuel that enters th e cylinder escap es b u m in g during the norm al com bustion process. They also evaluated the co n trib u tio n o f each source to this percentage o f fuel, the resu lts show n in figure 1.7b. T he 9% o f fuel that escapes b u m in g leads to a significant loss o f bm ep and fuel conversion efficiency. H aving escaped com bustion, m ost o f it (about 7.2% ) is then oxidised, eith er w ithin the cy lin d er o r the ex h au st port, and the rest contributes to en gine-out uHC em issions. T hese sources are discussed in o rd er o f th eir im portance as indicated by figure 1.7b.
P lu g thread Intake fuel
transients
c r e v ic e
F uel short circu itin g
E xh au st v a lv e
' lea k a g e
G ask et cr e v ic e
O il absorption
^ W all q uench
,P o st fla m e
k in etics
Startability
Figure 1.7a Major sources of uHCs [Boam et al (1994)]
Exh.Valve
L eakage Oil Layers
5% 16%
C revices Deposits
38% 1 ---16%
Flame Liquid Fuel Quench
5%
2 0 %
Figure 1.7b Percentage contribution of the uHC mechanisms to the 9% fuel that escapes combustion [Cheng et al (1993)]
Principal sources of unburned hydrocarbons
C revice volume mechanism. C revice volum es are the regions w ithin the cylinder w h ere the flam e is unable to penetrate, and so they pro v id e shelter for the m ixture during the com bustion process. Such regions are the p isto n -rin g -lin er region, the space around the sp ark plug electrode, the valve seat and th e edge o f the head gasket. M ixture is forced into th ese crevices during the com pression stroke as the pressu re rises. T he trapped charge has an increased density b ecause these crevice volum es are at low er tem peratures due to th eir close proxim ity to the w all. H aving survived com bustion, this charge flow s back into the cylinder du rin g the expansion stroke w hen the cylinder pressure falls, and then exits the cylinder during the exhaust stroke.
CHAPTER 1__________________________________________________________ A Literature Survey
Liquid Fuel In port-fuel injected engines liquid fuel behaviour is influenced greatly by injection timing. Closed valve injection (CVl) promotes fuel evaporation from the hot surfaces o f the intake valves and port, and also from the backflow of the exhaust gases. However, with open valve injection (OVl), a significant amount of fuel enters the cylinder as liquid droplets. Most of this fuel evaporates to form the combustible mixture but the rest (especially the less volatile components) escapes combustion by hiding in crevices, deposits or oil layers, and if it is not oxidised during the expansion and exhaust strokes, it contributes to uHC emissions. During cold start, when surfaces are cold and when fuel enrichment is necessary to obtain a combustible mixture, the liquid fuel proportions that enter the cylinder are relatively high and are not so significantly influenced by injection timing. Measurement of the liquid fuel present in the cylinder is the primary objective of this study and will be discussed in detail later on.
Absorption / desorption in oil films. Fuel vapour dissolves into the oil film during the intake and compression strokes, when the partial pressure of the friel is high, and is subsequently released from the oil into the exhaust gases during the expansion and exhaust strokes, when the partial pressure is relatively low. Some of it is oxidised but most of it contributes to uHC emissions. Fuel solubility [Schramm and Sorenson (1990)] increases with the number of carbon atoms and also with aromatic compounds, especially more complex molecules like the xylenes and alkyl benzenes. The absorption/desorption mechanism of HCs into oil is affected [Sorenson (1996)] by the oil film thickness (HC absorption increases linearly with oil film thickness up to 2pm), the air/fuel ratio, engine speed (less time available for absorption/desorption at high speeds), and cylinder wall temperature (the lower the temperature the greater the absorption capacity). However, Linna et al [1997] suggested that oil film thickness is not affecting the absorption/desorption mechanism and that the oil layer’s contribution to uHCs emissions was less that 10%, implying that this mechanism is not significant to uHC emissions.
The implication is that lubricating oil effects on uHC emissions are very complicated, complex models are required to describe their behaviour, and that the importance of this mechanism is, however, uncertain.
CHAPTER 1__________________________________________________________ A Literature Survey
the intake manifold deposits to uHC emissions is not as significant as that of combustion chamber deposits.
Flame quenching mechanism. According to Heywood [1988] this is a two-stage process, the first stage being that the flame is extinguished at a short distance from the wall, leaving a layer of unbumed mixture ahead of the flame. In the second stage, the wall quench HCs diffuse into the hot combustion gases, where some of them oxidise while the remainder contribute to uHCs. During cold-start the quench layer is thicker (since the cylinder wall temperature is lower), resulting in higher uHCs. Extremely lean or dilute (i.e. with high EGR) operating conditions result in a thicker quench layer [Cheng et al (1993)]. Under such conditions the bum rate is so low that the flame approaches the chamber walls slowly and late in the expansion stroke. The temperature and pressure of the unbumed mixture ahead of the flame is decreasing, thus assisting in ‘early’ flame extinction (i.e. partial buming), and consequently in higher uHC emissions.
Valve leakage. Valve leakage takes place during late compression and early expansion strokes, when the cylinder pressure is high, and is not significant when the engine is new. Boam et al
[1994] used fast flame ionisation detectors (FFID) in the exhaust port, and reported very low uHC concentration in a new engine and an increase in uHC emissions in the case of an old engine. This was due to the fact that the valves and their seats were wom, suggesting that the valve leakage mechanism becomes significant with engine age.
Typical Unbumed Hydrocarbon signature
FFID measurements taken just behind the exhaust valve give the uHCs versus crank angle signature throughout an engine cycle. This is shown in figure 1.8, the main features of which are the following [Boam et al (1994)]:
CHAPTER 1 A Literature Survey
c E a
A
% U
X s
3000
2000
1000
Exhaust v alve
op en in g B low d ow n
Exhaust valve closure
I Stationary gas (behind v alve)
I L_
|< - M a in - > | ex h a u st stroke
I I_____
Stationary gas (behind v alve)
90 180 270 360 450 540 630 720
Crankangle (° ATDCnring)
Figure 1.8 Unbumed hydrocarbon signature versus crank angle [Boam et al (1994)]
1.1.4 M easures adopted to meet emissions legislation 1.1.4.1 Three-way catalyst (TW O
The three-w ay catalyst has been the m ain co n trib u to r to em issions reduction since 1975. The exhaust gas is passed over a precious m etal bed (a com bination o f palladium , p latinum and rhodium ) w hich is m aintained at high tem perature. T he catalyst takes som e tim e to reach its active conversion {light-off) tem perature, this b eing about 300°C . It prom otes reactions to reduce NOx to nitrogen and uses the oxygen to oxidise uH C s and C O to H ] 0 and CO ]. These exotherm ic reactions help to m aintain the catalyst at its correct o p erating tem perature. An im portant draw back o f this catalyst is that it only operates efficiently at th e stoichiom etric AFR. I f the m ixture is leaner (excess O2) it prevents NOx from being reduced, w hereas if th e m ixture
is richer there w ill be too m any uH C s and too m uch C O for full oxidation to tak e place. This im plies that problem s w ill be encountered during tran sien ts w hen A F R requirem ents vary rapidly, and it also constrains the engine from o perating in the lean region w ith associated gains in fuel econom y.
A s already m entioned in section 1.1.2, the proposed em ission legislation involves m easurem ents to be taken from the very first seconds o f engine start-up. G ottberg e t a l [1991] evaluated the contribution o f the w arm -up period as about 80% o f the total em issions output. T his im plies that, in order to m eet the proposed legislation, the catalyst should reach 95% o f its conversion efficiency in less than 20 seconds after start-up. Som e notable attem pts to achieve q uick TW C lig h t-o ff are described below .
CHAPTER 1 A Literature Survey
1.1.4.2 Combination of a close-coupled and an under-floor catalysts
T akada e t a l [1996] proposed a sm all volum e (w arm -up) catalyst p o sitio n ed very close to the exhaust m anifold, and a larger volum e one (m ain) located under-floor, this being relatively far from the engine and therefore at a low er tem perature. T he arrangem ent is show n in figure 1.9.
Small volume warm-up catalyst
Large volume main catalyst
Figure 1.9 Basic layout of the divided catalyst system [Takada et al{\996)\
The sm aller volum e and location o f the w arm -up catalyst provide quick light-off, but only treat part o f the em issions. T he exotherm ic reactions involved add extra heat into the gas stream , and as a result, the gases that enter the m ain catalyst are m uch w arm er, enabling it to lig h t-o ff m ore quickly. A ctual NOx reductions and uH C / C O conversion are obtained at the m ain catalyst w hich is positioned further dow nstream . D ue to its prolonged exposure to high tem peratures the w arm -up catalyst is by-passed, once the m ain catalyst is operating, in o rd er to avoid catalyst ageing.
1.1.4.3 Electrically-Heated Catalyst (EHC)
Such an arrangem ent involves heat supply to the catalyst by electric cu rren t until it reaches lig h t-o ff tem perature. Shim asaki e t a l [1996] reported th at a com bination o f an EH C and a secondary air system provides high reaction heat (ten tim es h ig h er than th at obtain ed w hen using only electrical energy supply) and can m eet the U L E V requirem ents. T he injected air w as supplied in order to increase th e tem perature o f the exh au st gases (due to oxidation reactions), and as a result to reduce uH C em issions b efore the exhaust gases entered the catalyst. Even though lig h t-o ff w as achieved w ithin 20 seconds o f start-up, the cost, the com plexity and space requirem ents o f such an arrangem ent, and finally the engine efficiency loss accom panying the operation o f the electrically-heated system , do not provide the optim um solution for car m anufacturers to adopt.
CHAPTER 1 A Literature Survey
1.1,4.4 Hydrocarbon Traps
T hese involve the use o f an absorbent solid, such as zeolite and carbon, to trap the u H C s during the cold start period, and release them w hen the catalyst is w arm enough for o x idation reactions to occur. H erti et a l [1996] proposed a zeolite absorber (w ith a central hole) betw een tw o catalysts. D uring cold start w hen the absorber is cool, uH C s are absorbed as the exhaust gases pass through its channels. T he sm all fraction o f the exhaust th at passes through the hole im pinges directly on the second catalyst (the one dow nstream o f the absorber) and increases its tem perature. T he objective o f this design w as to optim ise the diam eter o f the hole so as to m axim ise the heating rate o f the second catalyst, and at the sam e tim e, to m inim ise the uH Cs escaping through this hole, and to keep the desorption o f H C s during the h eat-up p erio d o f the second catalyst relatively low. D espite its novelty this in-line abso rb er system could only m eet the LEV em ission, and not the U L E V , requirem ents.
A revised concept o f the above configuration by Patil et a l [1996] involved the use o f a flow diverter unit located ju s t upstream o f the abso rb er hole, as show n in figure 1.10. T he diverter w as used to direct the exhaust gases aw ay from the hole and into the ab so rb er’s channels in order to absorb a large fraction o f the uH C s w hile the first catalyst w as heated up. W hen the first catalyst reached lig h t-o ff tem perature, typically w ithin 50 seconds from start-up, the diverter w as shut off. The exhaust gases then passed through the hole and heated up th e second catalyst faster than the abso rb er unit. W hen the second catalyst reached lig h t-o ff air w as also injected to oxidise the desorbed H C s from the now hot absorber. O verall, this arrangem ent requires accurate sizing o f the tw o catalysts and the absorber, in order to obtain the events o f adsorption, second catalyst lig h t-o ff and delayed desorption in the rig h t order. H ow ever, it can satisfactorily m eet the U L E V requirem ents.
(Sam p lin g points)
First Catalyst
Second Catalyst
Secondary air injector port A ir diverter
port
Figure 1.10 Schematic diagram of the in-line absorber arrangement to meet ULEV standards [Patil et al (1996)]
CHAPTER 1 A Literature Survey
1.1.4.5 Exhaust Gas Ignition (EGI)
In th is concept, introduced by M a e t a l [1992], the engine is calibrated to start quite rich (A FR % 9:1) and air is added to the exhaust gas by a secondary pum p before the flow en ters the cataly st (figure 1.11), in order to restore the overall exhaust A F R to ju s t leaner o f stoichiom etric an d hence to allow for conversion o f uH C s and C O . T his flam m able m ixture is then ig n ited by m ean s o f a glow plug in the cataly st’s com bustion cham ber and the heat released raises the tem p eratu re o f the catalyst. O nce ignition occurs and a stable flam e is established, th e engine is tu n e d to a less rich m ixture (A F R « 11:1) and, w ith continued secondary air addition, the o v erall exhaust m ixture is kept leaner o f stoichiom etric. T he EGI system reaches lig h t-o ff tem p eratu re w ithin 20 seconds after start-up. H ow ever, a com parative cost analysis by E ade et a l [1996] that involved arrangem ents such as those m entioned above, show ed th at EGI rep resen ted cost savings only w hen com pared to the EH C system . A n o th er draw back is the sh o rt period o f extrem ely rich operation. T his results in high fuel consum ption, poor p erform ance, and after a certain period o f tim e, to the form ation o f heavy deposits.
Catalyst assembly
Flame
Temperature scasot
Figure 1.11 Schematic of the Exhaust Gas Ignition system [Eade et al (1996)]
1.1.5 Conclusions
T he m ost im portant issues that shape the future o f the si engine are p o llution and petroleum av ailability [G allopoulos (1992)]. In the absence o f petroleum , 1C engines can survive w ith the use o f synthetic fuels from coal and shale. H ow ever, as th e above analysis show ed, si engine p ollutants do th reaten the future o f the si engine. T he U L E V requirem ents o f the U S A can only be m et w ith great difficulty w hile the EU -2005 requirem ents pose a considerable challenge. R esearchers have therefore m oved on to o th er alternatives in order to both m eet th e em ission legislation w hile striving for im provem ents in engine efficiency. Such alternatives are m ixture prep aratio n strategies th at affect the in-cylinder flow , and to a lesser extent the com bustible m ixture. V ariable V alve T im ing system s (V V T ), and the co ncept o f th e L ean - B u m engine, all o f w hich are discussed in the follow ing sections.
CHAPTER 1__________________________________________________________ A Literature Survey
1.2 Mixture preparation
1.2.1 Introduction
In spark ignition engines, mixture formation is provided either by a carburettor, or by a fuel injection system. Carburettors cannot meet the emission legislation due to failure to provide an accurate AFR (especially under transient conditions) that can satisfy the TWC requirements, these being within 0.1 of an AFR unit leaner than the stoichiometric value [Richardson (1996)]. A significant percentage of the total car fleet employs engines fitted with carburettors, even though they are not currently used on production vehicles.
Fuel injection systems can be classified into two categories, these being port fuel injection (PFI) and direct injection (DI). PFI may be either single-point injection (one injector spraying fuel upstream of the manifold for all cylinders) or multi-point injection (one injector just upstream of the inlet valve(s) of each cylinder). As with carburettors, the former leads to fuel transport delays in the inlet manifold, and the latter offers more precise AFR control (since it is positioned close to the inlet valves) with better volumetric efficiency (the inlet manifold can be designed for minimum pressure drop). This study concentrates on multi-point injection but the concept of DI systems, which involves fuel injection directly in the cylinder, is also briefly discussed.
Mixture formation is affected by the injection timing, which may be either closed-valve injection (injection while the inlet valves are closed - CVI) or open valve injection (injection while the valves are open - OVI). Engine management systems may either operate the injectors simultaneously or sequentially. In the former fuel is injected into the port of each cylinder at the same time leading to some cylinders operating at OVI, and others at CVI. This results in cylinder-to-cylinder variations, and consequently less than optimum engine performance. On the other hand the sequential strategy provides injection in the port at a specific injection timing (either CVI or OVI), this being the same for all cylinders.
1.2.2 Mixture formation during cold start
Mixture preparation is an important process in determining the uHC emissions and cycle-to- cycle variations during the start-up and warm-up period, particularly during the transients associated with vehicle acceleration or deceleration. Fuel vaporisation at cold conditions is very slow and more fuel has to be injected to form a combustible mixture at the time of ignition. Comparable problems occur under transient operation when the AFR response to sudden throttle (load) changes is slow. Consequently this excess fuel results in uHCs and higher specific fuel consumption.
The mixture formation process is illustrated in figure 1.12, which indicates the degree of complexity involved.
![Figure 1.2 Brake mean effective pressure and specific fuel consumption changes w.r.t.equivalence ratio [Stone (1992)]](https://thumb-us.123doks.com/thumbv2/123dok_us/8611471.1401179/24.595.133.410.464.702/figure-brake-effective-pressure-specific-consumption-changes-equivalence.webp)

![Figure 1.14 Tumble development in a 4-valve cylinder head [Benjamin (1992)]](https://thumb-us.123doks.com/thumbv2/123dok_us/8611471.1401179/47.595.77.476.519.735/figure-tumble-development-valve-cylinder-head-benjamin.webp)

![Figure 1.16 Injection strategies of the Mitsubishi GDI engine [Kume et a! (1996)]](https://thumb-us.123doks.com/thumbv2/123dok_us/8611471.1401179/51.595.50.509.50.288/figure-injection-strategies-mitsubishi-gdi-engine-kume-et.webp)
![Figure 1.18 Equal camshaft phase shifting of intake and exhaust events by 30° CA[Leone et a /(1996)]](https://thumb-us.123doks.com/thumbv2/123dok_us/8611471.1401179/54.595.75.466.421.723/figure-equal-camshaft-shifting-intake-exhaust-events-leone.webp)

![Figure 1.23b Calibrating cell [Hentschel et al (1997)]](https://thumb-us.123doks.com/thumbv2/123dok_us/8611471.1401179/65.595.96.440.64.292/figure-b-calibrating-cell-hentschel-et-al.webp)

