2550
Application Of K-Means Clustering Algorithm To
Determine The Density Of Demand Of Different
Kinds Of Jobs
F. M. Javed Mehedi Shamrat, Zarrin Tasnim, Imran Mahmud, Ms. Nusrat Jahan, Naimul Islam Nobel
Abstract: In the current competitive job market, information is the most powerful tool. As a job, the seeker looks for a job, and he must have the insight of what kind of competition he is about to face. This information will allow the job seeker to improve himself from the rest in the market. To determine the demand for any field of job among job seekers, with the help of the unsupervised k-means machine learning algorithm, the data of job interests can be clustered in different groups based on their kinds. The visual representation of the clusters in a scatter plot gives the information on which variety of jobs are in more or less demand among job seekers with the density of the groups. This study provides insight into the current job market.
Keywords: K-means, Cluster, Data, Python, Algorithm, Database.
—————————— ◆ ——————————
1. INTRODUCTION
K-means calculation is actualized. K-implies algorithm is an unaided calculation that takes various information focuses and bunch them into a k number of groups. Here k indicates the number of bunches, the number of groups got, at last, will be three bunches. In k-means calculation, information focuses a plotted over a disperse chart, and k number of bunches are set. k number of centroid will be shaped in the table. A calculation will be done to the quantity of cycle set to discover the information directs closest toward the centroids dependent on Euclidean separation. After the most extreme emphasis, the bunches of information focuses on the centroids will be the last groups.
In the dataset, a rundown of occupation titles is accessible. It is the rundown of occupations, up-and-comer is doing or is keen on doing. Simultaneously, up-and-comers search for the sort of occupation they are eager to do in the hunt bar. Subsequently, the pursuit record makes another rundown of occupations that are sought after among the activity searchers. Consolidating the two records, a dataset can be acquired that contains the information of employments, work searcher are keen on. Utilizing this information, we can distinguish the field of occupations individuals are generally intrigued by and organize instructional courses with the goal that activity searchers can turn out to be progressively proficient and gifted in those specific
fields and improve employments. Clustering is in daily life because it could not be separated with a number of data that produce information to meet the needs of life. One of the most important tools in relation to data is to classify or classify the data into a set of categories or clusters [1]. One clustering technique is the method of K-means algorithm using the process repeatedly. The K-Means method is the simplest and most common clustering method. K-means has the ability to group large amounts of data with relatively fast and efficient computation time [2]. However, K-Means has a disadvantage depending on the initial cluster center determination. K-Means cluster test results in the form of solutions that are locally optimal. The trial process is expected to have similarities or closeness between data so that it can be grouped into several clusters, where among cluster members have a high level of similarity [3]. According to (Celebi et al., 2013), the K-Means algorithm is also versatile, which is easy to modify at every stage of the process, pure in the distance calculation function, and depends on iteration termination criteria. The rest of the paper discusses the literature review in section 2, the Methodology (Algorithm1, Algorithm2) consist of section 3, in section 4 discussed Result & Discussion, and in section 5 short brief on Conclusion.
2.
LITERATURE
REVIEW
Researchers have previously worked with the K-means algorithm showed that the K-means algorithm is an unsupervised machine learning algorithm that is very popular for its simplicity and efficiency. The work of a k-means algorithm is simply to make groups of similar data and show the density of the clusters the data points create. In the paper, the author discussed the mapping of customers based on their loyalty. The authors gave a detailed calculation of how the k-means algorithm works in order to find the best possible number of clusters, the elbow method is suggested with an accurate estimate [4]. The main focus of the paper is to make clusters of the verses of the Holy Qur'an. In the article, the authors talked about mining the text from the Holy Qur'an and applying the K-means algorithm to determine the number of steamed and unsteamed words in each cluster. The final visualization shows the different densities in each cluster [5]. The objective of the paper is to give a fast and efficient seeding method for text document clustering using the k-means algorithm. The authors suggested vectorizing the text document. After that, the initial seed point is select as far away from one another as possible ————————————————
• F. M. Javed Mehedi Shamrat is completed Bachelor’s degree program in Software Engineering at Daffodil International University, Bangladesh. Recently he is working as an Android Developer at ICT Division, Bangladesh. E-mail: [email protected]
• Zarrin Tasnim is currently completed Bachelor’s degree program in Software Engineering at Daffodil International University, Bangladesh. E-mail: [email protected]
• Dr. Imran mahmud is currently working as a Senior Lecturer at the graduate school of business, universiti sains Malaysia. He worked as an assistant professor at Daffodil International University, Bangladesh. He has several publications and received many awards in the field of technology management.
E-mail: [email protected]
• Ms. Nusrat Jahan completed Master's of Information Technology from the Jahangirnagar University, Bangladesh. She is currently working as a Senior Lecturer in software engineering dept. at the Daffodil International University, Dhaka, Bangladesh. She has published so many research articles. E-mail: [email protected]
2551 to get the best result. Furthermore, they compared the system
with Points, K-means++, and KMC2 seeding methods [6]. In the paper, the authors suggested using the k-means algorithm to cluster the student data to group the student based on their characteristics. The calculation and clustering are done with the help of the Weka 3.8.2 application. The research helps with strategic promotion for gaining perspective on students [7]. From the research gap, an unsupervised k-means clustering algorithm is proposed that takes the data job seekers who are interested in particular fields of jobs. This text data is preprocessed and vectorized in order to make it suitable for use as a dataset in the clustering algorithm. The algorithm clusters the data in similar groups based on the vectorized criteria and gives a visualization of the density of clusters denoting the
demandof the job.
3.
METHODOLOGY
The K-means algorithm is implemented. K-means algorithm is an unsupervised algorithm that takes a number of data points and groups them into a k number of clusters. Here k denotes the number of clusters, i.e., if k = 3, the number of clusters received in the end will be 3 clusters. In the k-means algorithm, data points a plotted across a scatter graph, and k number of clusters are set. K number of centroid will be formed in the graph. Computation will be done to the number of iteration set to find the data points nearest to the centroids based on Euclidean distance. After the maximum iteration, the clusters of data points around the centroids will be the final clusters. In the dataset, a list of job titles is available. It is the list of jobs, the candidate is doing or is interested in doing. At the same time, candidates search for the type of job they are willing to do in the search bar. As a result, the search record makes another list of jobs that are in demand among the job seekers. Merging the two lists, a dataset can be obtained that contains the data of jobs, job seeker is interested in. Using this data, we can identify the field of jobs people are most interested in and arrange for training sessions so that job seekers can become more professional and skilled in those particular fields and get better jobs. K-means algorithm makes a cluster of similar types of jobs from the dataset. In order to do that first, the data of job positions is retrieved from the database. At the same time, the search record from the search box of the website is stored in the database and merged with the data from the dataset. These data are categorized into different types and is vectorized as x-vector and y-x-vector. These values are used as x-axis and y-axis for the scatter graph of k-means. The number of clusters, k is set as the number of categories, and the number of iteration is set as required. After plotting the data point in the scatter graph, the distance between the points and centroids is calculated and reassigned up to the maximum number of iteration. Finally, a scatter graph with the required number of clusters is shown. From the graph, the cluster that is highly dense is the type of jobs, job seekers are most interested in, and workshops can be arranged to enhance their skills as those jobs are most demanded. Integration of K-means into a system using a recommended system by (Amin & Ramdhani, 2006). K-means is one of a clustering algorithm that uses the partition method. K-means is a clustering algorithm that divides each data item into a cluster. The steps are as follows:
• Define a number of cluster (k) at data set;
• Define a centroid. At the first step, the centroid is defined
randomly, while at the iteration uses a following formulation:
𝛻𝑖𝑗= 1 𝑁𝑖∑
𝑁𝑖
𝑘=0 𝑋𝑘𝑗 (1)
• At each record, quantify a nearest distance to the centroid.
The centroid distance used is an Euclidean Distance, by the following equation:
𝐷𝜃= √(𝑥𝑖 − 𝑠𝑖)2+ (𝑦𝑖 − 𝑡𝑖)2 (2)
• Group the objects based on the distance to nearest
centroid; and
• Repeat the second step, and do iteration until centroid reaches optimum value.
K-means algorithm makes a cluster of similar types of jobs from the dataset. In order to do that first, the data of job positions are retrieved from the database. At the same time, the search record from the search box of the website is stored in the database and merged with the data from dataset. These data are categorized into different types and is vectorized as x-vector and y-vector. These values are used as x-axis and y-axis for the scatter graph of k-means. The number of clusters, k is set as the number of categories, and the number of iteration is set as required. After plotting the data point in the scatter graph, the distance between the points and centroids is calculated and
2552 reassigned up to the maximum number of iteration. Finally a
scatter graph with the required number of clusters are shown. From the graph, the cluster that are highly dense are the type of jobs, job seekers are most interested in and workshops can be arranged to enhance their skills as those jobs are most demanded.
3.1. Algorithm 1: Data preprocessing for k-means
1. Import libraries;
2. Import dataset:
3. Declare variable1;
4. Set variable1 as dataset value; -> [ value is the job title]
5. object = create csv; -> [object created to create a csv file]
6. variable1 = lowercase; ->[convert string to lower case]
7. convert variable1 to dataframe;
8. initialize column variable2; 9. initialize column variable3;
10. for () { -> used to traverse through the data in dataframe
11. declare variable4;
12. set variable4 as data in dataframe in iteration 13. if variable4 contains “fashion designer” {
14. set variable2 cell as 2 + (0.01X random integer
between 1 to 90)
15. set variable3 cell as 2 + (0.01X random integer
between 1 to 90) 16. }
17. else if variable4 contains “medical” {
18. set variable2 cell as 4 + (0.01X random integer
between 1 to 90)
19. set variable3 cell as 4 + (0.01X random integer
between 1 to 90) 20. }
21. else if variable4 contains “chef” {
22. set variable2 cell as 6 + (0.01X random integer
between 1 to 90)
23. set variable3 cell as 6 + (0.01X random integer
between 1 to 90) 24. }
25. else if variable4 contains “graphic” {
26. set variable2 cell as 8 + (0.01X random integer
between 1 to 90)
27. set variable3 cell as 8 + (0.01X random integer
between 1 to 90) 28. }
29. else if variable4 contains “fire” {
30. set variable2 cell as 9 + (0.01X random integer
between 1 to 90)
31. set variable3 cell as 14 + (0.01X random integer
between 1 to 90) 32. }
33. else if variable4 contains “principal” or “teacher” or “curriculum” {
34. set variable2 cell as 4 + (0.01X random integer
between 1 to 90)
35. set variable3 cell as 1 + (0.01X random integer
between 1 to 90) 36. }
37. else if variable4 contains “faculty” or “lecturer” or “lab” or “research” {
38. set variable2 cell as 6 + (0.01X random integer
between 1 to 90)
39. set variable3 cell as 1 + (0.01X random integer
between 1 to 90) 40. }
41. else if variable4 contains “train” or “instruct” or “counsel” {
42. set variable2 cell as 8 + (0.01X random integer
between 1 to 90)
43. set variable3 cell as 3 + (0.01X random integer
between 1 to 90) 44. }
45. else if variable4 contains “manager” {
46. 46: set variable2 cell as 8 +
(0.01X random integer between 1 to 90)
47. variable3 cell as 11 + (0.01X random integer between
1 to 90) 48. }
49. else if variable4 contains “officer” or “service” {
50. set variable2 cell as 11 + (0.01X random integer
between 1 to 90)
51. set variable3 cell as 1 + (0.01X random integer
between 1 to 90) 52. }
53. else if variable4 contains “executive” {
54. set variable2 cell as 13 + (0.01X random integer
between 1 to 90)
55. set variable3 cell as 1 + (0.01X random integer
between 1 to 90) 56. }
57. else if variable4 contains “coordinator” {
58. set variable2 cell as 10 + (0.01X random integer
between 1 to 90)
59. set variable3 cell as 2 + (0.01X random integer
between 1 to 90) 60. }
61. else if variable4 contains “hr” {
62. set variable2 cell as 14 + (0.01X random integer
between 1 to 90)
63. set variable3 cell as 3 + (0.01X random integer
between 1 to 90) 64. }
65. else if variable4 contains “super” {
66. set variable2 cell as 12 + (0.01X random integer
between 1 to 90)
67. set variable3 cell as 4 + (0.01X random integer
between 1 to 90) 68. }
69. else if variable4 contains “merchan” {
70. set variable2 cell as 10 + (0.01X random integer
between 1 to 90)
71. set variable3 cell as 4 + (0.01X random integer
between 1 to 90) 72. }
73. else if variable4 contains “account” {
74. set variable2 cell as 12 + (0.01X random integer
between 1 to 90)
75. set variable3 cell as 6 + (0.01X random integer
between 1 to 90) 76. }
77. else if variable4 contains “direct” {
78. set variable2 cell as 14 + (0.01X random integer
2553
79. set variable3 cell as 5 + (0.01X random integer
between 1 to 90) 80. }
81. else if variable4 contains “audit” {
82. set variable2 cell as 10 + (0.01X random integer
between 1 to 90)
83. set variable3 cell as 8 + (0.01X random integer
between 1 to 90) 84. }
85. else if variable4 contains “man” or “represent” {
86. set variable2 cell as 10 + (0.01X random integer
between 1 to 90)
87. set variable3 cell as 6 + (0.01X random integer
between 1 to 90) 88. }
89. else if variable4 contains “inspect” {
90. set variable2 cell as 12 + (0.01X random integer
between 1 to 90)
91. set variable3 cell as 8 + (0.01X random integer
between 1 to 90) 92. }
93. else if variable4 contains “consultant” {
94. set variable2 cell as 14 + (0.01X random integer
between 1 to 90)
95. set variable3 cell as 8 + (0.01X random integer
between 1 to 90) 96. }
97. else if variable4 contains “online mark” {
98. 98: set variable2 cell as 14 +
(0.01X random integer between 1 to 90)
99. set variable3 cell as 10 + (0.01X random integer
between 1 to 90)
100. }
101. else if variable4 contains “admin” {
102. set variable2 cell as 12 + (0.01X random
integer between 1 to 90)
103. set variable3 cell as 10 + (0.01X random
integer between 1 to 90)
104. }
105. else if variable4 contains “operator” {
106. set variable2 cell as 12 + (0.01X random
integer between 1 to 90)
107. set variable3 cell as 8 + (0.01X random
integer between 1 to 90)
108. }
109. else if variable4 contains “analyst” {
110. set variable2 cell as 3 + (0.01X random
integer between 1 to 90)
111. set variable3 cell as 8 + (0.01X random
integer between 1 to 90)
112. }
113. else if variable4 contains “entry” {
114. set variable2 cell as 1 + (0.01X random
integer between 1 to 90)
115. set variable3 cell as 8 + (0.01X random
integer between 1 to 90)
116. }
117. else if variable4 contains “information” or “it
officer” or “it executive” or "it assistant" or "it support" {
118. set variable2 cell as 5 + (0.01X random
integer between 1 to 90)
119. set variable3 cell as 8 + (0.01X random
integer between 1 to 90)
120. }
121. else if variable4 contains “web” or
“programmer” or "software"{
122. set variable2 cell as 5 + (0.01X random
integer between 1 to 90)
123. set variable3 cell as 10 + (0.01X random
integer between 1 to 90)
124. }
125. else if variable4 contains “radio” or “rj”{
126. set variable2 cell as 1 + (0.01X random
integer between 1 to 90)
127. set variable3 cell as 12 + (0.01X random
integer between 1 to 90)
128. }
129. else if variable4 contains “freelan” {
130. set variable2 cell as 1 + (0.01X random
integer between 1 to 90)
131. set variable3 cell as 10 + (0.01X random
integer between 1 to 90)
132. }
133. else if variable4 contains “waiter” or "bar" or "guest" {
134. set variable2 cell as 8 + (0.01X random
integer between 1 to 90)
135. set variable3 cell as 8 + (0.01X random
integer between 1 to 90)
136. }
137. else if variable4 contains “editor” or "content" {
138. set variable2 cell as 8 + (0.01X random
integer between 1 to 90)
139. set variable3 cell as 5 + (0.01X random
integer between 1 to 90)
140. }
141. else if variable4 contains “freelan” {
142. set variable2 cell as 1 + (0.01X random
integer between 1 to 90)
143. set variable3 cell as 10 + (0.01X random
integer between 1 to 90)
144. }
145. else if variable4 contains “engineer” {
146. set variable2 cell as 10 + (0.01X random
integer between 1 to 90)
147. set variable3 cell as 10 + (0.01X random
integer between 1 to 90)
148. }
149. else if variable4 contains “rece” {
150. set variable2 cell as 5 + (0.01X random
integer between 1 to 90)
151. set variable3 cell as 12 + (0.01X random
integer between 1 to 90)
152. }
153. else if variable4 contains “law” or "paralegal" {
154. set variable2 cell as 7 + (0.01X random
integer between 1 to 90)
155. set variable3 cell as 10 + (0.01X random
integer between 1 to 90)
156. }
2554
158. set variable2 cell as 3 + (0.01X random
integer between 1 to 90)
159. set variable3 cell as 12 + (0.01X random
integer between 1 to 90)
160. }
161. else if variable4 contains “physio” {
162. set variable2 cell as 11 + (0.01X random
integer between 1 to 90)
163. set variable3 cell as 12 + (0.01X random
integer between 1 to 90)
164. }
165. else if variable4 contains “archi” {
166. set variable2 cell as 13 + (0.01X random
integer between 1 to 90)
167. set variable3 cell as 12 + (0.01X random
integer between 1 to 90)
168. }
169. else if variable4 contains “chemist” {
170. set variable2 cell as 5 + (0.01X random
integer between 1 to 90)
171. set variable3 cell as 14 + (0.01X random
integer between 1 to 90)
172. }
173. else if variable4 contains “news” {
174. set variable2 cell as 3 + (0.01X random
integer between 1 to 90)
175. set variable3 cell as 14 + (0.01X random
integer between 1 to 90)
176. }
177. else if variable4 contains “call” {
178. set variable2 cell as 1 + (0.01X random
integer between 1 to 90)
179. set variable3 cell as 14 + (0.01X random
integer between 1 to 90)
180. }
181. else if variable4 contains “field” {
182. set variable2 cell as 7 + (0.01X random
integer between 1 to 90)
183. set variable3 cell as 14 + (0.01X random
integer between 1 to 90)
184. }
185. else if variable4 contains “entrepreneur” or
“self” {
186. set variable2 cell as 9 + (0.01X random
integer between 1 to 90)
187. set variable3 cell as 12 + (0.01X random
integer between 1 to 90)
188. }
189. else if variable4 contains “intern” or
"apprentice" or "no exp" {
190. set variable2 cell as 7 + (0.01X random
integer between 1 to 90)
191. set variable3 cell as 12 + (0.01X random
integer between 1 to 90)
192. }
193. else {
194. set variable2 cell as 0 + (0.01X random
integer between 1 to 90)
195. set variable3 cell as 0 + (0.01X random
integer between 1 to 90)
196. }
197. Increment value;
198. }
3.2. Algorithm 2: Implementing the k-means clustering algorithm
1. Import library;
2. Import dataset;
3. Object = kmeans_value(); -> [ calculate k means value with 27 clusters, kmeans++ method of initialization, random state as 42]
4. declare variable1;
5. set variable1 as compute cluster center and predict
cluster index for each data ;
6. declare variable2;
7. set variable2 as dataframe of variable1;
8. rename column as “km”;
9. declare variable3;
10. set variable3 as new column;
11. set variable3 value as index;
12. variable2 = drop_duplicate(); -> drop row of duplicate value by column=”km” and keep the first value 13. variable2= sort(); -> sort dataframe by column=”km” 14. variable2 = reset index
15. declare variable4
16. set variable4 as new column;
17. declare variable5;
18. set variable5 as array by variable3
19. for(){ -> used to traverse through the information 20. set variable4 as data in dataset; -> row as variable5 and
2nd column
21. }
22. declare variable6;
23. set variable6 as array of colors;
24. set graph size;
25. for() { -> used to traverse through the number of iteration 26. plot scatter(); -> set x co-ordinate, y co-ordinate, size of
data points, color code as variable6, label as variable4 27. set graph title
28. set x axis label 29. set y axis label
30. set legend box position
31. display the graph
4 RESULT
AND
IMPLEMENTATION
To develop the system, python programing language is used, and some of python's default libraries are used. Data retrieving, pre-processing, and algorithm implementation is done using raw python coding. This process can be used by any system to make clusters of data.
2555
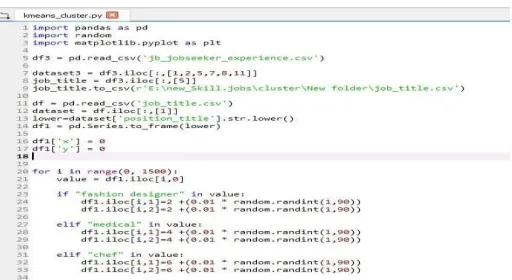
Fig. 3: Code of Data Pre-processing for Clustering (2).
In figure 2 and 3, at first, the panda library is imported, which is a tool for analyzing data in python programming. At the same time, random is imported to generate random numbers and matplotlib.pyplot is imported in order to generate the scatter graph for clustering. The data of job seekers job experience is retrieved from a CSV file named "jb_jobseeker_experience” using the panda library. From this dataset, only the “position_title" is extracted into a new dataset for clustering. The new dataset is then preprocessed in order to categorize by converting every letter to a lower case. Two new rows are added to save the x vectors and y vectors. The jobs are categorized based on the type of jobs, and vector values are set such that the same type of jobs are assigned close values.
Fig. 4: Dataset before pre-processing for Clustering.
In figure 4, the dataset contains the raw data gathered from the job seekers' profile. This data is retrieved from the database, and only the "position_title” is used to create the cluster of jobs.
Fig. 5: Dataset after Pre-processing for Clustering.
In figure 5, a new dataset is created using the “position_title” that contains a row of all the job positions of the job seekers registered into the website. After categorizing each job into different categories, vector values, x-vector and y-vector is set.
Fig. 6: Code of K-means Algorithm Implementation and
Graph Plotting.
2556 contains the data from the dataset containing the "position_title”
from the location of the “y_kmeans” vector numbered row and “position_title” column. This new column of “km_df” dataframe will later work as the label for each cluster. Finally, to create the scatter graph of size (10,10), a for loop is used with 29 iterations as the number of clusters is expected to be 29. Using matplotlib library the graph is constructed. To plot the graph using X dataset, [y_kmeans == i, 0] and [y_kmeans == i, 1] indicates the for loop iteration (i) number coordinate of data x and y respectively. “s=1” indicated the sized of the point to be plotted and “label= km_df.iloc[i,2]" Indicated that the label named to be plotted from the "km_df” data frame. Titling the graph as 'Clusters of jobs', x-axis as 'x vector', y-axis as 'y vector' and placed the legend at a distance of (1.0, 1.0) from the graph, the scatter graph of the k-means cluster algorithm is constructed.
Fig. 7: Dataframe Containing Labels of each Cluster.
In figure 7, the dataframe contains the values of “y_kmeans” in the “km” column with the respective index number of the “position_title” for which the “y_kmeans” vector was set. Matching the index, the “position_title is add in the dataframe in the “job” column.
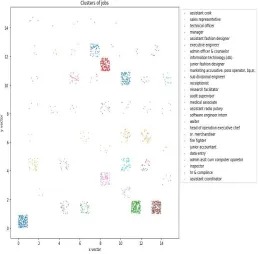
Fig. 8: K-means Cluster of types of Jobs.
The final scatter graph (figure 8) is shown that indicates 29 different clusters in along with a color code legend. Analyzing the density of each cluster, in can be identified which job is in most demand among the job seekers and training sessions or skill enhancement programs can be arranged in order to prepare or improve the skills of the job seekers so that they can find better jobs.
5 CONCLUSION
The proposed system provides tremendous amount of information about job demand. The system implements a k-means clustering algorithm. The vectorized value of the job titles of job seekers are used as the data points to make clusters of same kinds of jobs. The density of the clusters determine which job is in demand among the job seekers. This information helps the not only the job seekers who are looking for job right now but will eventually help any person who is trying to select a field of study or future profession by studying the market demand. At the same time, the training course can be arranged by different companies based on demanded fields where job seekers can enhance their skills to stay ahead in the competitive job market. To help the users of the system further, the entire system can be fully automated using artificial intelligence.
ACKNOWLEDGMENT
The authors are grateful and pleased to all the researchers in this research study.
REFERENCES
[1] Bataineh K M, Naji M and Saqer M 2011 A Comparison Study Between Various Fuzzy Clustering Algorithms. Jordan Journal of Mechanical and Industrial Engineering (JJMIE) 5 p335
2557 Journal of Theoretical and Applied Information Technology
(JATIT) 90 p 23
[3] Bain K K 2015 Customer Segmentation of SMEs Using
K-Means Clustering Method and modeling LRFM,
International Conference on Vocational Education and Electrical Engineering, Universitas Negeri Surabaya [4] M A Syakur, 2B K Khotimah, 3E M S Rochman and B D
Satoto, “Integration K-Means Clustering Method and Elbow Method For Identification of The Best Customer Profile Cluster”, IOP Conf. Series: Materials Science and Engineering 336 (2018) 012017
[5] Cepy Slamet, Ali Rahman, Muhammad Ali Ramdhani, and
Wahyudin Darmalaksana, “Clustering the Verses of the Holy Qur’an using K-Means Algorithm” , Asian Journal of Information Technology 15(24): 5159-5162, 2016
[6] Eshan Sherkat, Julien Velcin and Evangelos E. Milios , “Fast and simple deterministic seeding of Kmeans for text document clustering”, 9th International conference of the CLEF Association, CLEF 2018
[7] Satria Abadi, Kamarul Shukri Mat The, Badlihisham Mohd
Nasir, Miftachul Huda, Natalie L. Ivanova, Thia Indra Sari, Andino Maseleno, Fiqih Satria and Muhamad Muslihudin, “Application model of k-means clustering: insights into promotion strategy of vocational high school”, International Journal of Engineering & Technology, 7 (2.27) (2018) 182-187
[8] Sankar, R., 2011. Customer Data Clustering Using Data.
International Journal of Database Management
Systems, 3, 1-11.
[9] Pamoragung, A., Suryadi, K., and Ramdhani, M. A.,
“Enhancing the Implementation of e-Government in Indonesia Through the High-Quality of VirtualCommunity
and Knowledge Portal.” 6th European
Conference on e-Government (pp. 341-347). Marburg: Academic Conferences Limited.(S2006)
[10]Yauri, A. R., Kadir, R. A., Azman, A., Azrifah, M., and Murad, A., “Quranic Verse Extraction base on Concepts
using OWL-DL Ontology.” Research
Journal of Applied Sciences, Engineering and Technology, 6, 4492–4498.( 2013)
[11]Bhatia, M. P., and Khurana, D., “Analysis of Initial Centers
for k-Means Clustering Algorithm.”
International Journal Computer Application, 71, 9- 12.(2013)
[12]Bain K K, Firli I, And Tri S 2016 Genetic Algorithm For
Optimized Initial Centers K-Means
Clustering In SMEs, Journal of Theoretical and Applied
Information Technology (JATIT) 90 p
23
[13]Bain K K 2015 Customer Segmentation of SMEs Using
K-Means Clustering Method and
modeling LRFM, International Conference on Vocational
Education and Electrical Engineering,
Universitas Negeri Surabaya
[14]Gursharan S, Harpreet K and Gursharan S 2014 A Novel
Approach Towards K-Mean Clustering
Algorithm With PSO, International Journal of Computer
Science and Information Technologies
(IJCSIT) 5 p 5978
[15]Madhulatha T S 2012 An Overview On Clustering Methods,
IOSR Journal of Engineering 4 p 719
[16]Sujatha S and Sona A S 2013 New Fast K-Means
Clustering Algorithm using Modified Centroid
Selection Method. International Journal of Engineering Research & Technology II 2 p1
[17]Cosmin M P, Marian C M, Mihai M An Optimized Version of
the K-Means Clustering
Algorithm, Proceedings of the 2014 Federated Conference
on Computer Science and Information