1577
ASSESSING WEB SURFACE CREDIBILITY
BY GENERATION Y: A Q METHODOLOGICAL STUDY
Stanislav Mokrý
11 Department of Marketing and Trade, Faculty of Business and Economics, Mendel University in Brno,
Zemědělská 1, 613 00 Brno, Czech Republic
To link to this article: https://doi.org/10.11118/actaun201967061577 Received: 3. 6. 2019, Accepted: 20. 9. 2019
To cite this article: MOKRÝ STANISLAV. 2019. Assessing Web Surface Credibility by Generation Y: A Q methodological Study. Acta Universitatis Agriculturae et Silviculturae Mendelianae Brunensis, 67(6): 1577–1585.
Abstract
Online marketing includes a variety of activities. Website presentation is one of the most striking. For many business providers it is vital to have a web-site and therefore there are currently more than 1.8 billion websites on the Internet. This situation has an impact on people who access the sites in terms of problems of decision making and confidence in the credibility of the website. This article deals with so-called surface credibility and analyses research data using the Q-method. The research was conducted with 70 respondents from generation Y. 40 anonymized web pages were used as sorted variables. The web pages were divided into 8 categories: financial institutions, universities, educational institutions, travel, lifestyle, commodity search engines, e-shops, health. Four factors were extracted and described. According to our study, the design quality; previous experience and similarity; graphical elements, website layouts and institutional framework are main elements playing the key role when assessing web surface credibility by generation Y. The main contribution of this article lays in its methodological approach by using Q-method in the innovative context of analysing web sites.
Keywords: web credibility, Q methodology, marketing communication
INTRODUCTION
The phenomenon of web-site credibility is a relatively recent development brought about by the increased influence of the internet on daily life. An unthinkable idea in the 90’s, the rise of mobile devices means it is now a matter of course that we can be online non-stop. Mass use of the internet has also brought a significant change among consumer´s behaviour which has started to reveal itself in all stages of the purchasing decision process (Peterson et al., 1997). In the initial stages of the process, the internet acts not only as an external stimulus making consumers aware of their needs, but also as an important source of independent information which the consumer can access during the phases of researching, evaluating and final purchase decision-making (Liu, 2007). Factors in the later stages – post purchase behaviour – is a topic by itself and not dealt with in this article
(see also Wolfinbarger, Gilly, 2001; Committee on Internal Market and Consumer Protection, 2011). In accordance with this transition, a new issue emerged: How do consumers determine if the specific website, e-shop, on-line reviews, social media with all its posts, emails and other on-line sources of information are credible?
1578 Stanislav Mokrý
Stacks and Salwen (2009) defines credibility as multidimensional construct including believability, trust, accuracy, fairness, objectivity and other factors. Fogg and Tseng (1999) reported believability and expertise to be the two most important factors: believability in the sense of willingness; expertise in the sense of the ability to provide accurate information (Hovland, Janis and Kelley, 1953). As stated by Lankes (2008) online credibility differentiates itself from the credibility of traditional media in two ways:
1. there are no fixed enforceable standards for information published online;
2. responsibility for accepting information as credible is mediated, i.e., transferred to the person accessing the web-site.
One of the most well-known studies dealing with the issue of online credibility is the 2001 study by Persuasive Tech Lab at Stanford University (Fogg, Swani and Treien, 2001). In this study Fogg et al. (2001) determined seven categories which affect the credibility of websites:
1. Physical background of the organization running the website (real address, genuine customer services/contact centre, etc.);
2. Simplicity of website usage (logical structure, searching, etc.);
3. Product or Service Specific Academic Expertise (e.g., medical websites);
4. Technical Reliability of the web-site;
5. Personalization (e.g., user registration, use of cookies, etc.);
6. Commercial inserts (advertisements)
7. Amateurism (working links, errors, update, etc.). Fogg consequently followed his work with a new study (Fogg et al., 2003), in which he investigated factors that affect visitors to the website and which details they notice the most. In this study, one hundred websites were arranged into ten different thematic categories where each category contained ten different websites of the same topic. Based on results from this study, web design and appearance are considered to be one of the most significant attributes influencing the credibility of website. Other important factors include information structure and information coverage. Fogg (2003b) also describes four types of web credibility: presumed credibility, surface credibility, earned credibility and reputed credibility. Presumed credibility is based on general assumptions in the user’s mind; the surface credibility is based on a first impression of the user; earned credibility is established over time; reputed credibility is connected with offline experiences, such as recommendations. According to Lazar, Meiselwitz and Feng (2007) presumed credibility, surface credibility and earned credibility are largely influenced by user’s individual judgment, background and experiences. Bart et al. (2005)
conducted an exploratory study with a focus on developing a conceptual model that links website and consumer characteristics, online trust and behavioural intent. According to this study, within different website exist different drivers (website characteristics) of online trust and different segments have a different perception of these drivers.
Another approach toward the evaluation of website credibility and trust is based on the use of cognitive heuristics. Metzger and Flanagin (2013) describe six types of heuristics to evaluate website credibility:
1. the reputation heuristic, 2. the endorsement heuristic, 3. the consistency heuristic, 4. the self-confirmation heuristic, 5. the expectancy violation heuristic and 6. persuasive intent heuristic.
As new technologies are developed, the issue of credibility in social networks Q&A (Jeon and Rieh, 2014) or Twitter (Wasike, 2017) becomes even more significant. Another trend in the assessment of website credibility is focussing on credibility of a selected area, e.g. credibility of health-related websites (Machackova and Smahel, 2018).
Methodology of Q-sorting
The use of Q-method offers systematic study of the subjectivity of respondents (Belk, 2010). The goal of this method is to systematically describe and compare the subjective views of the respondents, not to determine and segment the distribution of preferences across populations (Dewar, Li, Davis, 2007). Q-method permits both the study of various social discourses, and the ability to compare cognitive approaches of individual members of these groups to the given issue.
Its origins date back to the mid-1930s, when it was first introduced by British psychologist and physicist William Stephenson, who was the assistant to Charles Spearman, the founder of factor analysis (Watts and Stenner, 2012). From the very beginning, there is a close link between the Q-method and factor analysis. However, while factor analysis seeks correlations between variables across the sample of subjects, Q-method searches for correlations between entities or elements of the sorted subjects within the entire sample of variables. Therefore, Q-method was initially referred to as inverse factor analysis (Stephenson, 1936). In terms of its classification, it is possible to refer to Q-method both as a qualitative method (considering the subjectivity with which it operates) and as a quantitative method (due to the subsequent mathematical and statistical process of processing of sorted elements) (Tashakkori and Teddlie, 2010). Since Q-method can be categorized as a qualitative or quantitative research method, using this method allows the combination of the strengths of both qualitative and quantitative research methods (Baker, 2006).
Another particular feature of Q-method lies in terminology. Implementation process and realization of the Q-methodological approach is called Q-Technique; usually consists of five parts: 1. Definition of the concourse;
2. Q-sample formation; 3. P-set selection; 4. Q-sort/distribution;
5. Analysis and interpretation (Brown, 1993). In the first place, it is necessary to define the area of research thoroughly, including collecting material relevant to research (newspaper articles, statements, drawings, objects, photographs, recordings or other research related material) (Brown, 1996). In the next phase, a Q-sample is created. It contains the material units selected for sorting – typically 30 or more items selected as representative of a particular field (Brown, 2008). Then the selection of the P-sample follows, it is a group of Q-specimen sorting respondents; the choice of respondents should correspond with the subject of the research. Subsequently, Q-sorting takes place where the attitudes of the individual respondents are divided and later analysed. The main output of Q-method is therefore the distribution of respondents into groups that are structured according to their answers. The aim is to categorize the respondents into individual groups (Van Exel and de Graaf, 2005).
The last part of Q-technique is the analysis and interpretation of the results; the main objective is to identify and determine the group’s opinion. It is of primary importance to consider the representative items that were rated positively or negatively by the group, as well as the items ranked higher or lower than other groups. Putting these results into the
context of demographic data is also appropriate for Q-method (Watts, Stenner, 2012). The result should be a holistic interpretation of the results describing the character and position of the groups.
Aim of the Study
The purpose of this study is to identify and determine approaches toward the evaluation of surface credibility of websites by using of Q-sorting analytical method. According to previous studies, the evaluation of web credibility is subjective. Thus, the use of this method seems to be appropriate, extending the existing approaches to the assessment of website surface credibility. Another goal is to demonstrate the use of Q-method sorting in an on-line environment where the websites are used as samples sorted.
MATERIALS AND METHODS
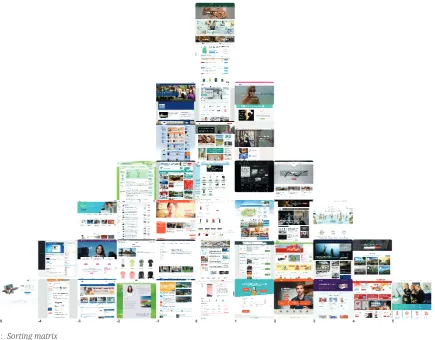
Our research was conducted via online research laboratory UMBRELA, which is supported by the Department of Marketing and Trade FBE MENDELU in Brno. The research consisted of two sections. The first part was built on the online application Q-method 2.0 that can provide Q sorting of images. The Q-method application was implemented as a web application used to run so-called Q-sorting via the web interface. Apache2, running on the Linux operating system, Ubuntu distribution, was used as the server. Backend Web Application was programmed in PHP 7.1 using the Nette framework, which served primarily as an interface between PostgreSQL database system and the client application. A substantial part of the application’s user interface was written in JavaScript. The main building element of the front-end of the application was the React library. Together with the Redux and ReactDND packages, it formed the basis for a fast and user-friendly interface that works in all modern web browsers. ReactDND, along with the other HTML5 backend packages, were used to develop Drag & Drop environments for easy user application control when allocating individual stimuli according to Q-method rules. Within the first part, participants were instructed to quickly revisit websites presented in a stack and then sort them into normal distribution shaped matrix. Example of a matrix fulfilled with websites is presented in Fig. 1. Due to the focus of the study on surface credibility, participants were instructed to base their evaluation on the first impression of the website. To speed up the process of evaluation the websites were presented in form of an image, thus it was not possible to use URL links presented within evaluated websites.
1580 Stanislav Mokrý
wrote down all the important information into a prepared questionnaire form.
For the collection of Q-samples, the focus group session with eight participants from generation Y was conducted. The main aim of this focus group session was to collect examples of websites the Czech and Slovak generation Y can come into
contact. The output of this focus group was a collection of 110 websites that were then classified into eight categories. For the purpose of this study, 40 websites were selected with the intention to present all different web layouts. The number of sites was selected due to the technical limitation of the online application Q-method 2.0. This
1
Figure 1: Sorting matrix
2
Source: own research
3
4
5
6
7
8
9
10
11
12
13
14
15
16
17
18
19
20
21
22
23
1: Sorting matrix
Source: own research
I: List of stimuli used in study
lifestyle redbull.cz(26) countrylife.cz(5) prozeny.cz(23) muzivcesku.cz(20) wazka.cz(37)
healthcare medicina.cz(19) esthe-plastika.cz(7) stkprochlapy.cz(30) surgalclinic.cz(32) cdc.gov(3)
courses seduo.cz(28) helpforenglish.cz(12) thenewboston.com(21) khanovaskola.cz(15) coursera.org(6)
traveling hedvabnastezka.cz(11) cestujlevne.com(4) theblondeabroad.com(2) travelguide.sk(34) booking.com(1)
financial institutions hsbc.com(10) prvniklubova.cz(24) zonky.cz(39) rbs.com(25) tatrabanka.sk(33)
e-shops rohlik.cz(27) kosik.cz(17) knihycz.cz(16) softcom.cz(29) zoot.cz(40)
universities harvard.edu(9) kpfu.ru(14) udg.edu(36) lapinamk.fi(18) fontys.edu(8)
Assessing Web Surface Credibility by Generation Y: A Q methodological Study 1581
application was optimized for a 24-inch screen with resolution 1900 × 1200 and it was unable to sort the higher number of websites in the selected working space. There were eight categories of websites:
lifestyle, healthcare, education – courses, traveling, financial institutions, e-shops, universities, commodity search engines (CSE). Within each category there were five websites, see Tab. I. According to Bart
et al. (2005), brand strength is a dominant driver of online trust for the majority of consumers. To minimize the influence of the brand strength effect, all the websites used within our study were anonymized so the logo, website name and brand were removed.
In total 70 students of Mendel University in Brno participated in our research. Respondents were recruited from students specializing in management or informatics. For processing the data, an R package to analyze Q methodology data was used. This R package was created by Zabala (2014).
RESULTS
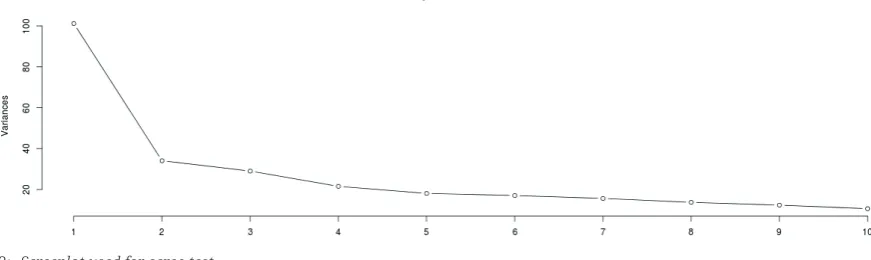
A total of 70 Q sorts were intercorrelated and factor analysed. According to Watts and Stener (2012) the scree test was used to indicating the number of factors which were extracted from the data set. The change of slope after factor 4 is noticeable from Fig. 2. For rotating of factors varimax rotation was used.
Factor values for each stimulus (evaluated website) is presented in Tab. II. Four study factors account for 54 out of 70 Q sorts. Our extracted factors together explain 48.82% of study variance.
Factor f1 is loaded with 19 Q sorts and represents 17.33% of study variance. Out of 19 Q sorts, there are 11 men and 8 women. The most preferred item in this factor is website No. 5 countrylife.cz. Country Life is ecological centre and its website is focused on promotion of ecological and BIO products. Website itself also contain e-shop section, but during our research, participants visited just section focused on information and education activities. Regarding the elements of website which can increase credibility,
this website contains contact information and social icons referring to social media profiles but the references, testimonials, trust seals or awards are not presented. So, why this site has top evaluation in this factor? According to information gathered from participants, the main reason for positive evaluation is graphical design. Website is modern and vivid with more than 10 colourful images with dominant green accent referring on its main mission – the ecological products. On the opposite site is website No. 19 medicina.cz ranked -5. This website is focused on the publication of health-related information. Visitors can find information about different topics such: Abstinence, Contraception, Medical clinic, First aid, Sex and health, Oncology, etc. Authors of content on this website are medical doctors. The information about author is only presented in text form so it is impossible to contact selected doctor. On the website, there are only few images and whole layout is in form of blocks of text. Main significant graphic elements are top logo and at least two ads that line the main text part. Absence of contact information, obsolete design and presence of ads are the main explanation of our participants to evaluate this website as the worst among other websites in factor f1. In closer look to websites ranked by factor f1 higher than any other factors, we can see websites with accent on graphical design. For example, website No. 2. theblondeabroad. com
ranked by factor f1 +3 represents modern blog about traveling. Website itself contain plenty of images illustrating destinations visited by author of this blog. Layout of website can be described as modern with vertical blocks bordering important sections. Another example of website with accent on graphical design is website No. 24 prvniklubova. cz.
This website informs about financial institution. What differs this website from the others is minimal presence of photographs. Instead of them, the dominant graphical elements are sketched cartoons that are used as examples of products to describe offer of this institution. Another example of accent of the factor f1 on the graphical design of website is website No. 16 knihycz.cz. This website is categorised as e-shop and was ranked -4 by factor
A total of 70 Q sorts were intercorrelated and factor analysed. According to Watts and Stener
24
(2012) the scree test was used to indicating the number of factors which were extracted from
25
the data set. The change of slope after factor 4 is noticeable from figure 1. For rotating of factors
26
varimax rotation was used.
27
28
29
30
Figure 1: Screeplot used for scree test
31
32
33
34
35
36
37
38
39
40
41
42
43
44
45
46
47
48
49
Table 2: Statement factor scores
50
2: Screeplot used for scree test
1582 Stanislav Mokrý
f1. Main complaints were addressed to its obsolete design, i.e.: small texts and images, narrow main part and presence of ads banners. According to this information, the factor f1 can be described as group accenting visual attractiveness when deciding about website credibility.
Factor f2 is loaded with 13 Q sorts and represents 12.40% of study variance. Out of 13 Q sorts, there are 3 men and 10 women. As the most preferred item was selected website No. 13 heureka.cz. This website belongs to category CSE and presents the most used Commodity Search Engine in the Czech Republic and Slovakia. Even that this website was anonymized, Czech and Slovak public very well knows its layout. Therefore, such similarity with the well-known and renowned website was the main reason for respondents from factor f2 to state that this website is clear winner when deciding about credibility. The least preferred website of factor f2 was site of Slovak financial institution
tatrabanka.sk. As a reason of such evaluation, our respondents stated that even though the web site itself contains information about financial products and also there are some Trust Seals (options to download mobile applications from Apple App Store, Google play store, etc.) the design is the main reason to not to trust such website. Dominant colour of website tatrabanka.sk is black with contrast white and the layout of website was quite narrow in comparison to other websites. In this case the design was not obsolete like in case of web No. 16 or 19 ranked by factor f1 as the least thrust worth websites but for participants from factor f2 mainly the colour combination and layout was the main reason to vote this website as the least credible. As one participant mentioned: “Such design reminds me pop-up windows with lottery games which jump on me when accidentally click on unknown link in junk mail.” Among the websites ranked by factor f2 higher than any others factors were website No. 40 representing e-shop zoot.cz
(ranked +4) and website No. 38 representing CSE
zbozi.cz (ranked +3). Same as in case of top-rated website of this factor (website No. 13), participants in this case mentioned similarity with the original websites as the main reason for such high ranking. The website ranked significantly lower than any other factors was website No 15: khanovaskola.cz. In this case, participants could see only initial portal website with limited amount of information about company/project. More information and content of courses were available after login via Facebook or Google account or via email. On the website, the expressive graphic element – an owl – was used to demonstrate focus on the field of education. Other graphic elements were handwritten text referencing the main topics of courses available on the portal. Such a minimalist design with minimal information was the main reason why the site No. 15 was evaluated negatively by factor f2. In general, factor f2 can be described as factor that
emphasizes traditional graphical elements and website layouts in process of evaluation of website credibility. For this factor is also important previous experience and references gained from outside of website itself.
Same as factor f2, factor f3 is loaded with 13 Q sorts. This factor represents 10.22% of study variance and gender distribution of sorts were 7 men and 6 women. In this factor, the most preferred website was website No. 9 presenting Harvard University harvard.edu. In addition, the other websites ranked higher than any other factors are from category universities: website No. 8 – fontys.edu (Dutch Fontys University of Applied Sciences ranked +4), website No. 14 – kpfu.
ru (Russian Kazan University ranked +4), website No. 18 (Finnish Lapland University of Applied Sciences ranked +3) and website No. 36 – udg. edu (Italian Universitat de Girona ranked +3). According to information from our respondents, the preference of universities during rating of credibility of websites was mainly because the university represents an institution that, by its very nature, has clearly defined intent and mission, and its credibility is thus indisputable. On the opposite side of scale, the factor f3 placed website No. 31 that presented CSE category – mysupermarket.co.uk. In addition, other websites representing CSEs were ranked by the factor f3 lower in comparison with other factors. For example, website No. 22 – nextag. com (ranking -4), No. 38 – zbozi.cz (ranking -1). This factor also rated negatively websites from category e-shops – website No. 17 – kosik.cz with rating -2 and lifestyle websites – website No. 23 – prozeny. cz (ranking -3). According to this information, the factor f3 can be described as factor with accent on an institutional framework of evaluated website.
DISCUSSION
According to our results, we can derive the main approaches in the group evaluation of a set of websites. First attitude to evaluation of credibility is design oriented. This group of participants bring the final decision in relation to visual presentation of website. Thus, modern attractive design that support (or communicate) the approach and intent of website itself is necessary. Second attitude was oriented to previous experience and similarity with evaluated website and graphical elements and website layouts. These groups of participants were focussing mainly on their previous experience or
references they can gather from outside of the website. The last attitude toward evaluation of website credibility was based on institutional framework of evaluated website. These respondents tried to think about organization that is “standing behind” the website more than website itself. Still during the decision about credibility of website the design and elements supporting the intent of website itself is necessary. Our research also demonstrates that during evaluation of website credibility the problematic parts such as mistakes in design (e.g. missing icons, obsolete design) or presence of banners make website less credible than in case these problems are not present. Our conclusions are in line with the conclusions of study of Fogg et al. (2001) and, in particular, with the focus on organization background, expertise of website, commercial insertion into website and amateurism in design. Design itself is influenced by an individual judgment and experiences of users as we can see on example of factor f2. Using of modern unconventional design can be perceived as something leading to lower credibility of such website.
In the context of four types of credibility defined by Fogg (2003b), we can see that it is practically impossible to strictly isolate one kind of credibility from each other. Even though our participants were instructed to quickly evaluate websites based on their “surface”, only participants of the factor f1 can be specified as surface oriented when evaluating websites. Similarly, if we focus on a heuristic approach toward the evaluation of website credibility and trust (Metzger and Flanagin, 2013), it is impossible to operate with just one heuristic when evaluating a set of websites such like in our study.
According to information gathered from participants during interview, the forced-choice distribution used in our research was sometimes too restrictive and limiting. Alternatively, it would be possible to use free distribution which allows the participants to assign any number of items to any of the available ranking values. Forced-choice distribution versus free distribution is discussed by Watts and Stenner (2012). In their recommendations these authors tend to use forced-choice distribution mainly due to additional problems not only for researchers with processing of data but also for participants in sense of making whole load of extra decisions. In the light of this finding, it would be possible to verify the use of “free distribution” in further research. Unfortunately, current version of software used for our research cannot provide such setting.
II: Statement factor scores
3
Stimulus (category) f1 f2 f3 f4
1 - traveling 0 3 3 2
2 - traveling 3 -1 0 1
3 - healthcare 1 0 1 -2
4 - traveling 3 1 1 1
5 -lifestyle 5 4 2 1
6 - courses 0 2 2 1
7 -healthcare 2 2 2 3
8 - universities 1 0 4 -1
9 - universities 1 2 5 3
10 - financial institutions -1 -3 1 0
11 - traveling -3 -2 0 -4
12 - courses -4 -4 -4 -3
13 - CSE 0 5 -1 2
14 - universities 0 3 4 -1
15 - courses 2 -4 -2 -2
16 - e-shops -4 0 -3 -3
17 - e-shops -1 1 -2 4
18 - universities 0 0 3 -1
19 - healthcare -5 -3 -2 -4
20 - lifestyle 2 -2 -1 0
21 - courses -2 -3 -3 -5
22 - CSE -3 0 -4 -1
23 - lifestyle 1 -2 -3 -1
24 - financial institutions 4 -1 0 1 25 - financial institutions 0 -1 2 0
26 - lifestyle 1 -2 0 2
27 - e-shops -1 0 -2 0
28 - courses 0 1 1 4
29 - shops -1 1 -1 0
30 - healthcare 3 1 1 0
31 - CSE -3 -1 -5 -1
32 - healthcare -2 -1 0 -2
33 - financial institutions -2 -5 -1 5
34 - traveling -2 1 0 0
35 - CSE 0 2 0 3
36 - universities -1 -1 3 -2
37 - lifestyle -1 0 0 -3
38 - CSE 2 3 -1 1
39 - financial institutions 4 0 -1 0
40 - e-shops 1 4 1 2
51
Item ranked +5 Item ranked -5
Item raked higher than any other factors Item ranked lower than any other factors
1584 Stanislav Mokrý
CONCLUSION
Decision about website credibility is a complex process in that has to be considered many factors. Within our research, we let the group of participants decide about the credibility of a set of 40 websites. Already during the investigation, it turned out that each decision was, in its essence, the original solution. To simplify the evaluation, we used the Q-sorting method. According to our study, the design quality; previous experience and similarity; graphical elements, website layouts and institutional framework are main elements playing the key role when assessing web surface credibility by generation Y.
Acknowledgements
This paper was supported by the project CZ.02.1.01/0.0/0.0/16_017/0002334 Research Infrastructure for Young Scientists, co-financed by Operational Programme Research, Development and Education.
REFERENCES
JEON, G. Y. J. and RIEH, S. Y. 2014. Answers from the Crowd: How Credible are Strangers in Social Q&A? In: iConference 2014 Proceedings. iSchools, pp. 663–668.
BAKER, R. M. 2006. Economic rationality and health and lifestyle choices for people with diabetes.
Social Science & Medicine, 63(9): 2340–2353.
BARRY, J. and PROOPS, J. L. 2000. Citizenship, sustainability and environmental research: Q methodology and local exchange trading systems. Northampton, MA, USA: Edward Elgar.
BART, Y., SHANKAR, V., SULTAN, F. and URBAN, G. L. 2005. Are the drivers and role of online trust the same for all web sites and consumers? A large-scale exploratory empirical study. Journal of Marketing, 69(4): 133–152.
BELK, R. W. (Ed.). 2010. Research in Consumer Behaviour. 1st Edition. Bradford: Emerald Group Pub.
BROWN, S. R. 1993. A primer on Q methodology. Operant Subjectivity, 16(3/4): 91–138.
BROWN, S. R. 1996. Q Methodology and Qualitative Research. Qualitative Health Research, 6(4): 561– 567.
BROWN, S. R. 2008. Q Methodology. In: GIVEN. L. M. (Ed.). The Sage encyclopedia of qualitative research methods. Los Angeles, CA: Sage Publications.
CARTER, R. F. and GREENBERG, B. S. 1965. Newspapers or Television: Which Do You Believe?
Journalism & Mass Communication Quarterly, 42(1): 29–34.
COMMITTEE ON INTERNAL MARKET AND CONSUMER PROTECTION. 2011. Consumer behaviour in a digital environment. Report. Brussels: European Parliament.
DEWAR, K., LI, W. M. and DAVIS, C. H. 2007. Photographic Images, Culture, and Perception in Tourism Advertising, Journal of Travel & Tourism Marketing, 22: 2, 35–44.
FOGG, B. J. and TSENG, H. 1999. The elements of computer credibility. In: Proceedings of the SIGCHI conference on Human factors in computing systems the CHI is the limit – CHI ‘99. New York, NY: ACM Press, pp. 80–87.
FOGG, B. J., SWANI, P., TREINEN, M. et al. 2001. What makes Web sites credible? In: Proceedings of the SIGCHI conference on Human factors in computing systems – CHI ‘01. New York, NY: ACM Press, pp. 61–68.
FOGG, B. J., SOOHOO, C., DANIELSON, D. R., MARABLE, L., STANFORD, J. and TAUBER, E. R. 2003a. How do users evaluate the credibility of Web sites? In: Proceedings of the 2003 conference on Designing for user experiences – DUX ‘03. New York, NY: ACM Press.
FOGG, B. J. 2003b. Persuasive technology: using computers to change what we think and do. Boston: Morgan Kaufmann Publishers.
GOLDMAN, I. 1999. Q Methodology As Process and Context in interpretivism, Communication, and Psychoanalytic. Psychological Record, 49(4): 589–604.
HOVLAND, C. I., JANIS, I. L. and KELLEY, H. H. 1953. Communication and persuasion: psychological studies of opinion change. Westport, CT: Greenwood Press.
I4S. 2011. Q Methodology: A method for modern research. [Online]. 2011. Available at: http://qmethod. org/ [Accessed: 2019, October 15].
LANKES, R. D. 2008. Credibility on the internet: shifting from authority to reliability. Journal of Documentation, 64(5): 667–686.
LAZAR, J., MEISELWITZ, G. and FENG, J. 2007. Understanding Web Credibility: A Synthesis of the Research Literature. Foundations and Trends in Human-Computer Interaction, 1(2): 139–202.
MACHACKOVA, H. and SMAHEL, D. 2018. The perceived importance of credibility cues for the assessment of the trustworthiness of online information by visitors of health-related websites: The role of individual factors. Telematics and Informatics, 35(5): 1534–1541.
METZGER, M. J. and FLANAGIN, A. J. 2013. Credibility and trust of information in online environments: The use of cognitive heuristics. J. Pragmatics, 59(B): 210–220.
METZGER, M. J., FLANAGIN, A. J., EYAL, K., LEMUS, D. S. and MCCANN, R., M. 2016. Credibility for the 21st Century: Integrating Perspectives on Source, Message, and Media Credibility in the
Contemporary Media Environment. Annals of the International Communication Association, 27(1): 293–335.
MCKEOWN, B. and THOMAS, D. 1988. Q Methodology. Newbury Park, CA: SAGE Publications, Inc. PETERSON, R. A., BALASUBRAMANIAN, S. and BRONNENBERG, B. J. 1997. Exploring the Implications
of the Internet for Consumer Marketing. Journal of the Academy of Marketing Science, 25(4): 329– 346.
STACKS, D. W. and SALWEN, M. B. (Eds.). 2009. An integrated approach to communication theory and research. 2nd Edition. New York: Routledge.
STEPHENSON, W. 1936. The Inverted Factor Technique. British Journal of Psychology. General Section, 26(4): 344–361.
TASHAKKORI, A. and TEDDLIE, C. 2010. Sage handbook of mixed methods in social. 2nd Edition. Los
Angeles: SAGE Publications.
THE EPIMETRICS GROUP. 2010. Q-Assessor. [Online]. Available at: http://Q-assessor.com/ [Accessed: 2019, October 15].
VAN EXEL, J. and DE GRAAF, G. 2005. Q methodology: A sneak preview. Available at: https://qmethod.org/ portfolio/van-exel-and-de-graaf-a-q-methodology-sneak-preview/ [Accessed: 2019, October 15]. WARD, W. 2009. Q and you: The application of Q methodology recreation research. In: Proceedings of
the 2009 Northeastern Recreation Research Symposium. Gen. Tech. Rep. NRS-P-66. Newtown Square, PA: U.S. Department of Agriculture, Forest Service, Northern Research Station, pp. 75–81.
WASIKE, B. 2017. Persuasion in 140 characters: Testing issue framing, persuasion and credibility via Twitter and online news articles in the gun control debate. Computers in Human Behavior, 66: 179–190.
WATTS, S. and STENNER, P. 2012. Doing Q methodological research: theory, method and interpretation. Los Angeles: Sage.
WOLFINBARGER, M. and GILLY, M. C. 2001. Shopping Online for Freedom, Control, and Fun. California Management Review, 43(2): 34–55.
ZABALA, A. 2014. Qmethod: A Package to Explore Human Perspectives Using Q Methodology.
The R Journal, 6(2): 163–173.