Hip joint load in relation to leg length discrepancy
Per Wretenberg1
Anders Hugo1
Eva Broström2
1Department of Molecular Medicine
and Surgery, Section of Orthopedics and Sports Medicine, Karolinska Institute, Stockholm, Sweden;
2Department of Women
and Child Health, Karolinska Institute, Stockholm, Sweden
Correspondence: Per Wretenberg Department of Orthopaedic Surgery, Karolinska University Hospital, 171 76 Stockholm, Sweden Tel +46 8 5177 0000, Ext 98619 Fax +46 8 5177 2695
Email [email protected]
Objective: Leg length discrepancy is common both in healthy subjects and after total hip
arthroplasty (THA). Studies that evaluated leg length following THA have demonstrated a notable inconsistency in restoring leg length. The effects concerning joint load during gait is however not well known. The purpose of this study was to use three-dimensional (3D) gait analysis to evaluate joint load during gait with a simulated leg length discrepancy of 2 and 4 cm. Nine healthy subjects without any history of hip injury participated.
Method: A 3D gait analysis (Vicon, Motion System, Oxford, England) was performed with
6 cameras and 2 force palates using a standard biomechanical gait model. Hip joint moments of force were calculated for all three degrees of motion freedom. ANOVA for repeated measure-ments was used for statistical calculations.
Results: Abduction peak moment was signifi cantly increased at the short side (P ⬍ 0.05) but
unaffected on the long side. The adduction moment decreased on the long side between 0 and 4 cm (P ⬍ 0.01) but was unaffected on the short side. The internal hip rotation moments were unchanged for both the long and the short side. The external rotation moment was unchanged on the short side and decreased between bare foot and 4 cm on the long side (P ⬍ 0.05).
Conclusion: A leg length discrepancy of 2 cm or more creates biomechanical changes
concerning hip joint load both on the long and the short side and that the effects are larger on the short side. The increased stress may cause problems in the long run.
Keywords: gait analyses, leg length discrepancy, hip, biomechanics
Introduction
Gait analysis is a very powerful method for detailed analysis of gait pattern as joint angles and moments of forces during gait (Gutierrez 2003; Broström 2004). The method can be used to evaluate common clinical problems and also for pre operative planning and evaluation after surgical intervention.
a factor in discomfort after THA, the effects of moderate leg length discrepancy on hip load during gait is not well known. It has been shown that differences in leg length is associated with alteration of ground reaction forces, but it has also been concluded that leg length discrepancy of the sort commonly seen after THA would likely cause no substantial changes in hip forces (Brand and Yack 1996).
The aim of this study was to evaluate the effects of internal hip joint load during gait.
Subjects and methods
Subjects
Nine healthy male subjects with a mean age 34 (29–41) years and no history of previous surgery of the lower limbs and no leg length discrepancy volunteered for the study. They performed normal gait barefoot and gait with shoes where the right foot was elevated 2 and 4 cm.
Gait analysis
For the gait analysis a three-dimensional (3D) motion analysis system with 6 cameras (Vicon, Motion System, Oxford, England) was used. Retro-refl ective markers (25 mm) were attached bilaterally by the same investigator (E.B.) onto the patient’s skin over standardized bony landmarks. Data collec-tion was done at a frequency of 100 Hz. The lower model was modeled according to Kadaba and colleagues (1990) and the upper body was modeled as the thorax, upper and lower arms, hands, and head (Broström et al 2002; Gutierrez et al 2006) according to the Plug-in-Gait model (Figure 1). Only the data from the lower model are reported here. A walking trial is a 10 meter walk on the gait lane with complete collection of data. Three complete walking trials were performed to obtain kine-matic, kinetic, and time-distance parameters. All data were aver-aged across trials. Two force plates (Kistler, Basel, Switzerland) were used to collect ground reaction forces normalized to body weight. A walking trial was considered complete if the patient’s right or left foot had a clean contact on the force plate.
The Vicon Plug-in-Gait model was used for the evaluation of all parameters. The lower body was modeled as 7 segments (pelvis, 2 thighs, 2 shanks, and 2 feet) and the upper body was considered as one segment. A normal gait cycle was defi ned from initial heel-to-heel contact with the same limb. The hip joint moments were calculated in 3D continuously during the gait cycle and are presented. We calculated the hip joint moment of force on both the long and the short side and the maximum peak values were analyzed. The data are presented as Nm/kg. This means that the peak moment of force is divided with body weight for normalization purposes.
All subjects were asked to walk barefoot along a 10 m long walkway at a self-selected walking speed. The switch between no shoe lift (barefoot) and the 20 mm and 40 mm shoe lift at the right side was randomized.
Statistical analysis
A parametric ANOVA for repeated measurements were used as statistical method. All values are presented as means and standard deviation. The level of signifi cance was P ⱕ 0.05. All statistical analyses were performed using Statistica 6.0 (StatSoft Inc., Tulsa, OK, USA).
-0,15 -0,1 -0,05 0 0,05 0,1 0,15 0,2
0 10 20 30 40 50 60 70 80 90 100
LHip no shoe lift RHip no shoe lift LHip 20 mm shoe lift RHip 20 mm shoe lift LHip 40 mm shoe lift RHip 40 mm shoe lift
ext
ern
al
in
tern
al
mo
men
t(
N
m/
kg
)
% gait cycle
Figure 2a Hip joint internal and external rotation moments during whole gait cycle.
-0,4 -0,2 0 0,2 0,4 0,6 0,8 1
0 10 20 30 40 50 60 70 80 90 100
% gait cycle
mo
men
t(
N
m/
kg
)
LHip no shoe lift RHip no shoe lift LHip 20 mm shoe lift RHip 20 mm shoe lift LHip 40 mm shoe lift RHip 40 mm shoe lift
ab
d
u
ct
o
r
ad
d
u
ct
o
r
Figure 2b Hip joint abduction and adduction moments during whole gait cycle.
-1,5 -1 -0,5 0 0,5 1 1,5
0 10 20 30 40 50 60 70 80 90 100
LHip no shoe lift RHip no shoe lift LHip 20 mm shoe lift RHip 20 mm shoe lift LHip 40 mm shoe lift RHip 40 mm shoe lift
fl
ex
io
n
ex
te
n
si
o
n
% gait cycle
mo
men
t
(N
m/
kg
)
Results
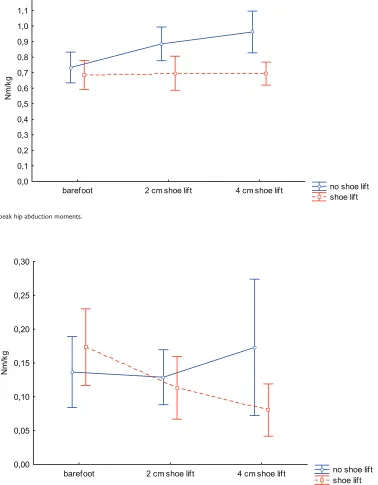
The moment curves for all subjects and conditions in the three planes are shown in Figure 2a, b, and c. In the frontal plane the peak abduction moments are shown in Figure 3a. There was an increased moment at the short side, both when the other side was elongated 2 cm (P ⬍ 0.005) and 4 cm (P ⬍ 0.006). At the elongated side, however, the net abduction peak moment was unaffected. The peak adduc-tion moment decreased on the long side between 0 and
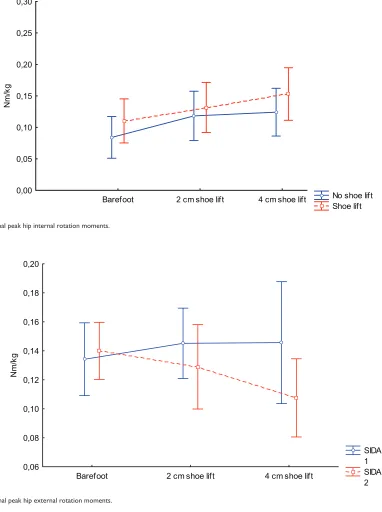
4 cm (P ⬍ 0.02) but not signifi cantly between 0 and 2 cm (P ⬍ 0.08) Figure 3b. The average increase in peak hip joint moment of force between 2 and 4 cm was not signifi cant. In the transverse plane the internal peak hip rotation moments showed an increasing tendency both on the long and the short side but the increase was not signifi cant Figure 3c. The external peak rotation moment was unchanged for the short side and decreased between no shoe lift and 4 cm shoe lift (P ⬍ 0.04) Figure 3d. In the sagittal plane maximum hip
no shoe lift shoe lift barefoot 2 cm shoe lift 4 cm shoe lift
0,0 0,1 0,2 0,3 0,4 0,5 0,6 0,7 0,8 0,9 1,0 1,1 1,2
Nm
/k
g
Figure 3a Internal peak hip abduction moments.
no shoe lift shoe lift barefoot 2 cm shoe lift 4 cm shoe lift
0,00 0,05 0,10 0,15 0,20 0,25 0,30
Nm
/k
g
No shoe lift Shoe lift Barefoot 2 cm shoe lift 4 cm shoe lift
0,00 0,05 0,10 0,15 0,20 0,25 0,30
Nm
/k
g
Figure 3c Internal peak hip internal rotation moments.
SIDA 1 SIDA 2 Barefoot 2 cm shoe lift 4 cm shoe lift
0,06 0,08 0,10 0,12 0,14 0,16 0,18 0,20
Nm
/k
g
Figure 3d Internal peak hip external rotation moments.
extension and fl exion moment did not show any differences between the short and long side.
Discussion
Most patients who undergo total hip replacement can expect dramatic improvement in their preoperative hip pain. However, post-operative leg length discrepancy can result in signifi cant impaired postoperative function and dissatisfaction and all effort should be made to try to avoid it. The most common treatment for post-operative leg length
length discrepancy. It has also been shown in a convincing way that simulated leg length discrepancy gives rise to changes in gait pattern that are very similar to what can be analyzed for real leg length discrepancy (White et al 2004). The motion and load patterns shown in this study should thereby be possible to convert to a real situation. With this kind of noninvasive technique it is not possible to calculate the actual changes in muscular tension and actual forces across the joint. The simulated model created a difference in leg length but did not like in a real case produce an elongation of the actual muscles involved. This means that the moments of force calculated here must be seen as a minimum load change. In a real case the increased tension of the muscles due to internal anatomy changes ad to the here calculated external moments by creating larger muscle forces. This is of course a disadvantage but with a noninvasive technique, the load changes related to the internal muscle force is not possible to measure.
Our results show that a leg length discrepancy already of 2 cm creates changes in hip moments both on the long and the short side. Increased load was mainly found on the short side but load pattern is altered also on the long side. The tendency of increasing moments on the long side was clear for internal rotation moments, however not signifi cantly in this study. An increase in rotational moments is a clear disadvantage since it leads to increased torsion forces on the stem implant. We believe that the changes in hip joint load both on the long and the short side must be regarded as a disadvantage since the natural load with well balanced and counteracting moments is disturbed. The main fi nding was however that the abduction moment was increased with height on the short side. An increase in hip abduction moment results in an increased stress on the stem implant. The increase is about 0.1 Nm/kg. With a weight of 75 kg the increased stress is about 7.5 Nm for each step. With an average of around 2 million steps per year the cumulative increase in load is substantial. To our knowledge, data on prosthetic loosening in relation to leg length discrepancy has not been evaluated, but an obvious increase of an altered load on both hips as shown in this study must be considered. Our study clearly shows biomechanical disadvantages of leg length discrepancy and in our opinion it is of great importance to try to avoid
it in a operative situation. We also believe that a leg length discrepancy of 2 cm or more should be compensated.
Disclosure
The authors report no confl icts of interest in this work.
References
Brand RA, Yack HJ. 1996. Effects of leg length discrepancies on forces at the hip joint. Clin Orthop, 333:172–80.
Broström E. 2004. Juvenile idiopathic arthritis: Disease consequences and treatment effects on muscle strength, gait and pain [thesis]. Stockholm: Karolinska University Press.
Broström E, Haglund-Åkerlind Y, Hagelberg S. 2002. Gait in children with juvenile chronic arthritis-timing and force parameters.
Scand J Rheumatol, 31:317–23.
Friberg O. 1983. Clinical symptoms and biomechanics of lumbar spine and hip joint in leg length inequality. Spine, 8:643–51.
Gofton JP, Trueman GE. 1971. Studies in osteoarthritis of the hip: Part II.
Osteoarthritis of the hip and leg length disparity. CMAJ, 104:791–9.
Gurney B, Mermier C, Robergs R, et al. 2001. Effects of limb-length discrepancy on gait economy and lower extremity muscle activity in
older adults. J Bone Joint Surg, 83-A:907–15.
Gutierrez EM. 2003. Gait strategy in myelomeningocele [thesis]. Stockholm: Karolinska University Press.
Gutierrez-Farewik EM, Bartonek A, Haglund-Akerlind Y, et al. 2006. Comparision and evaluation of two common methods to measure
center of mass displacement in three dimensions during gait. Hum
Mov Sci, 25:238–56.
Hoffamn AA, Skrzynski MC. 2000. Leg-length inequality and nerve palsy in total hip arthroplasy: a lawyer await! Orthopedics, 23:943–4. Kadaba MP, Ramakrishnan HK, Wooten ME. 1990. Measurement of lower
extremity kinematics during level walking. J Orthop Res, 8:383–92.
McCaw ST, Bates BT. 1991. Biomechanical implications of mild leg length inequality. Br J Sports Med, 25:10–3.
Matsuda K, Nakumura S, Matsushita T. 2006. A simple method to minimize
limb-length discrepancy after hip arthroplasty. Acta Orthopaedica,
77:375–9.
Parvizi J, Sharkey PF, Bisset BA, et al. 2003. Surgical treatment of limb-length discrepancy following total hip arthroplasty. J Bone Joint Surg, 85-A:2310–16.
Ranawat CS, Rodriguez JA. 1997. Functional leg-length inequality following total hip arthroplasty. J Arthroplasty, 12:359–64.
White AB. 1994. Probes closed claim causes. AAOS Bulletin, 26–7.
White TO, Dougall TW. 2002. Arthroplasty of the hip. Leg length is not
important. J Bone Joint Surg, 84-B:338–48.
White SC, Gilchrist LA, Wilk B. 2004. Asymmetric limb loading with true
or simulated leg-length differences. Clinical Orthop, 421:287–92.
Wiliamson JA, Reckling FW. 1978. Limb length discrepancy and related
problems following total hip replacement. Clin Orthop, 134:135–8.
Woolson ST. 1990. Leg length equalization during total hip replacement.
Orthopaedics, 113:17–21.
Woolson ST, Hartford JM, Sawyer A. 1999. Results of a method of leg-length equalization for patients undergoing primary total hip