Nat. Hazards Earth Syst. Sci., 13, 1293–1312, 2013 www.nat-hazards-earth-syst-sci.net/13/1293/2013/ doi:10.5194/nhess-13-1293-2013
© Author(s) 2013. CC Attribution 3.0 License.
EGU Journal Logos (RGB)
Advances in
Geosciences
Open Access
Natural Hazards
and Earth System
Sciences
Open AccessAnnales
Geophysicae
Open AccessNonlinear Processes
in Geophysics
Open AccessAtmospheric
Chemistry
and Physics
Open AccessAtmospheric
Chemistry
and Physics
Open Access DiscussionsAtmospheric
Measurement
Techniques
Open AccessAtmospheric
Measurement
Techniques
Open Access DiscussionsBiogeosciences
Open Access Open Access
Biogeosciences
Discussions
Climate
of the Past
Open Access Open Access
Climate
of the Past
Discussions
Earth System
Dynamics
Open Access Open Access
Earth System
Dynamics
DiscussionsGeoscientific
Instrumentation
Methods and
Data Systems
Open Access
Geoscientific
Instrumentation
Methods and
Data Systems
Open Access DiscussionsGeoscientific
Model Development
Open Access Open Access
Geoscientific
Model Development
DiscussionsHydrology and
Earth System
Sciences
Open AccessHydrology and
Earth System
Sciences
Open Access DiscussionsOcean Science
Open Access Open Access
Ocean Science
DiscussionsSolid Earth
Open Access Open Access
Solid Earth
Discussions
Open Access Open Access
The Cryosphere
Natural Hazards
and Earth System
Sciences
Open Access
Discussions
Integrated multi-criteria flood vulnerability approach using fuzzy
TOPSIS and Delphi technique
G. Lee1, K.-S. Jun1, and E.-S. Chung2
1Department of Civil and Environmental Engineering, Sungkyunkwan University, Suwon, Republic of Korea 2School of Civil Engineering, Seoul National University of Science and Technology, Seoul, Republic of Korea Correspondence to: E.-S. Chung (eschung@seoultech.ac.kr)
Received: 10 December 2012 – Published in Nat. Hazards Earth Syst. Sci. Discuss.: – Revised: 25 March 2013 – Accepted: 12 April 2013 – Published: 22 May 2013
Abstract. This study aims to develop a new procedure that
combines multi-criteria spatial vulnerability analysis with the traditional linear probabilistic risk approach. This ap-proach is named integrated fuzzy flood vulnerability assess-ment because it combines the watershed-based vulnerabil-ity framework with stream-based risk analysis. The Delphi technique and pressure-state-impact-response framework are introduced to objectively select evaluation criteria, and the fuzzy TOPSIS technique is proposed to address the uncer-tainty of weights to all criteria and crisp input data of all spatial units. ArcGIS is used to represent the spatial results to all criteria. This framework is applied to the south Han River basin in South Korea. As a result, the flood vulnerabil-ity ranking was derived and vulnerabilvulnerabil-ity characteristics of all spatial units were compared. This framework can be used to conduct a prefeasibility study for flood mitigation projects when various stakeholders should be included.
1 Introduction
In 2011, floods were reported to be the third most common disaster, after earthquake and tsunami, with 5202 deaths and adducing millions of people (CRED, 2012). River, coastal and flash floods can claim human lives, destroy properties, damage economies, make fertile land unusable and damage the environment. The development of techniques, measures and assessment methodologies to increase understanding of flood risk or vulnerability can assist decision makers greatly in reducing damage and fatalities. Different methods to as-sess risk and vulnerability of areas to flooding have been de-veloped over the last few decades.
However, the term “risk” in relation to flood hazards was introduced by Knight (1921) and is used in different contexts and topics showing how adaptive any definition can be (Say-ers et al., 2011). Smith (2004) considered risk as the product of two components, i.e., probability and consequence. This concept of flood risk is strictly related to the probability that a high flow event of a given magnitude occurs, which re-sults in consequences which span environmental, economic and social losses caused by that event. This deterministic ap-proach uses physically based modelling methods to estimate flood hazard/probability of a particular event, coupled with damage assessment models which estimate economic con-sequences to provide an assessment of flood risk in an area (Balica et al., 2013).
On the other hand, after many discussions and disputes, the term “vulnerability” can be commonly understood that vul-nerability is the degree to which a system is susceptible to, or unable to cope with the adverse effects of environmental changes (IPCC, 2001). In relation to hazards and disasters, vulnerability is a concept that links the relationship that peo-ple have with their environment to social forces and institu-tions, as well as the cultural values that sustain and contest them. The concept of vulnerability expresses the multidimen-sionality of disasters by focusing attention on the totality of relationships in a given social situation. These relationships, together with environmental forces, are capable of producing a disaster prevention plan (Frerks et al., 2004). Vulnerability also refers to the extent to which changes could harm a sys-tem, or to which a community can be affected by the impact of a hazard. Therefore, this parametric approach aims to use readily available data of information to build a picture of the vulnerability of an area (Balica et al., 2013).
Fig. 1. Procedure of this study.
Although each of these approaches has advantages and disadvantages for decision makers, this study uses the para-metric vulnerability, which has been increasingly accepted, since it is coupled with the climate change approach to dis-aster in recent years.
Parametric vulnerability research generally consists of var-ious sub-topics such as indicator selection, weight determi-nation and assessment methodology (Moel et al. 2009; RPA, 2004; Akter and Simonovic, 2005; Thinh and Vogel, 2006; Meyer et al., 2009; Chung and Lee, 2009b; Chung et al., 2011; Jun et al., 2011; 2012).
King (2001), Fekete (2009) and Kaplan et al. (2009) gath-ered vulnerability indicators or develop integrated vulner-ability indices for different types of natural hazards, with an emphasis on social vulnerability indicators. Furthermore, Wang et al. (2009) evaluated hydrologic flood vulnerability indicators including hazard factors, such as elevation, veg-etation coverage, drainage networks, precipitation, passing floods and flood control projects, as well as anthropogenic factors, such as population, production, cropland and trans-portation, using a GIS tool. However, theses studies con-ducted simple weighted sum methods without reflecting any traditional probabilistic flood risks inherent in river reaches.
For the above reasons, Meyer et al. (2009) and Scheuer et al. (2011) used a different, wider concept of vulnerability that
included both the spatial hazard vulnerability multi-criteria analysis (MCA) and probabilistic inundated risk analysis. In addition, Kienberger et al. (2009) presented a method to model economic and social vulnerability using information on the occurrence and distribution of hazards and data on the spatial distribution of elements at risk exposed. However, al-though multi-criteria decision-making (MCDM) methods are suitable for decision-making in flood vulnerability, MCA is very difficult to be applied exactly since the data for flood vulnerability closely related to social, economic and envi-ronmental circumstances have high uncertainty. Therefore, the flood vulnerability assessment should consider lots of uncertainties, such as the uncertainty of weights and proxy variables’ crisp data. Thus, Simonovic and Nirupama (2005) combined the MCDM method and fuzzy set theory to address various uncertainties in water resources management.
2 Methodology
2.1 Procedure
For IFFVA, this research included three following consider-ations:
1. The assessment reflected not only economic and hydro-logical criteria, but also anthropogenic considerations. 2. Multiple expert opinions were considered when
select-ing criteria and weights through Delphi. Uncertainty of weights and proxy data were incorporated using fuzzy concept.
3. The study basin was divided according to river sections and their DEMs. All sectional hazards were quantified individually. Flood risk assessment was applied using the stream-based flood risk estimation technique. For the above considerations, GIS applications, Delphi tech-niques and fuzzy TOPSIS method were used in this IFFVA. IFFVA consists of three steps. In Step 1, criteria and their weights are determined using Delphi technique. This step re-quires three step-by-step surveys for screening and consen-sus building. First, we carry out a survey after the Delphi panel’s selection and writing of draft criteria. From these re-sults, we select the evaluation criteria. Next, we enforce the survey for estimation of weights. Step 2 is to collect data for all criteria. Data were acquired from the office of pub-lic works. Collected data is composed of various quantitative and qualitative scales. Thus, all values must be standardised. GIS tools are used to create databases and to divide the as-sessment units. In Step 3, using the fuzzy TOPSIS, all com-bined sectional and areal flood risks are quantified. The pro-cedure for this study was illustrated in Fig. 1.
2.2 Evaluation criteria development
2.2.1 PSIR framework
The driving force-pressure-state-impact-response (DPSIR) framework was adopted by the European Environment Agency (1995) to report the results of environmental mon-itoring from different environmental assessment tools, such as environmental impact assessments. In the late 1990s, an organisation of economic cooperation and develop-ment (OECD) developed and proposed the DPSIR frame-work for structuring and organising indicators. It was built on the previous frameworks, the pressure-state-response (PSR) (OECD, 1993) and the driver-state-response (DSR) (UN, 1996). The DPSIR framework provides a structure to the de-scription of environmental problems by formalising the re-lationships between various sectors of human activity and the environment as causal chains of links (Chung and Lee, 2009a). Under the DPSIR framework, the environmental management process may be described as a feedback loop
that controls a five-stage cycle (Economic and Social Com-mission for Asia and the Pacific, 2004).
Recently, the DPSIR framework has become very popular worldwide (Turner et al., 1996; Newton et al., 2003; WSM, 2004; Scheren et al., 2004; Odermatt, 2004, Karageorgis et al., 2005; Pirrone et al., 2005; Holman et al., 2005; Agye-mang et al., 2007; Giupponi et al., 2004, 2006; Chung and Lee, 2009a; Benini et al., 2010; Chung et al., 2011; Yang et al., 2012; Kagalou et al., 2012). According to Tschern-ing et al. (2012), The DPSIR framework includTschern-ing consid-erable potential and usefulness of application could provide policy makers with meaningful explanations of cause and ef-fect relationships. WSM (2004) developed strategies for in-tegrated water resource management in water-deficient re-gions using the DPSIR framework. Giupponi et al. (2004) developed MULINO-DSS, which is a computer tool for the sustainable use of water resources at the catchment scale, us-ing the DPSIR framework (Chung and Lee, 2009a). Chung and Lee (2009a) developed the alternative evaluation index to quantify the effectiveness of feasible water management policies based on the DPSIR framework. Yang et al. (2012) derived the prioritisation of water management options un-der climate change and urbanisation using the DPSIR frame-work. The DPSIR framework makes it possible to formalise all policy-making and management processes by identifying cause and effects links among complex elements of the chain of human-environment interaction. It emphasises the interac-tion between society (human activities in the river basin) and environment in integrated river basin management (Benini et al., 2010; Kagalou et al., 2012)
The DPSIR framework is a five-stage cycle starting with “driving forces” through “pressures” to “states” and “im-pact” and leading to “response”. The driving force refers to the underlying causes of environmental pressures. Sub-criteria could include, for example, annual monetary damage from floods, typhoons and hail in Korea, the gross domes-tic product (GDP), and the annual number of wet days in a year, among other criteria. The driving force which rep-resents a large area (e.g., Korea as a whole) is used to es-tablish changes that have occurred over time, such as in the annual mean. Therefore, the sub-criteria for the driving force are not closely related to flood vulnerability assessment to small scale area and are quite difficult to quantify. Thus, this study applied the pressure-state-impact-response (PSIR) framework, which excludes the driving force of DPSIR.
– Pressure leads to environmental awareness of flood risk,
for example, predicted precipitation and protected re-sources (e.g., population and increased ratio of daily maximum precipitation).
– These pressures, in turn, affect the state of the
Fig. 2. Procedure of this study.
them (for example, amount of social overhead capi-tal (SOC)).
– Changes in state may have an impact on human health,
ecosystems, biodiversity, amenity value and financial value. The impacts may be expressed in terms of the level of harm caused by the flood.
– The response demonstrates the efforts by society (e.g.,
politicians and decision makers) to solve the problems identified by the assessed impacts, such as policy mea-sures and planning actions.
2.2.2 Social, economic and hydrologic classification
Flood vulnerability are multi-dimensional and complex is-sues (Messner and Meyer, 2006; Merz et al., 2006; Adger, 2006; Green, 2004; Scheuer, 2011). Global processes, such as climate change, are driven and intensified by degrading transnational economic, political and societal interests and, thus, habits of resource exploitation cause a negative impact on the entire ecosystem. All climate change agents appear to feed the outbreak and intensity of natural hazards, such as floods, in a constant, but increasing manner. Therefore, floods tend to revisit human settlements and present risks to some, but less risk to others. In these situations, socioeco-nomic status plays an important role (Sebald, 2010). That is, flood vulnerability is inherent in various circumstances, including the possibility of disaster, the influence of the dis-aster on society and society’s ability to respond to a disdis-aster (Fig. 2). To assess flood vulnerability, this study considered various parts of the region such as: (1) social, (2) economic and (3) hydrologic criteria, by perspective.
Social criteria refers to all human society components re-lated to flood damage, e.g., resident population, number of households, roads, railways, communications networks, hos-pitals, schools, government offices, historical and social as-sets, natural environment and cultural heritage.
Economic criteria refer to all items related to the regional economy, including the value of the land and buildings and all added assets. The developable assets in the region and the indirect economic impacts linking to other areas are also included. Therefore, economic criteria would be related to the prolonged effects on economic activities and the amount of damage, recovery and prevention.
Natural phenomena and human activities encompass hy-drologic criteria. Criteria include major flood-related meteo-rological phenomena, rainfall flood level, flood discharge and inundation. Structural flood mitigation measures, drainage pump stations, reservoirs and channel dredging are also in-cluded, as well as unstructured flood mitigation measures, flood forecasts and flood warning.
2.3 Delphi technique
“Selection of the evaluation criteria is a crucial step for each MCA approach. The inclusion or exclusion of criteria can significantly influence the results of the evaluation process. On the one hand, the evaluation criteria should be complete to ensure that the entire problem is encompassed; on the other hand, the set of criteria should be minimised to reduce the complexity of the evaluation process” (Keeney and Raiffa, 1993; Meyer et al., 2009). The Delphi technique is “a method for structuring a group communication process so that the process is effective in allowing a group of individuals, as a whole, to deal with a complex problem” (Linstone and Tur-off, 1975). The Delphi method is a structured process for col-lecting and distilling knowledge from a group of experts us-ing a series of questionnaires with controlled opinion feed-back (Adler and Ziglio, 1996). The Delphi technique uses a series of iterative questionnaires that are sent to a group of intentionally selected experts who remain anonymous to one another (Richey et al., 1985). The results of the previous questionnaires are returned to the respondents, who are then allowed to modify their responses. By the second or third round of this process, it is hoped that the experts will arrive at a consensus on the estimation problem (Angus et al., 2003). If a judge happens to overlook some aspects of the problem, he will likely be apprised thereof through the feedback of others’ opinions. Delphi is generally regarded as a very ob-jective and rational method because no member of the panel can exert undue influence over the other members. When ex-perts live some distance apart and it is prohibitive to bring them together for a committee meeting, Delphi can be very effective. Accordingly, the selection of panel is an important field to implement the Delphi technique.
Fig. 3. Delphi procedure of this study.
social policy and public health (Millar et al., 2006). Wide use of this technique has led to significant deviations from the original technique and the creation of a family of Delphi-related processes (Sackman, 1975; Angus et al., 2003). How-ever, as yet, the Delphi technique has not been widely used in the determination of flood risk (Fekete, 2010).
In this study, conducting the Delphi survey consisted of four activities. First, the organising group selected all fea-sible criteria for an IFFVA based on the historic records of severe floods and then devised a questionnaire. This activity required a very creative brainstorming process, as well as ra-tional and logical thinking. In particular, all criteria had to be selected by integrating social, economic and hydrologic characters based on the PSIR framework. Second, the organ-ising group had to identify a group of experts. It was sug-gested that the respondents should be experts with plenty of experiences and have a high level of responsibility. Then, the expert group had to respond to the questionnaire. Interaction with group members was handled completely anonymously to avoid the possibility of identifying the specific opinion of a particular person. Third, the organising group determined the consensus of the expert group. If a criteria was deemed “important and necessary” by the experts, all of the criteria and their weights could be determined. However, if some-thing was “unimportant,” the organising group should alter the questionnaire. This procedure should present a statistical response that includes the opinion of the entire group. For a single question, the group response could be presented in terms of a median and two quartiles. The primary reason for this controlled feedback was to prevent the group from set-ting its own goals and objectives. The last steps had to be iterated for consensus building until determination of the cri-teria and their weights were in agreement within a critical range (Fig. 3).
2.4 Fuzzy TOPSIS
The TOPSIS technique was developed to solve MCDM prob-lems in which there is no articulation of preference informa-tion (Hwang and Yoon, 1981). The technique is based on the concept that the ideal alternative has the best level for all at-tributes, whereas the negative ideal is the alternative with all of the worst attribute values. A TOPSIS solution is defined as the alternative that is simultaneously farthest from the neg-ative ideal and closest to the ideal alternneg-ative (Chu, 2002; Jun et al., 2011). According to Kim et al. (1997) and Shih et al. (2007), there are four advantages of using TOPSIS: (1) a sound logic that represents the rationale of human choice; (2) a scalar value that accounts for both the best and worst al-ternatives simultaneously; (3) a simple computation process that can be easily programmed; and (4) for any two dimen-sions, the performance measures for all alternatives can be visualised on a polyhedron.
In addition, vulnerability assessment is closely related to MCA because it applies a spatial ranking to hazards (Lee and Chung, 2007; Chung and Lee, 2009b). Therefore, there are two types of uncertainty: (1) weighting values to proxy vari-ables and (2) crisp input data. The first type of uncertainty may arise during decision making, for example, when there are influential stakeholders with different interests (Chen and Chang, 2010). The second type can result after transforma-tions of data to numerical values.
Fig. 4. Fuzzy linguistic terms for the weight of each criterion.
Table 1. Linguistic variables for the importance weight of each cri-terion.
Importance Abbreviation Membership function
Very low VL 0.1˜ (0.0, 0.0, 0.1)
Low L 0.2˜ (0.0, 0.1, 0.3)
Medium low ML 0.3˜ (0.1, 0.3, 0.5)
Medium M 0.5˜ (0.3, 0.5, 0.7)
Medium high MH 0.7˜ (0.5, 0.7, 0.9)
High H 0.8˜ (0,7, 0.9, 1.0)
Very high VH 0.9˜ (0.9, 1.0, 1.0)
is a powerful mathematical tool for handling uncertainty in decision making. A fuzzy set is a general form of a crisp set (Yazdani-Chamzini and Yakhchali, 2012). Jun et al. (2011) used fuzzy TOPSIS in a new attempt to quantify hydrologic vulnerability in a manner that takes into account both climate change impacts and the concept of sustainability. A fuzzy number takes on values in the closed interval 0 and 1, in which 1 represents full membership and 0 represents non-membership. In contrast, crisp sets only allow values of 0 or 1. There are different types of fuzzy numbers that can be utilised, depending on the situation. It is often convenient to work with triangular fuzzy numbers (TFNs) because they are relatively simple to compute and are useful for representing and processing information in a fuzzy environment (Torlak et al., 2011; Yazdani-Chamzini and Yakhchali, 2012; Jun et al., 2012). A fuzzy number,A˜, onRcan be a TFN if its member-ship function,µA˜(x):R→[0,1], can be defined as follows:
µA˜=
0, x≤a x−a
b−a, a≤x≤b c−x
c−b, b≤x≤c 0, otherwise
(1)
For fuzzy TOPSIS, the weighting values and all input data for proxy variables are fuzzified. Prioritisation among many available indicators is derived from the corresponding fuzzy weight vectors; the final results come from ranking fuzzy numbers.
Weighting values are estimated through the response to survey. Therefore, questionnaire need to describe the fuzzy
weights in respondents can be comprehensible. The motiva-tion for the use of words or sentences rather than numbers is that linguistic characterisations are, in general, less spe-cific than numerical ones (Zadeh, 1975). Linguistic variables represent crisp information in a form and precision appropri-ate for the problem (Raheja et al., 2011). Therefore, we sug-gested linguistic variables of weights using An TFN,N˜, can be defined by a triplet of (a1a2a3). Linguistic variables for the
importance weight of each criterion are shown in Table 1, and their membership functions are shown in Fig. 4. The weight of the criteria is set at presented 7 steps. The minimum and the maximum value, very low and very high are the first and last order. The weighting value of each criterion is estimated using the opinions of experts that is chosen by given Fig. 4 and Table 1.
However, the input data of each criterion are modified to a TFN using the data from its membership unit area. For input data TFNs, if a unit area has a value of 1, then no TFN is used, and if a value shows very little variability, then a value of 1 is used. If the data are not comparatively uniformly dis-tributed, all data are transformed to log-scaled values. Af-ter this revision, the distributions become acceptable. If this transformation is ignored, the TFN may not reflect the distri-bution of the input data. If not, skewness can occur as a result of the fuzzification.
To consider fuzziness, as opposed to crisp data, values in D (the performance matrix) are presented as shown in Eq. (2), respectively (Afshar et al., 2011; Jun et al., 2012).
˜ D= ˜ x11 ˜ x21 .. . ˜ xm1 ˜ x12 ˜ x22 .. . ˜ xm1 . . . . . . .. . . . . ˜ x1n
˜ x2n .. . ˜ xmn
, x˜ij=(aij, bij, cij) (2)
where x˜ij are built by alternatives Aj(j=1, . . . ,n) which
are evaluated against Ci(i=1, . . . ,m). The performance
ma-trix is composed of rows of unit area with columns of cri-teria. And the fuzzy weight for criterion Ci are denoted by
˜
Wi(i=1, . . . ,m).
˜ W=˜
wi ,w˜i =(wi1, wi2, wi3) (3)
The normalised fuzzy decision matrixR˜is given by Eq. (4)
˜ R= ˜ r11 ˜ r21 .. . ˜ rm1
˜ r12 ˜ r22 .. . ˜ rm1
. . . . . . .. . . . . ˜ r1n
˜ r2n .. . ˜ rmn (4)
related criteria are calculated as follows.
˜ rij=
aij c∗j ,
bij c∗j,
cij c∗j
!
(5)
wherec∗j=maxcij, if j∈Benefit
˜ rij=
aj−
c∗ij, aj−
b∗j, aj−
aj∗ !
(6)
whereaj−=minaij, if j∈Cost
The weighted performance matrix, V˜, is computed by multiplying its associated weights, w˜, with the normalised performance matrix,rij˜.
˜ V = ˜ v11 ˜ v21 .. . ˜ vm1
˜ v12 ˜ v22 .. . ˜ vm2
. . . . . . .. . . . . ˜ v1n
˜ v2n .. . ˜ vmn
, v˜ij= ˜rij⊗ ˜wj (7)
The fuzzy positive ideal solution (FPIS) and fuzzy negative ideal solution (FNIS) of unit area are computed as follows Eqs. (8) and (9). It is sorted by the weighted normalised val-ues for each criterion in descending order.
A∗=(v˜1∗,v˜2∗, . . . ,v˜∗n) (8)
A−=(v˜1−,v˜2−, . . . ,v˜n−) (9) The distance from the positive ideal and the negative ideal solution for each alternative is calculated as
d(A1, A2)=
r 1
3[(a1−a2)
2+(b
1−b2)2+(c1−c2)2]
(10)
di∗= n P
j=1
d(v˜ij,v˜∗j)and
di−= n X
j=1
d(v˜ij,v˜j−) , (i=1, . . . ,m) (11)
According to the maximum principle of membership degree, one can select the desired alternative fromnavailable unit area (Afshar et al., 2011; Jun et al., 2012). The optimum membership degree of each alternative calculated is as fol-lows.
µj=
(dj−)2
(dj∗)2+(dj−)2
(12)
2.5 Multi-criteria aggregation procedure
In this study, IFFVI assessment formula aggregates three key concerns for flood risk management and can be derived as follows:
IFVI=X(SocVul×α+EconVul×β+HydroVul×γ ) (13) where SocVul, EconVul and HydroVul are the standardised values of social, economic and hydrologic vulnerability fac-tors andα,βandγ(α+β+γ=1)are their weights, respec-tively.
People have different perceptions of the immediate causes of flood damage, changed status of various environmental at-tributes caused by floods, flood damage capacity and avail-able options for coping with flood hazards. These reactions are closely related to their physical location, experience with floods, social and political backgrounds, values, and beliefs; the main factors are their economic status within society and their ability to adapt. Therefore, this study aggregated the PSIR concept to quantify flood vulnerability using the fol-lowing equation:
SocVul=Xn
i=1(PRVul×w1+STVul×w2 (14)
+IMVul×w3+REVul×w4)
where PRVul, STVul, IMVul and REVul are the standardised values of pressure, state, impact and response components, respectively, and wi indicates the weights of the pressure (i=1), state (i=2), impact (i=3) and response (i=4). EconVul and EnvironVul are found in the same manner.
Eventually, the assessment results are the aggregated value of each criterion combined with the weighting.
PRVul=Xn
j=1 PRIj×wj
(15) where PRIj is the standardised values of the criteria andwj is their weights. PRVul is determined by Eq. (15). STVul, IMVul and REVul are found in the same manner.
3 Study area
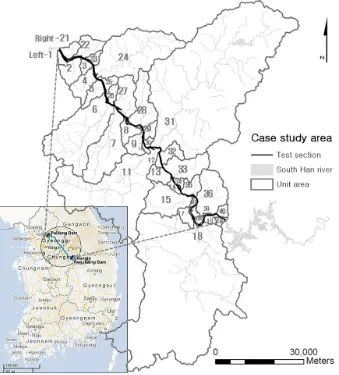
Fig. 5. Location of the South Han River.
population census report by the National Statistical Office, the population of Yangpyung increased by 10 % from 2005 to 2010. In addition, each municipality has plans to develop industrial parks, tourist attractions and large-scale residential areas. Some of these plans are ongoing. Thus, diverse sit-uations, involving various economic, social and hydrologic criteria, occur in this area.
For spatial hydrologic vulnerability, watershed approach based on tributaries is common. This study, however, used reach-based areal approach to include probabilistic flood risk values based on river reaches. That is, the spatial division map looks like a skin of an onion. This study divided the study river reach at a constant length and developed each cor-responding watershed section to each river reach. To accom-plish this task, we used the GIS application from the DEM of the assessment area. The divided area is presented in Fig. 5.
4 Results
4.1 Criteria selection and weight determination using the Delphi technique (Step 1)
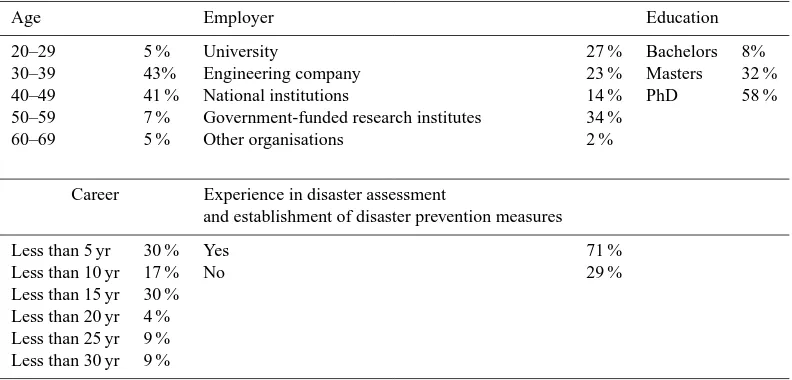
Table 2. Basic information on the respondents.
Age Employer Education
20–29 5 % University 27 % Bachelors 8%
30–39 43% Engineering company 23 % Masters 32 %
40–49 41 % National institutions 14 % PhD 58 %
50–59 7 % Government-funded research institutes 34 %
60–69 5 % Other organisations 2 %
Career Experience in disaster assessment
and establishment of disaster prevention measures
Less than 5 yr 30 % Yes 71 %
Less than 10 yr 17 % No 29 %
Less than 15 yr 30 % Less than 20 yr 4 % Less than 25 yr 9 % Less than 30 yr 9 %
generally critical to flood risk and vulnerability management, determination of the criteria requires careful judgment after specific investigation. All feasible criteria that affect flood vulnerability were collected and categorised using the PSIR framework, which focuses on the cause-effect relationship using the Delphi technique. The Delphi process was used to build consensus on the selection of appropriate criteria and to estimate their weights.
4.1.1 Delphi panels
The success of the Delphi study clearly rested on the com-bined expertise of the participants who made up the expert panel. There were two key aspects: (1) panel size and (2) qualifications of the experts. There were some disagreements on the appropriate panel size, however, it was clear that there was a wide variation in the number of participants (Pow-ell, 2002). Gordon (1994) indicated that most Delphi studies have used panels of 15 to 35 people. Murphy et al. (1998) believed that more participants were better, suggesting that a large number of judges produced more reliable results. Thus, the panel size in this research was planned to be greater than 40. Furthermore, although the panel members in our research are working in or had worked in flood risk management, they came from the following different sectors: (1) government, (2) private companies, (3) research centers, and (4) univer-sity institutions. Thus, it was expected that various opinions with diverse perspectives would arise. The interviewees were surveyed individually.
In total, 44 river management specialists participated in the panel for this research. Fifteen (34 %) of the 44 partic-ipants had been engaged in government-funded research at institutes, and 12 (27 %) had conducted research at a univer-sity. Ten (23 %) had worked at engineering companies, and 6 (14 %) had been civil servants working for national
institu-tions. Only one respondent had been engaged in a different profession. The age distribution of the respondents ranged from 20 to 60 yr, with a majority (84 %) falling between 30 and 49 yr. A large number of the respondents (72 %) had var-ious experiences in disaster assessment and establishment of disaster prevention measures, including flood prevention. In addition, most of the respondents (92 %) have acquired post-graduate degrees. Specific information on the interviewees is shown in Table 2.
4.1.2 Draft criteria
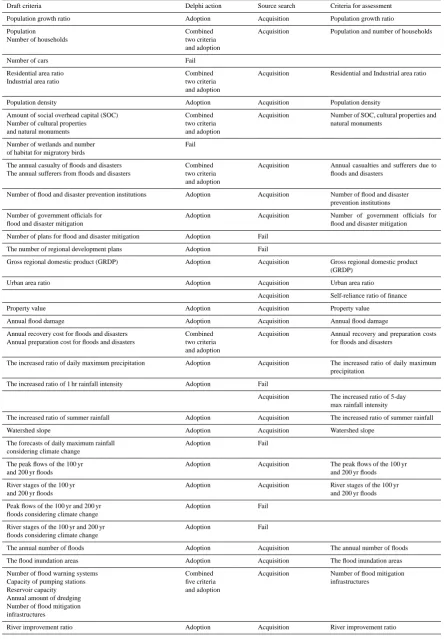
Some criteria for social risks were selected based on the PSIR framework. Four criteria for pressure were chosen: (1) pop-ulation growth ratio, (2) poppop-ulation, (3) number of house-holds, and (4) number of cars. These criteria could be used to determine the spatially quantified importance of flood man-agement. Six state criteria were considered: (1) residential area ratio, (2) industrial area ratio, (3) population density, (4) number of cultural properties and natural monuments, (5) amount of social overhead capital (SOC) and (6) number of wetlands and number of habitat for migratory birds. As in most developing countries, Korea has recently experienced rapid economic growth. Therefore, all of these criteria are in-fluential criteria for flood damage. (1) The annual casualty of floods and disasters and (2) the annual sufferers from floods and disasters were included in the criteria for impact. Three criteria for response were selected: (1) number of flood and disaster prevention institutions, (2) number of government officials for flood and disaster mitigation, and (3) number of plans for flood and disaster mitigation.
Fig. 6. Examples of evaluation databases for the study area.
could be pressure component. The following criteria for state were considered as barometers showing the state of flood risk vulnerability: (1) urban area ratio, and (2) property value. Annual flood damage was included in the criteria for impact because it could show properties that had been recently af-fected by flooding. Two criteria for response were chosen: (1) annual recovery cost for floods and disasters and (2) annual preparation cost for floods and disasters. These two measures can help reduce flood damage and vulnerability.
Fig. 7. Examples of FTNs.
Fig. 8. Normalized fuzzy matrix.
flood flow. Four hydrologic and hydraulic criteria for state were included: (1) the peak flows of the 100 yr and 200 yr floods, (2) river stages of the 100 yr and 200 yr floods, (3) peak flows of the 100 yr and 200 yr floods considering cli-mate change, and (4) river stages of the 100 yr and 200 yr floods considering climate change. Because all of these cri-teria are critical in hydrologic and hydraulic analyses, they can represent quantified risks for comparison. The criteria for impact were (1) the annual number of floods and (2) the flood inundation areas because these criteria can be di-rectly affected by floods. Finally, the following six criteria
Fig. 9. Comparison of the flood risk between the left and right banks.
for response were considered: (1) number of flood warning systems, (2) capacity of pumping stations, (3) reservoir ca-pacity, (4) annual amount of dredging, (5) number of flood mitigation infrastructures, and (6) river improvement ratio. These criteria were chosen because they are structural and nonstructural measures for reducing flood risk and damage.
4.1.3 Determination of criteria and weights
Respondents were only required to mark the line adjacent to one of the labels (Important, Necessary, Unimportant), and they could suggest other opinions and items in relation to the criteria. Essentially, a consensus on the suitability of the criteria could be determined if a certain percentage of votes fell within a prescribed range (Miller, 2006). An average of the participants’ responses was one method that aggregated the subjective judgments of the panelists to produce a collec-tive opinion. This method had been shown to be robust for aggregating a group’s judgment (Clemen, 1989; Clemen and Winkler, 1986; Wallsten et al., 1997; Winkler and Clemen, 2004). Thus, criteria were adopted if the mean and median were over 2.0. Furthermore, one criteria, Gross Regional Do-mestic Product (GRDP), was added based on the proposals of some experts. The GRDP is a sub-national gross domestic product that measures the size of a region’s economy. We se-lected the 27 criteria from Delphi method, but in fact, there are no factor for the target (reference) watershed since these are too difficult to obtain. Thus, we accepted those criteria and used more of the available collected data for evaluation. In the end, 24 criteria were adopted for the spatial flood risk vulnerability assessment of Han River basin. The procedure adopting criteria was shown in Table 3.
These criteria were divided into two hierarchical steps: themes (objectives) and causes-responses (PSIR framework). In addition, 8, 6 and 10 criteria were selected for the social, economic and hydrologic flood vulnerabilities, respectively.
Table 3. Determination of assessment criteria.
Draft criteria Delphi action Source search Criteria for assessment
Population growth ratio Adoption Acquisition Population growth ratio
Population Number of households
Combined two criteria and adoption
Acquisition Population and number of households
Number of cars Fail
Residential area ratio Industrial area ratio
Combined two criteria and adoption
Acquisition Residential and Industrial area ratio
Population density Adoption Acquisition Population density
Amount of social overhead capital (SOC) Number of cultural properties and natural monuments
Combined two criteria and adoption
Acquisition Number of SOC, cultural properties and natural monuments
Number of wetlands and number of habitat for migratory birds
Fail
The annual casualty of floods and disasters The annual sufferers from floods and disasters
Combined two criteria and adoption
Acquisition Annual casualties and sufferers due to floods and disasters
Number of flood and disaster prevention institutions Adoption Acquisition Number of flood and disaster prevention institutions
Number of government officials for flood and disaster mitigation
Adoption Acquisition Number of government officials for flood and disaster mitigation
Number of plans for flood and disaster mitigation Adoption Fail
The number of regional development plans Adoption Fail
Gross regional domestic product (GRDP) Adoption Acquisition Gross regional domestic product (GRDP)
Urban area ratio Adoption Acquisition Urban area ratio
Acquisition Self-reliance ratio of finance
Property value Adoption Acquisition Property value
Annual flood damage Adoption Acquisition Annual flood damage
Annual recovery cost for floods and disasters Annual preparation cost for floods and disasters
Combined two criteria and adoption
Acquisition Annual recovery and preparation costs for floods and disasters
The increased ratio of daily maximum precipitation Adoption Acquisition The increased ratio of daily maximum precipitation
The increased ratio of 1 hr rainfall intensity Adoption Fail
Acquisition The increased ratio of 5-day max rainfall intensity
The increased ratio of summer rainfall Adoption Acquisition The increased ratio of summer rainfall
Watershed slope Adoption Acquisition Watershed slope
The forecasts of daily maximum rainfall considering climate change
Adoption Fail
The peak flows of the 100 yr and 200 yr floods
Adoption Acquisition The peak flows of the 100 yr and 200 yr floods
River stages of the 100 yr and 200 yr floods
Adoption Acquisition River stages of the 100 yr and 200 yr floods
Peak flows of the 100 yr and 200 yr floods considering climate change
Adoption Fail
River stages of the 100 yr and 200 yr floods considering climate change
Adoption Fail
The annual number of floods Adoption Acquisition The annual number of floods
The flood inundation areas Adoption Acquisition The flood inundation areas
Number of flood warning systems Capacity of pumping stations Reservoir capacity Annual amount of dredging Number of flood mitigation infrastructures
Combined five criteria and adoption
Acquisition Number of flood mitigation infrastructures
Fig. 10. Normalised input data of the characterised themes.
Feedback to panelists on the reasons for their ratings has been shown to improve the accuracy of group judgments (Somerville, 2007). Rowe and Wright (1999) reported on studies that compared “reasons” or “rationale” feedback to statistical feedback, such as mean and median. They con-cluded that there was greater improvement in the accuracy of judgments in successive rounds of the Delphi process when the panelists’ reasoning or rationale for their ratings were given to the other panelists in the group, as opposed to pan-elists receiving only statistical feedback.
Thus, this process was divided into two parts. First, the respondents subjectively determined the weights. Then, they received the previous results as feedback and reevaluated the weights based on this information. The collected weights in Table 4 based on the hierarchy were as follows: (1) themes (objectives) – social, economic, and hydrologic risk, (2) causes – pressure, state, impact, and response, and (3) 24 in-dividual criteria.
The weights of the three themes (Wsn; n=1, 2, 3), the four elements of the PSIR framework (Wf n;n=1, . . . , 4), and each criteria (Win;n=1, . . . , 24) were determined based on the survey results. A tree structure was used to obtain the final weights (Wn;n=1, . . . , 24). The final weights for the criteria at each twig of the tree were obtained by multiplying through the branches. To follow this procedure, we combined the weights of the criteria, the elements of the PSIR frame-work, and the three themes. As a result, the most important theme was found to be hydrologic risk. It is weighted atWs3
(0.74, 0.93, 0.95). For the PSIR framework, the Impact factor shows a higher weight than the other elements.
Table 4. Hierarchy tree of weights.
Pool first Pool peak Pool last
Social criteria (Ws1) 0.16 0.36 0.55
Pressure
(Ws1−f1) 0.30 0.45 0.62
Population growth ratio (Wi1) 0.31 0.50 0.69
Population and number of households (Wi2) 0.49 0.65 0.80 State
(Ws1−f2) 0.23 0.40 0.60
Residential and industrial area ratio (Wi3) 0.30 0.47 0.66
Population density (Wi4) 0.45 0.64 0.78
Number of SOC, cultural properties and natural monuments (Wi5) 0.25 0.39 0.57 Impacts
(Ws1−f3) 0.37 0.55 0.73
Annual casualties and sufferers due to floods and disasters (Wi6) 0.62 0.80 0.92 Response
(Ws1−f4) 0.18 0.32 0.50
Number of flood and disaster prevention institutions (Wi7) 0.23 0.41 0.60 Number of government officials for flood and disaster mitigation (Wi8) 0.39 0.57 0.73
Economic criteria (Ws2) 0.30 0.54 0.69
Pressure
(Ws2−f1) 0.19 0.33 0.50
Gross regional domestic product (GRDP) (Wi9) 0.32 0.51 0.70 State
(Ws2−f2) 0.34 0.52 0.68
Urban area ratio (Wi10) 0.41 0.59 0.75
Self-reliance ratio of finance (Wi11) 0.28 0.45 0.64
Property value (Wi12) 0.39 0.55 0.70
Impacts
(Ws2−f3) 0.41 0.59 0.74
Annual flood damage(Wi13) 0.73 0.89 0.97
Response
(Ws2−f4) 0.28 0.45 0.63
Annual recovery and preparation costs for floods and disasters (Wi14) 0.63 0.80
Hydrologic criteria (Ws3) 0.74 0.93 0.95
Pressure
(Ws3−f1) 0.31 0.48 0.65
Increased ratio of daily maximum precipitation (Wi15) 0.38 0.55 0.71 Increased ratio of 1-hr rainfall intensity (Wi16) 0.47 0.64 0.77 Increased ratio of summer rainfall (Wi17) 0.25 0.41 0.59
Watershed slope(Wi18) 0.13 0.25 0.43
State
(Ws3−f2) 0.36 0.53 0.70
Peak flow of the 100 yr and 200 yr floods (Wi19) 0.35 0.54 0.71 River stage of the 100 yr and 200 yr floods (Wi20) 0.38 0.55 0.71 Impacts
(Ws3−f3) 0.4 0.58 0.75
Annual number of floods (Wi21) 0.48 0.68 0.84
Flood inundation area (Wi22) 0.55 0.73 0.87
Response
(Ws3−f4) 0.23 0.4 0.58
Number of flood mitigation infrastructures (Wi23) 0.35 0.53 0.69
River improvement ratio (Wi24) 0.37 0.56 0.75
4.2 Data acquisition and fuzzification (Step 2)
Each dataset was collected from reliable authorities, such as government agencies, the national statistical office and the national emergency management agency. Their sources are shown in Table 5. The collected data were spatially analysed using GIS tools, as shown Fig. 6.
Table 5. Sources of the input data.
Criteria (measure) Data services and preparation Year
Population growth ratio (%), Population and number of house-holds (man and number), Residential and industrial area ratio (%), Population density (man/1km2), Gross regional domestic product (KRW), Urban area ratio (%), Self-reliance ratio of fi-nance (%), Property value (KRW), River improvement ratio (%)
Statistics Korea 2012
Increased ratio of daily maximum precipitation (%), Increased ratio of 1 hr rainfall intensity (%), Increased ratio of summer rainfall (%)
Korea Meteorological Administration 2007–2012
Annual number of floods (number/yr) National Emergency Management Agency 2001–2011
Annual casualties and sufferers due to floods and disasters (number/yr), Number of flood and disaster prevention institu-tions (number/year), Annual flood damage (number/yr), Flood inundation area (km2)
Water Management Information System 1971–2009
Number of social overhead capital, cultural properties and nat-ural monuments (number), Number of government officials for flood and disaster mitigation (number), Annual recovery and preparation costs for floods and disasters (KRW/yr), Number of flood mitigation infrastructures (number)
Local governments 2012
Watershed slope (deg) National Geographic Information Institute 2012
Peak flow of the 100 yr and 200 yr floods (m3/s), River stage of the 100 yr and 200 yr floods (m)
Flood frequency analysis using unsteady flow model with historical flood events of Han river flood control office
1987–2010
Table 6. Similarities and rankings of all sections.
Left Bank Right Bank
Unit d+ d− SUM C+ Rank Unit d+ d− SUM C+ Rank
Fig. 11. Comparison of social, economic and hydrologic vulnera-bility.
be assessed using fuzzy TOPSIS. This study determined the number of class intervals required for Eq. (16). This equa-tion was suggested by Panofsky and Briery (1968). Figure 7 shows data fuzzification examples. However, if a province has a value or very little variability, a value of 1 is used.
k=5log10n (16)
4.3 Assessment using fuzzy TOPSIS (Step 3)
From the methods of Step 3, described in Sect. 2.1, we de-rived a performance matrix, such as in Eq. (4), and a weight-ing value matrix, such as in Eq. (3). Then, we calculated the weighted performance, as shown in Eq. (7), and renor-malised FPISs and FNISs for the fuzzy TOPSIS approach were selected as they are the maximum and minimum val-ues (Fig. 8), respectively. The distances from the FPIS and FNIS for each alternative were calculated using Eq. (11). And the rank of vulnerability was determined by the opti-mum membership degrees using Eq. (12), as in Table 6. To compare the results of the 20 bank sections, ranking sets are presented in Fig. 9. U6 and U18 of the left bank were found
Fig. 12. Comparison of pressure-state-impact-response values (U18 and U31).
to be the most vulnerable regions, while U26 and U38, the corresponding sections of the opposite banks, showed the least vulnerable conditions. On the other hand, both U11 and U31 which located at the opposite side bank each other showed very vulnerable.
Fig. 13. Spatial flood vulnerability results for the South Han River.
whereas the U18 and U31 were to be strongly influenced by the hydrological criteria. In case of U18, four of hydro-logical criteria, (1) annual number of floods, (2) flood in-undation area, (3) watershed slope and (4) increased ratio of daily maximum precipitation were the highest values in normalised performance matrix. U11 which was similarly situated with U6, was represented by high values of three hydrological criteria, (1) annual number of floods and (2) flood inundation area. In contrast, relatively low value of eco-nomic criteria could be identified at U11, which especially respected by two aspects: (1) self-reliance ratio of finance and (2) annual recovery and preparation costs for floods and disasters.
In addition, the specific values of U18 and U31 which re-spectively are the most vulnerable section in each side bank are compared to investigate into the relationship between three sustainability components and PSIR components, as shown in Fig. 12. The hydrologic vulnerabilities of two sec-tions are very similar. The influences of response, pressure and impact are much larger than that of state. Social and eco-nomic criteria have very variable PSIR vulnerabilities. The social criteria are affected evenly by PSIR, while state, im-pact and response are the most predominant components for
U18. In case of U31, similarly, the impact criteria of three sustainability components were dominant and social crite-ria of PSIR components were relatively unbiased as shown Fig. 12b. The PSIR value of economic criteria in U31 is very biased to state and impact criteria. In the end, the response criteria are very important for U18, while impact criteria are critical for U31. Also, the economic criteria for pressure and hydrologic criteria for state are less important to U18 while economic criteria for pressure and response and hydrologic criteria for state are less critical to U31. Using this figure, de-cision maker can guess what kinds of strategies are necessary for each section.
Finally, we graded all sub-watersheds and related river sections by five standards, as shown in Fig. 13. Each reach section has two different grades for the right and left banks. That is, a flood risk manager should, discriminately, con-sider both quantified risk values for flood damage mitigation projects.
5 Conclusions
This IFFVA approach is a new procedure that combines spatial fuzzy vulnerability MCA with the traditional linear probabilistic risk approach because it couples the watershed-based vulnerability framework with stream-watershed-based risk analy-sis.
This procedure consists of three steps. In the first step, as-sessment criteria and their weights were determined using the Delphi technique. That is, an integrated approach was pro-posed to determine all feasible criteria for flood vulnerability quantification in the Han River (Korea) using the following methods. First, some social, economic and hydrologic crite-ria were collected using PSIR framework. Second, all critecrite-ria and their weights were determined by a survey of experts us-ing the Delphi technique. The second step is to acquire and fuzzify all data. We divided the study basin into stream-based areas on which the evaluation of flood risk is performed using a GIS tool. Proxy data were acquired for 40 units of 20 river sections. To reduce uncertainty, the fuzzy concept was intro-duced to quantify the weighting values and input data of the proxy variables. In the last step, we quantified the flood risks to all stream sections including their adjacent watersheds, us-ing the fuzzy TOPSIS approach.
In the application for Han River, the hydrologic criteria are concluded to be the most critical factors from the Delphi pro-cess and the most significant from the fuzzy TOPSIS. The different vulnerability was derived at opposite bank in one reach section. Also, each reach section has its own weakness from its individual vulnerability quantifications by three sus-tainability component and PSIR framework. Therefore, the discriminative management strategy to each bank and each reach section is sure to be required.
stakeholders can be included in consensus building and vari-ous uncertainties inherent in decision making process can be incorporated.
Acknowledgements. This study was financially supported by the Construction Technology Innovation Programme (08-Tech-Inovation-F01) through the Research Center of Flood Defence Technology for the Next Generation at the Korea Institute of Construction & Transportation Technology Evaluation and Plan-ning (KICTEP) of the Ministry of Land, Transport and Maritime Affairs (MLTM). It was also supported in part by the Basic Science Research Programme of the National Research Foundation of Korea (NRF) funded by the Ministry of Education, Science and Technology (2010-0010609).
Edited by: M. Parise
Reviewed by: two anonymous referees
References
Adger, V.: Vulnerability, Glob. Environ. Change, 16, 268–281, 2006.
Adler, M. and Ziglio, E.: Gazing into the oracle: The Delphi method and its application to social policy and public health, Jessica Kingsley Publishers, London, 1996.
Afshar, A., Mari˜no, M. A., Saadatpour, M., and Afsahr, A.: Fuzzy TOPSIS multi-criteria decision analysis applied to Karun reser-voirs system, Water Resour. Manage., 25, 545–563, 2011. Agyemang, I., McDonald, A., and Carver, S.: Application of the
DPSIR framework to environmental degradation assessment in northern Ghana, Nat. Resour. Forum, 31, 212–225, 2007. Akter, T. and Simonovic S. P.: Aggregation of fuzzy views of a
large number of stakeholders for multi-objective flood manage-ment decision-making, J. Environ. Manage., 77, 133–143, 2005. Angus, A. J., Hodge, I. D., McNally, S. and Sutton, M. A.: The setting of standards for agricultural nitrogen emissions: A case study of the Delphi technique, J. Environ. Manage., 69, 323–337, 2003.
Balica, S. F, Popescu, I., Beevers, L., and Wright, N. G.: Parametric and physically based modelling techniques for flood risk and vul-nerability assessment: A comparison, Environ. Modell. Softw., 41, 84–92, 2013.
Benini, L., Bandini, V., Marazza, D., and Gontin, A.: Assessment of land use changes through an indicator-based approach: a case study from Lamone river basin in Nothern Italy, Ecol. Indicat., 10, 4–14, 2010.
Chen, H. W. and Chang, N. B.: Using fuzzy operators to address the complexity in decision making of water resources redistribution in two neighboring river basins, Adv. Water Resour., 33, 652– 666, 2010.
Chen, S. J. and Hwang, C. L.: Fuzzy multiple attribute decision making: method and application, Lecture notes in economics and mathematical systems, 375, Springer, New York, 1992. Chu, T. C.: Selecting plant location via a fuzzy TOPSIS approach,
Int. J. Adv. Manuf. Tech., 20, 859–864, 2002.
Chung, E. S. and Lee, K. S.: Prioritization of water management for sustainability using hydrologic simulation model and
mul-ticriteria decision making techniques, J. Environ. Manage., 90, 1502–1511, 2009a.
Chung, E. S. and Lee, K. S.: Identification of spatial ranking of hy-drological vulnerability usingmulticriteria decision making tech-niques: Case study of Korea, Water Resour. Manage., 23, 2395– 2416, 2009b.
Chung, E. S., Hong, W. P., Lee, K. S., and Burian, S. J.: Integrated use of a continuous simulation model and multi-attribute deci-sion amking for ranking urban watershed management alterna-tives, Water Resour. Manage., 25, 641–659, 2011.
Clemen, R. T.: Combining forecasts: A review and annotated bibli-ography, Int. J. Forecasting, 5, 559–583, 1989.
Clemen, R. T. and Winkler, R. L.: Combining economic forecasts, J. Bus. Econ. Stat., 4, 39–46, 1986.
CRED: Centre for Research on the Epidemiology and Disasters publications: http://www.cred.be, last access: 11 March 2012. de Moel, H., van Alphen, J., and Aerts, J. C. J. H.: Flood maps in
Europe – methods, availability and use, Nat. Hazards Earth Syst. Sci., 9, 289–301, doi:10.5194/nhess-9-289-2009, 2009. Economic and Social Commission for Asia and the Pacific:
Guide-lines on Strategic Planning and Management of Water Resources, United Nations, New York, 2004.
European Environment Agency: Europe’s Environment: the Dobris Assessmen, Copenhagen, Denmark, 1995.
Fekete, A.: Validation of a social vulnerability index in context to river-floods in Germany, Nat. Hazards Earth Syst. Sci., 9, 393– 403, doi:10.5194/nhess-9-393-2009, 2009.
Fekete, A.: Assessment of social vulnerability to river flood in Ger-many, ph.D.thesis, UNU-EHS, Bonn, GerGer-many, 85 pp., 2010. Frerks, G., Bankoff, G., and Hilhorst, D.: Mapping vulnerability:
Disasters, development and people, Earthscan, London, 2004. Fu, G.: A fuzzy optimization method for multi-criteria decision
making: An application to reservoir flood control operation, Ex-pert Syst. Appl., 34, 145–149, 2008.
Giupponi, C., Mysiak, J., Fassio, A., and Cogan, V.: MULINO-DSS: A computer tool for sustainable use of water resources at the catchment scale, Math. Comput. Simul., 64, 13–24, 2004. Giupponi, C., Fassio, A., Fe´as V`azquez, F., and Mysiak, J.:
Sustain-able water management and policy making, in: SustainSustain-able Man-agement of Water Resources – An Integrated Approach, edited by: Giupponi, C., Jakeman, A. J., Karssenberg, D., and Hare, M. P., 71–97, 2006.
Gordon, T. J.: The Delphi method, Washington, DC, American Council for the United Nations University, 1994.
Green, C.: The evaluation of vulnerability to flooding, Disaster Pre-vention and Management, 13, 323–329, 2004.
Helmstadter, G. C.: Principles of psychological measurement, New York, Appleton Century-Crofts, ISBN: 0137096674 9780137096671, 1964.
Holman, I. P., Rounsevell, M. D. A., Shackley, S., Harrison, P. A., Nicholls, R. J., Berry, P. M., and Audsley, E.: A regional, multi-sectoral and integrated assessment of the impacts of climate and socio-economic change in the UK, Climatic Change, 71, 9–41, 2005.
Hwang, C. L. and Yoon, K.: Multiple attributes decision-making methods and applications, Springer, Heidelberg, 1981.
Jun, K. S., Chung, E. S., Sung J. Y., and Lee K. S.: Development of spatial water resources vulnerability index considering climate change impacts, Sci. Tot. Environ., 409, 5228–5242, 2011. Jun, K. S., Chung, E. S., Kim, Y. G., and Kim, Y.: A fuzzy
multi-criteria approach to flood risk vulnerability in South Korea by considering climate change impacts, Expert Syst. Appl., 40, 1003–1013, 2012.
Kagalou, I., Leonardos, I., Anastasiadou, C., and Neofytou, C.: The DPSIR Approach for an Integrated River Management Frame-work. A Preliminary Application on a Mediterranean Site (Kala-mas River -NW Greece), Water Resour. Manage., 26, 1677– 1692, 2012.
Kaplan, M., Renaud, F. G., and L¨uchters, G.: Vulnerability assess-ment and protective effects of coastal vegetation during the 2004 Tsunami in Sri Lanka, Nat. Hazards Earth Syst. Sci., 9, 1479– 1494, doi:10.5194/nhess-9-1479-2009, 2009.
Karageorgis, A. P., Skourtos, M. S., Kapsimalis, V., Konto-gianni, A. D., Skoulikidis, N. Th., Pagou, K., Nikolaidis, N. P., Drakopoulou, P., Zanou, B., Karamanos, H., Levkov, Z., and Anagnostou, Ch.: An integrated approach to watershed manage-ment within the DPSIR framework: Axios River catchmanage-ment and Thermaikos Gulf, Reg. Environ. Change, 5, 138–160, 2005. Keeney, R. L. and Raiffa, H.: Decision with Multiple
Objectives-Preferences and Value Tradeoffs, Cambridge University Press, Cambridge, 1993.
Kienberger, S., Lang, S., and Zeil, P.: Spatial vulnerability units – expert-based spatial modelling of socio-economic vulnerability in the Salzach catchment, Austria, Nat. Hazards Earth Syst. Sci., 9, 767–778, doi:10.5194/nhess-9-767-2009, 2009.
Kim, G., Park, C. S., and Yoon, K. P.: Identifying investment oppor-tunities for advanced manufacturing systems with comparative-integrated performance measurement, Int. J. Prod. Econ., 50, 23– 33, 1997.
King, D.: Uses and limitations of socioeconomic indicators of com-munity vulnerability to natural hazards: data and disasters in Northern Australia, Nat. Hazards, 24, 147–156, 2001.
Knight, F. H.: Risk, Uncertainty, and Profit, Houghton Mifflin, New York, 1921.
Lee, K. S. and Chung, E. S.: Development of integrated watershed management schemes for an intensively urbanized region in Ko-rea, J. Hydro-Environ. Res., 1, 95–109, 2007.
Linstone, H. A. and Turoff, M.: The Delphi method: Techniques and application, Addison-Wesley Publishing Company Advanced Book Program, 3, 1975.
Merz, B., Thieken, A. H., and Gocht, M.: Flood risk mapping at the local scale: concepts and challenges, edited by: Begum, S., Stive, M. J. F., and Hall, J. W., in: Flood Risk Management in Europe, 25, Adv. Nat. Technol. Haz. Res., Springer, Netherlands, 231– 251, 2007.
Messner, F. and Meyer, V.: Flood damages, vulnerability and risk perception challenges for flood damage research, in: Flood Risk Management: Hazards, Vulnerability and Mitigation Measures, edited by: Schanze, J., Zeman, E., and Marsalek, J., Springer, 149–167, 2006.
Meyer, V., Scheuer, S., and Haase, D.: A multictiteria approach for flood risk mapping exemplified at the Mulderiver, Germany, Nat. Hazards, 48, 17–39, 2009.
Millar, K., Tomkins, S., Thorstensen, E., Mepham, B., and Kaiser, M.: Ethical Delphi manual, 2006, http://www.ethicaltools.info/,
last access: 11 March 2013.
Miller, L. E.: Determining what could/should be : The Delphi tech-nique and its application, in: the meeting of the 2006 annual meeting of the Mid-Western Educational Research Association, Columbus, Ohio, 2006.
Murphy, M. K., Black, N., Lamping, D. L., McKee, C. M., Sander-son, C. F. B., Askham, J., and Marteau, T.: Consensus develop-ment methods and their use in clinical guideline developdevelop-ment, Health Technol. Assess., 2, 37, 1998.
National Emergency Management Agency: Disaster Report, 11-1660000-000032-10, 893–894, Republic of Korea, 2011 (in Ko-rean).
Newton, A., Icely, J. D., Falcao, M., Nobre, A., Nunes, J. P., Fer-reira, J. G., and Vale, C.: Evaluation of eutrophication in the Ria Formosa coastal lagoon, Portugal, Cont. Shelf Res., 23, 1945– 1961, 2003.
Odermatt, S.: Evaluation of mountain case studies by means of sus-tainability variables, Mt. Res. Dev. 24, 336–341, 2004.
Organisation for Economic Co-operation and Development: OECD Core Set of Indicators for Environmental Performance Reviews, Environ. Monogr. No. 83, Paris, 39 pp., 1993.
Panofsky, H. A. and Brier, G. W.: Some Application of Statistics to Meteorology, Pennsylvania State University Press USA, 5, 1968. Pirrone, N., Trombino, G., Cinirella, S., Algieri, A., Bendoricchio, G., and Palmeri, L.: The Driver-Pressure-State-Impact-Response (DPSIR) approach for integrated catchment-coastal zone man-agement: preliminary application to the Po catchment-Adriatic Sea coastal zone system, Reg. Environ. Change, 5, 111–137, 2005.
Powell, C.: The Delphi technique: myths and realities, J. Adv. Nurs., 41, 376–382, 2002.
Raheja, S., Dadhich, R., and Rajpal, S.: An Alternative Interpreta-tion of Linguistic Variables as Linguistic Finite Automata, Int. J. Comp. Sci. Issues, 8, 428–432, 2011.
Richey, J. S., Mar, B. W., and Horner, R. R.: The Delphi technique in environmental assessment I. Implementation and effectiveness, J. Environ. Manage., 21, 135–146, 1985.
Rowe, G. and Wright, G.: The Delphi technique as a forecasting tool: Issues and analysis, Int. J. Forecast., 15, 353–375, 1999. (RPA): Risk and Policy Analysts Ltd.: Evaluating a multi-criteria
analysis methodology for application to flood management and coastal defence appraisals, R&D Technical Report, DEFRA, 2004.
Sackman, H.: Delphi Critique: Lexington books, Massachusetts, Lexington, 1975.
Sayers, P., Mice, C., Hall, J., Dawson, R., Rosu, C., Chatterton, J., and Deakin, R.: Risk Assessment of Flood and Coastal Defenses for Strategic Planning (rasp) – a High Level Methodology, HR Wallingford, http://www.rasp-project.net/, last access: 11 March 2013.
Scheren, P. A. G. M., Kroeze, C., Janssen, F. J. J. G., Hordijk, J., and Ptasinski, K. J.: Integrated water pollution assessment of the Ebri´e Lagoon, Ivory Coast, West Africa, J. Mar. Syst., 44, 1–17, 2004.
Sebald, C.: Towards an Integrated Flood Vulnerability Index: A Flood Vulnerability Assessment, Master of Science (MSc), 2010. Shih, H. S., Shyur, H. J., and Lee, E. S.: An extension of TOPSIS for group decision making, Math. Comput. Model., 45, 801–813, 2007.
Simonovic, S. P. and Verma, R.: A new methodology for water re-sources multicriteria decision making under uncertainty, Phys. Chem. Earth, 33, 322–329, 2008.
Simonovic, S. P. and Niruoama: A spatial multi-objective decision-making under uncertainty for water resources management, J. Hydroinform., 7, 117–133, 2005.
Smith, K.: Environmental Hazards: Assessing Risk and Reducing Disaster, Routledge, London, 2004.
Somerville, J. A.: Critical factors affecting the meaning assessment of student learning outcomes: a Delphi study of the opinions of community college personnel, Oregon State University, Corval-lis, OR. ph.D degree, 2007
Thinh, N. X. and Vogel, R.: GIS-based multiple criteria analysis for land-use suitability assessment in the context of flood risk management, InterCarto – InterGIS 12, Berlin, 2006.
Torlak, G., Sevkli, M., Sanal, M., and Zaim, S.: Analyzing busi-ness competition by using fuzzy TOPSIS method: An example of Turkish domestic airline industry, Expert Syst. Appl., 38, 3396– 3406, 2011.
Tscherning, K., Helming, K., Krippner, B., Sieber, S., and Paloma, S. G.: Does research applying the DPSIR framework support de-cision making?, Land Use Policy, 29, 102–110, 2012.
Turner, R. K., Subak, S., and Adger, W. N.: Pressures, trends, and impacts in coastal zones: interactions between socioeconomic and natural systems, Environ. Manage., 20, 159–173, 1996.
United Nations (UN): Indicators of sustainable development: Framework and Methodologies, 428 pp., 1996.
Wallsten, T. S., Budescu, D. V., Erev, I., and Diederich, A.: Evalu-ating and combining subjective probability estimates, J. Behav. Decis. Making, 10, 243–268, 1997.
Wang, Y., Li, Z., Tang, Z., and Zeng, G.: A GIS-Based Spa-tial Multi-Criteria Approach for Flood Risk Assessment in the Dongting Lake Region, Hunan, Central China, Water Resour. Manag., 25, 3465–3484, 2009.
Winkler, R. L. and Clemen, R. T.: Multiple experts vs. multiple methods: Combining Correlation assessments, Decision Analy-sis, 1, 167–176, 2004.
WSM: A Comprehensive Decision Support System for the Devel-opment of Sustainable Water Management Strategies, EU DG Research, Contract No: EVK1-CT-2001-00098, 2004.
Yang, J.-S., Chung, E.-S., Kim, S.-U., and Kim, T.-W.: Prioritization of water management under climate change and urbanization us-ing multi-criteria decision makus-ing methods, Hydrol. Earth Syst. Sci., 16, 801–814, doi:10.5194/hess-16-801-2012, 2012. Yazdani-Chamzini, A. and Yakhchali, S. H.: Tunnel Boring
Ma-chine (TBM) selection using fuzzy multicriteria decision mak-ing methods, Tunnellmak-ing and Underground Space Technology, 30, 194–204, 2012.