Transplant Research and Risk Management
Dove
press
R e v i e w
open access to scientific and medical research
Open Access Full Text Article
everolimus in kidney transplantation
James e Cooper1
Uwe Christians2
Alexander C wiseman1
1Division of Renal Diseases and
Hypertension, Transplant Center,
2iC42 integrated Solutions in Systems
Biology for Clinical Research and Development, University of Colorado Denver, Aurora, CO, USA
Correspondence: Alexander wiseman Transplant Center, University of Colorado Denver Health Sciences Center, Mail Stop F749, AOP 7089,1635 North Aurora Court, Aurora, CO 80045, USA Tel +1 720 848 0860
Fax +1 720 848 2238
email alexander.wiseman@ucdenver.edu
Abstract: Everolimus is a novel target of rapamycin (mTOR)-I analog that has recently been approved in combination with cyclosporine A and steroids for use in the prevention of organ rejection in kidney transplant recipients. Compared with rapamycin, everolimus is characterized by a shorter half-life and improved bioavailability. Prior to US Food and Drug Administration approval, a number of Phase II and III clinical trials were undertaken to evaluate the effective-ness of everolimus in combination with calcineurin inhibitors for preventing acute rejection and promoting allograft survival in kidney transplant recipients. In this report, we review the pharmacokinetic properties of everolimus, the clinical efficacy studies that led to its approval for use in kidney transplantation, as well as reported data on patient safety and tolerability associated with its use.
Keywords: mTOR inhibitors, kidney transplantation, everolimus
Introduction
Identification of the potent immunosuppressive properties characteristic of sirolimus 20 years after its discovery as an antifungal and antitumor agent on Easter Island in 1969 has led to widespread interest in mammalian targets of rapamycin inhibitors (mTOR-Is) as potential maintenance therapy for kidney transplant recipients. The relative lack of nephrotoxicity associated with chronic mTOR-I use has generated further hope that these agents could either lessen the burden or replace calcineurin inhibitors altogether, which are well known to be effective immunosuppressants but have considerable potential for chronic nephrotoxicity. Everolimus is a novel structural analog of sirolimus designed to improve oral bioavailability, and has been approved by the US Food and Drug Administration for use in advanced renal cell carcinoma, subependymal giant cell astrocytoma, and drug-eluting coronary stents. Everolimus was previously approved in Europe for use in adult kidney and heart transplant recipients and in the US in combination with reduced-dose calcineurin inhibitors and steroids for adult recipients at low-to-moderate risk in 2010. In this review, we discuss the pharmacodynamic and pharmacokinetic properties of everolimus, the clinical trials of efficacy in kidney transplant recipients, as well as the safety and tolerability profiles associated with its use.
Background
Kidney transplantation remains the only curative option for end-stage renal disease, and offers both quality of life and survival benefits over chronic dialysis.1,2 The evolution
Transplant Research and Risk Management downloaded from https://www.dovepress.com/ by 118.70.13.36 on 27-Aug-2020
For personal use only.
Number of times this article has been viewed
This article was published in the following Dove Press journal: Transplant Research and Risk Management
Dovepress
Cooper et al
of immunosuppression protocols for kidney transplant recipients over the last five decades has resulted in dramatic improvements in acute rejection rates and allograft survival. The introduction of the calcineurin inhibitor, cyclosporine A, in the early 1980s gave rise to possibly the most striking improvement in graft outcomes, lowering acute rejection rates by half and increasing 1-year graft survival from 50% to over 80% compared with the previous azathioprine/pred-nisone era.3 In current practice, tacrolimus in combination
with Cellcept® (mycophenolate mofetil) or mycophenolic
acid accounts for over 80% of post-kidney transplant immu-nosuppression regimens in the US, and is associated with a 1-year graft survival rate of 91%–95%.4
While widespread use of the calcineurin inhibitors, cyclosporine A and tacrolimus, has had an important role in the improved short-term graft outcomes of the more recent eras, the nephrotoxic nature of these immunosuppressants results in considerable potential for chronic graft damage.5
With little improvement in long-term graft outcomes in recent years,6,7 there has been more focus on identifying less
neph-rotoxic options for chronic maintenance immunosuppression. Identification of the mammalian target of rapamycin inhibitor (mTOR-I), sirolimus, as a potent immunosuppressant with minimal nephrotoxicity has led to numerous clinical trials investigating its use in a variety of calcineurin inhibitor mini-mization strategies, including withdrawal,8 early conversion,9
late conversion,10 and complete avoidance.11
Despite these efforts, the use of sirolimus in kidney transplant maintenance immunosuppression regimens has remained limited due to concerns regarding efficacy, side effects, and patient tolerability. The mTOR-I, everolimus, was first described in 1997 as a structural analog of siroli-mus.12 Both sirolimus and everolimus are only available as
oral formulations, and compared with sirolimus, everolimus has improved solubility, 60% greater bioavailability, a shorter half-life (28 vs 60 hours), and more rapid achievement of steady-state levels (4 vs 6 days).12–14 Preclinical studies have
demonstrated an immunosuppressive synergism between everolimus and cyclosporine A,15 and clinical trials have
therefore largely focused on the efficacy of everolimus in combination with various doses of cyclosporine A. These studies will be described in detail following a summary of the mechanism of action and pharmacological properties of everolimus.
Mechanism of action
As a first step, everolimus binds to its intercellular target, the immunophilin FK506-binding protein 12 (FKBP12),
which also binds tacrolimus. However, instead of inhibiting calcineurin like the tacrolimus-FKBP12 complex, the everolimus-FKBP12 complex inhibits mTOR, which causes an arrest in the G1 cell cycle.16 mTOR belongs to the
phospho-inositide 3-kinase-related protein kinase family, and its signaling pathway couples energy and nutrient abun-dance to the execution of cell growth and division, owing to the ability of TOR protein kinase to simultaneously sense energy, nutrients, stress, and growth factors.16 Mammalian
TOR complex 1 (mTORC1) and mTORC2 exert their actions by regulating other important kinases, such as S6 kinase and Akt. At therapeutically relevant concentrations, the everolimus-FKBP12 complex mainly inhibits mTORC1 and thus inactivates the p70 S6 kinase in lymphocytes, resulting in selective inhibition of the synthesis of ribosomal proteins and thus immunosuppression.17,18 Everolimus has a 2.1-fold
weaker binding affinity for FKBP12 than sirolimus.16 X-ray
crystallographic studies of the FKBP12-everolimus complex have revealed a three-dimensional structure very similar to that of the FKBP12-sirolimus complex.19,20 However, the
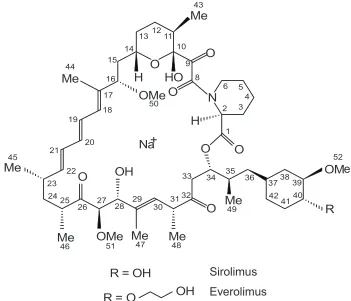
lower binding affinity to FKBP12 can be explained by the fact that C(40) alkylation disrupts the hydrogen bond exist-ing between the FKBP12-sirolimus complex and between the C(40) hydroxyl and the Gln-53 main chain carbonyl.16
Accordingly, everolimus inhibition of interleukin-6-stim-ulated lymphocyte proliferation was found to be 2.5-fold weaker than sirolimus.16 Figure 1 illustrates the structural
difference between everolimus and sirolimus.
Pharmacokinetics
One rationale for developing everolimus was its higher oral bioavailability compared with sirolimus.16 A study in rats
showed the oral bioavailability of everolimus to be 16%, and thus higher than that of sirolimus (10%).13 Everolimus
and sirolimus are substrates for P glycoprotein-like-mediated efflux transporters in the intestine. However, sirolimus is also partially removed from cells by a second efflux system that does not interact with everolimus,21 and it can be speculated
that this is one of the reasons for the better oral bioavail-ability of everolimus.
Another major difference between sirolimus and everoli-mus is the shorter terminal half-life of the latter. Depending on the patient population studied (healthy individuals or transplant patients) the average half-life of everolimus is 18–35 hours vs 60 hours for sirolimus.22 As a result of this
shorter half-life, as well as development aimed at copre-scription with cyclosporine A, everolimus is dosed twice daily. The shorter half-life of everolimus has several clinical
Transplant Research and Risk Management downloaded from https://www.dovepress.com/ by 118.70.13.36 on 27-Aug-2020
Dovepress everolimus in kidney transplantation
advantages, ie, no loading dose is necessary for everolimus, the steady state is reached faster, and the drug is eliminated more rapidly, translating into a more rapid patient response after dose change. Dose adjustments of everolimus should be based on trough concentrations obtained 4–7 days after a previous dosing change.22
The clinical pharmacokinetics of everolimus have been reviewed in detail.22 Everolimus is rapidly absorbed, and
peak concentrations are reached after 1.3–1.8 hours.23,24
Steady-state peak and trough concentrations, as well as areas under the concentration-time curve (AUC) are proportional to dosage. In blood, everolimus is .75% protein-bound,23
and distributes more than 75% into blood cells. Thus, as is the case for cyclosporine A, tacrolimus, and sirolimus, everolimus is generally not removed by dialysis, and ethylenediamine tetra-acetic acid whole blood is used for therapeutic drug monitoring.22
Metabolism and elimination
Everolimus is extensively metabolized in the small intestine and liver and, as aforementioned, 98% of the drug is elimi-nated via bile in the form of metabolites.22 Most of the known
metabolites are the product of oxidative metabolism gener-ated by cytochrome P450 (CYP)3A4 and CYP3A5 enzymes,
resulting in hydroxylated and/or demethylated metabolites (Figure 2B).25 A minor metabolic pathway in adults is via
CYP2C8, which is potentially of greater importance in young children.26,27 A unique phosphocholine ester metabolite has
also been identified that shows good binding to FKBP12, but only weak inhibition of mTOR.28 The structures of the
major metabolites generated after incubation of everolimus with human liver microsomes are shown in Figure 2A. Based on the published literature, none of these metabolites seems to retain more than 10% of the immunosuppressive activ-ity of everolimus.29 In contrast with sirolimus, for which
39-O-desmethy sirolimus is the major metabolite in blood, 46-OH everolimus is the major metabolite of everolimus in blood. Demethylation at the C(39) position is inhibited by the C(40) modification that differentiates everolimus and sirolimus30 (Figure 1), thus leading to a marked difference in
the metabolite patterns for everolimus and sirolimus in blood. Interestingly, sirolimus is not a clinically relevant metabolite of everolimus.25 This can be explained by molecular dynamics
and quantum chemical calculations.30
Specific populations
The pharmacokinetics of everolimus did not differ according to age, gender, or weight in adults.24,31 The apparent clearance
Sirolimus
Everolimus
O
N
O
Me
Me
Me
Me
Me
Me
Me
HO
O
O
O
OM
OMe O
H
OMe
H
R
O
OH
1
2 34
5 6 8 9 10 11 12 13 14 15
16 17 18 19
20 21
22 23 24 25
26 27 28 29 30 31 32
33 34 35 36 3738
39 40 41 42 43
44
45
46 47 48
49 50
51
52
R = OH
R = O
OH
Na+
e
Figure 1 Comparisonof the structures of everolimus and sirolimus. Atom numbering follows the international Union of Pure and Applied Chemistry nomenclature
Transplant Research and Risk Management downloaded from https://www.dovepress.com/ by 118.70.13.36 on 27-Aug-2020
Dovepress
Cooper et al
Figure 2 Drugmetabolism of everolimus. A) Computer simulation of everolimus in the human cytochrome P450 3A4 enzyme. The green structure is everolimus, the yellow the heme portion of the cytochrome P450 3A enzyme that is responsible for oxidation.30B) Shows the resulting metabolites identified after in vitro metabolism of
everolimus by human liver microsomes.25,55 Hydroxylation positions are marked by arrows and O-demethylation and O-hydroxyethylation positions are circled. Please note
that there were three metabolites identified with hydroxylations at the piperidine ring. These could be separated by high-performance liquid chromatography indicating monohydroxylation at different positions at the piperidine ring but the exact structures could not be identified. C) Representative high-pressure liquid chromatography-mass spectrometry ion chromatogram showing a typical everolimus metabolite pattern in the blood of a kidney transplant patient.118
A
0 2000 4000 6000 8000 10000 12000 14000 16000
0 1000 2000 3000 4000 5000 6000 7000 8000
2.5 5.0 7.5 10.0 12.5 15.0 17.5 20.0 22.5 0
5000 10000 15000 20000 25000
Intensit
y,
cp
s
Time, min
46-OH
16-O-desmethyl
Everolimus A. EIC, m/z= 996.6
B. EIC, m/z= 966.6
C. EIC, m/z= 980.6
24-OH 25-OH
O CH3
H OH
N
O O
O
CH3 CH3
O OH
OCH3 CH3 H3C
OCH3
O
O H H3C
OCH3
CH3 37
40 39 16
10
22
28
32
34 35
1 12
O OH
46
49 B
C
Transplant Research and Risk Management downloaded from https://www.dovepress.com/ by 118.70.13.36 on 27-Aug-2020
Dovepress everolimus in kidney transplantation for a representative patient, 44 years old and weighing 71 kg,
was 8.82 L/hour.22 A 1 kg increase in bodyweight resulted
in a 0.44% increase in apparent clearance.31
In de novo renal transplant recipients receiving cyclosporine A, corticosteroids, and everolimus, Asian ethnicity did not significantly affect apparent everolimus clearance. In contrast, apparent clearances were on aver-age 20% higher in African-American patients than in non-black patients,31 likely due to more frequent expression of
CYP3A5 in the intestine and liver of African-Americans, as well as the highly polymorphic nature and variable distribu-tion of P glycoprotein among ethnic groups.32 There are no
well-controlled studies establishing the safety of everoli-mus during pregnancy. While the safe and effective use of everolimus in pediatric populations has not been adequately studied, current data indicate that body weight-adjusted dosages are necessary in children.22 Sirolimus undergoes
different metabolism in children younger than 2 years of age compared with older children and adults, and thus it is reasonable to expect similar findings with everolimus.26 The
pharmacokinetics of everolimus do not seem to be affected by kidney function,33 which is not surprising given that more
than 98% of everolimus is eliminated in the form of metabo-lites via bile.22 Although it has been stated that everolimus is
not altered in patients with mild to moderate hepatic impair-ment (Child–Pugh Classes A and B),33 there is evidence that
its clearance is significantly reduced (by 53%) in individuals with moderate hepatic impairment compared with healthy individuals (9.1 ± 3.1 L/hour vs 19.4 ± 5.8 L/hour).34 Based
on these data, the authors recommended a reduction of everolimus dose by 50% in patients with Child–Pugh Class B liver function impairment.22,34 The effect of severe hepatic
impairment (Child–Pugh Class C) on everolimus pharma-cokinetics remains to be established.33,34
Pharmacokinetic variability:
Pharmacogenomics, drug–drug,
food–drug, and disease–drug interactions
Everolimus meets the criteria of a narrow therapeutic index drug as defined by regulatory agencies and, as such, requires therapeutic drug monitoring and dosing guided by blood concentrations.22,33 By definition, approved drugs
with narrow therapeutic indices typically exhibit small intrasubject variability.35 However, everolimus shows
sig-nificant interindividual differences that most likely involve genetic polymorphisms of drug-metabolizing enzymes and active transporters, such as CYP3A5 and P glycoprotein,32,36
which are critical for the first-pass effect, pharmacokinetics,
and elimination of everolimus. Because more than 50% of all clinically relevant drugs (including immunosuppres-sants such as cyclosporine A, tacrolimus, and prednisone) are substrates of these proteins, there is the potential for a multitude of competitive and noncompetitive drug– drug interactions. A 6-month pharmacokinetic study in patients receiving everolimus and cyclosporine A reported trough everolimus concentrations of 4.3 ± 2.4 ng/mL and 7.2 ± 4.2 ng/mL for 0.75 mg and 1.5 mg twice-daily doses, respectively.37 As such, the starting dose of everolimus for
most patients is 0.75 mg twice daily in combination with a calcineurin inhibitor to achieve a therapeutic concentration of 3–8 ng/mL.33,38,39 Whereas both everolimus and sirolimus
blood concentrations are increased by cyclosporine A,37,40–42
they are only minimally affected by tacrolimus.43–45
Nevertheless, a starting everolimus dose of 0.75 mg twice daily in combination with tacrolimus resulted in mean trough everolimus concentrations consistently greater than 3 ng/mL over 6 months in the US09 study described below.46
Coadministration of inhibitors of CYP3A and P glycoprotein may increase systemic everolimus exposure and thus the risk of everolimus toxicity, while inducers may lead to lower blood everolimus concentrations and a reduction in immu-nosuppressive activity. Everolimus drug–drug interactions have been reviewed in detail elsewhere.22
In a single-dose study in healthy individuals, a high-fat meal delayed the time to maximum concentration of everolimus by a median 1.25 hours, reduced peak blood concentration by 60%, and reduced the AUC by 16%.47 To
minimize longitudinal variability in exposure, everolimus should be administered consistently either with or without food. Another concern is foods, food supplements, and herbs that contain compounds which are inhibitors or inducers of CYP3A enzymes and P glycoprotein. Representative examples are grapefruit juice33 that markedly increases oral
bioavailability through reducing the activity of intestinal drug-metabolizing enzymes48 and hyperforin, the active
compound of St John’s wort, that induces CYP3A and P glycoprotein via the steroid X receptor, resulting in reduced drug exposure and efficacy.49
Knowledge of disease–drug interactions is still surpris-ingly incomplete. The activity of CYP3A is reduced by high intracellular free radical concentrations, infectious diseases, inflammation, and immune reactions,50,51 and
the activity of ATP-binding cassette transporters, such as P glycoprotein, is affected in similar ways.52 The overall
effect of inflammation is increased exposure to drugs and/or their metabolites due to a reduced first-pass effect
Transplant Research and Risk Management downloaded from https://www.dovepress.com/ by 118.70.13.36 on 27-Aug-2020
Dovepress
Cooper et al
and inhibited hepatic elimination. This leads to reduced dosage requirements.53 Although disease–drug interactions
of everolimus have not specifically been studied as yet, it is reasonable to expect that these also contribute to the intrain-dividual pharmacokinetic variability of everolimus.
Therapeutic drug monitoring
Routine whole blood therapeutic everolimus concentration monitoring to guide dosing of individual patients is recom-mended and, as discussed below, the recomrecom-mended thera-peutic range for trough blood concentrations is 3–8 ng/mL in combination with calcineurin inhibitors and steroids.22,33
Steady-state trough everolimus concentrations are correlated with the AUC (r2= 0.88), indicating that measuring trough
blood concentrations is a valid approach to therapeutic drug monitoring.24 There are three major analytical strategies
for clinical therapeutic drug monitoring of everolimus, ie, immunoassay, high-performance liquid chromatography (HPLC)/ultraviolet light (UV) and HPLC-mass spectrometry. An immunoassay is presently available outside of the US, but as is not uncommon for immunoassays for therapeutic drug monitoring of immunosuppressants, it overestimates everoli-mus concentrations, partially due to cross-reactivity of the antibody with the less active everolimus metabolites.54,55 An
improved version of this immunoassay is under development. HPLC/UV assays for the quantification of everolimus are described, but are prone to interference and their sensitivity is limited. In general, HPLC-mass spectrometry is considered the gold standard, because it is specific for everolimus and, compared with immunoassays and HPLC/UV, has superior sensitivity with lower limits of quantitation, usually in the pg/mL range. For a more detailed review, please refer to Korecka and Shaw.56 Currently, due to the limitations of
the available everolimus immunoassay, more than 50% of all laboratories are using HPLC-based assays for clinical therapeutic drug monitoring of everolimus.57
Efficacy studies
The ability of everolimus to prevent acute rejection was first demonstrated in preclinical models of kidney, heart, and lung transplantation.58–60 In addition to preventing acute
rejection, everolimus has been shown to prevent manifes-tations of chronic renal allograft injury in rats, including glomerulosclerosis and proteinuria, likely via suppression of growth factors.61 Vascular remodeling, another frequent
manifestation of chronic allograft damage, is diminished by everolimus through inhibition of vascular smooth muscle cell proliferation.62 In vitro and animal studies indicate that
everolimus may also have the potential to antagonize several toxicities of low-dose calcineurin inhibitors.63 Because the
role of calcineurin inhibitors in chronic allograft damage has become more evident in the last decade, the apparent ability of everolimus to protect allografts from both acute rejection as well as chronic lesions has made it an attractive target for clinical efficacy studies. The following sections describe efficacy data from clinical trials investigating the combination of various doses of everolimus with full-dose or reduced-dose calcineurin inhibitors in de novo kidney transplant recipients. In all cases, cyclosporine A refers to the modified cyclosporine preparation (Neoral®, Novartis
Pharmaceuticals, Basal, Switzerland), with trough level monitoring performed on whole blood samples.
Studies B201 and B251:
everolimus
+
full-dose cyclosporine A
The B201 study was a multicenter, 36-month equivalence trial comparing two fixed doses of everolimus with myco-phenolate mofetil + full-dose cyclosporine A.64,65 This trial
was double-blinded until 12 months after enrollment, and included 588 patients randomized 1:1:1 to either low-dose everolimus (1.5 mg/day), high-dose everolimus (3 mg/day), or mycophenolate mofetil 2 g/day. All three arms received steroids and cyclosporine A, with goal trough levels of 150–400 ng/mL during post-transplant weeks 1–4, and 100–300 ng/mL thereafter. However, after an analysis of data from the 12-month double-blind phase in January 2001 revealed suboptimal renal function in both everolimus groups, an amendment was made to the protocol allowing for a reduction in cyclosporine A trough levels to 50–75 ng/mL in patients with trough everolimus concentrations above 3 ng/mL.
The primary endpoint of efficacy failure at 6 months included biopsy-proven acute rejection, graft loss, death, or loss to follow-up, and was reached by similar proportions of patients in each group, ie, 26.8% for everolimus 1.5 mg/day, 26.3% for everolimus 3 mg/day, and 29.6% for mycophe-nolate mofetil (difference not statistically significant). At 12 months, creatinine clearance by Cockcroft–Gault was significantly lower in both everolimus arms (52.9 cc/min and 49.3 cc/min for everolimus 1.5 mg/day and 3 mg/day, respec-tively) compared with mycophenolate mofetil (56.9 cc/min, ,0.05) despite similar biopsy-proven acute rejection between groups, resulting in the protocol amendment described above. As a result of the new protocol, creatinine clearance at 36 months was similar between the everolimus 1.5 mg/ day arm and mycophenolate mofetil and significantly lower
Transplant Research and Risk Management downloaded from https://www.dovepress.com/ by 118.70.13.36 on 27-Aug-2020
Dovepress everolimus in kidney transplantation in only the 3 mg/day arm.65 Additional 3-year data show
similar efficacy failure and biopsy-proven acute rejection rates between the everolimus 1.5 mg/day, everolimus 3 mg/ day, and mycophenolate mofetil groups (33% vs 38.9% vs 37.2%, respectively, for efficacy failure, and 24.2% vs 24.7% vs 26.5%, respectively, for biopsy-proven acute rejection, differences not statistically significant).65
The B251 study enrolled 583 patients and adopted a design identical to the B201, with the same protocol amendment described above.66 The primary endpoint of
efficacy failure at 36 months, including biopsy-proven acute rejection, graft loss, death, or loss to follow-up, occurred in equal numbers across groups (33.7% vs 34% vs 31.1% in the everolimus 1.5 mg/day, everolimus 3 mg/day, and mycophenolate mofetil groups, respectively, differences not statistically significant), as did biopsy-proven acute rejection at 36 months (25.4 vs 25.8 vs 26.5, respectively). Interestingly, the incidence of antibody-mediated rejection was nearly double in the mycophenolate mofetil arm (18.4%) compared with the everolimus 1.5 mg/day arm (9.8%). As in the B201 study, creatinine clearance was lower at 12 months in the two everolimus arms compared with mycophenolate mofetil (58 vs 52 vs 67 cc/min for everolimus 1.5 mg/day, everolimus 3 mg/day, and mycophenolate mofetil, respec-tively, Cockcroft–Gault, P , 0.01 for either everolimus arm vs mycophenolate mofetil), and this trend held true at 36 months as well, despite the protocol amendment.
everolimus
+
reduced dose cyclosporine A
While the studies B201 and B251 showed that fixed-dose everolimus in combination with full-dose cyclosporine A was effective and not inferior to a mycophenolate mofetil-based regimen in preventing biopsy-proven acute rejection and graft loss in kidney transplant recipients, lower creatinine clearance in the everolimus arms raised concerns about a potentiating effect on calcineurin inhibitor nephrotoxicity. While mTOR-I mediated potentiation of calcineurin inhibitor nephrotoxicity is well described,67 the differing mechanisms
of action of these therapies have led to the hypothesis that they are also synergistic,15 possibly requiring a reduction in
cyclosporine A exposure in combination with everolimus. The 156 study was a 36-month, multicenter, random-ized, open-label Phase II evaluation of the effectiveness of everolimus 3 mg/day in combination with prednisone and either full-dose (trough goal 150–300 ng/mL at months 1–2, 125–250 ng/mL at months 3–36) or reduced-dose (trough goal 75–125 ng/mL at months 1–2, 50–100 ng/mL at months 3–36) cyclosporine A with basiliximab induction
in 111 kidney transplant recipients.68 As in the B201 and
B251 studies, a protocol amendment allowing a reduction of trough cyclosporine A levels to 50–75 ng/mL was applied to all patients at 12 months, in addition to everolimus dose adjustments to maintain trough concentrations .3 ng/mL. Efficacy failure (biopsy-proven acute rejection, graft loss, death, loss to follow-up) at 36 months occurred in 35.8% of those on full-dose cyclosporine A vs 17.2% of those on reduced dose cyclosporine A (P = 0.03). Creatinine clearance at 36 months (by Nankivell formula) was similar between groups (51.7 cc/min for full-dose cyclosporine A vs 56.6 cc/ min for reduced-dose cyclosporine A), and improved from 49.7 cc/min preamendment to 54.5 cc/min at 6 months posta-mendment in the full-dose cyclosporine A group.
A retrospective analyses of the B201 and B251 studies revealed a significantly increased risk of biopsy-proven acute rejection in patients with trough everolimus levels ,3 ng/mL,38,39 making the case for therapeutic
moni-toring of everolimus levels as a more optimal dosing strategy. With these data in mind, the A2306 and A2307 trials were undertaken to evaluate the effectiveness of concentration-controlled everolimus in combination with reduced dose cyclosporine A.69,70 These multicenter, randomized,
open-label studies of similar design evaluated the efficacy of two doses of everolimus (1.5 mg/day or 3 mg/day) plus low-dose cyclosporine A and prednisone. Patients in the A2306 study (n = 237) received initial cyclosporine A doses of 8 mg/ kg/day and no induction therapy, while those in the A2307 study (n = 256) received induction therapy with basiliximab and lower initial doses of cyclosporine A at 4 mg/kg/day. Cyclosporine A exposure was monitored by 2-hour levels (C2) in both studies, with month 1 and 2 C2 goals in A2307 being approximately half those in the A2306 study. Non-black patients in both studies received everolimus at either 1.5 mg/day or 3 mg/day, which was dose-adjusted to maintain trough concentrations .3 ng/mL, while all black patients received 3 mg/day (based on higher everolimus clearance rates in black patients).31 Mean 6-month trough cyclosporine
A levels ranged from 81.7 ng/mL to 83.1 ng/mL in A2306 and 63.7 ng/mL to 67.7 ng/mL in A2307. The primary endpoint of 6-month median glomerular filtration rate by Nankivell formula was similar across groups (65 vs 62 cc/min for everolimus 1.5 mg/day and 3 mg/day, respectively, in A2306, and 66 cc/min vs 67 cc/min for everolimus 1.5 mg/day and 3 mg/day, respectively, in A2307). The secondary endpoint of 6-month biopsy-proven acute rejection was reached by more patients on everolimus 1.5 mg/day in A2306 (25% vs 15.2% for everolimus 3 mg/day), but was not statistically significant
Transplant Research and Risk Management downloaded from https://www.dovepress.com/ by 118.70.13.36 on 27-Aug-2020
Dovepress
Cooper et al
(P = 0.073), whereas biopsy-proven acute rejection was less frequent and equivalent between groups in the A2307 study with basiliximab induction (13.7% vs 15.1% for everolimus 1.5 mg/day and 3 mg/day, respectively, P = 0.859). Patients with trough everolimus concentrations ,3 ng/mL in either study had significantly more biopsy-proven acute rejec-tion (6/8 vs 38/221 with everolimus .3 ng/mL in A2306, P , 0.001, and 3/6 vs 31/246 with everolimus .3 ng/mL in A2307, P , 0.05), consistent with the aforementioned retro-spective analysis of biopsy-proven acute rejection risk and trough everolimus levels in the B201 and B256 studies.38,39
Twelve-month data from A2306 and A2307 show pre-served glomerular filtration rates in both treatment groups (64 cc/min and 63 cc/min for everolimus 1.5 mg/day and 3 mg/day in A2306, respectively, and 68 cc/min for both groups in A2307) and similar trends in biopsy-proven acute rejection (25.9% and 19.2% for everolimus 1.5 mg/day and 3 mg/day, respectively, in A2306; 13.7% and 15.8% for everolimus 1.5 mg/day and 3 mg/day, respectively, in A2307).70 Comparisons with data from the B201 and B251
trials of fixed-dose everolimus plus full-dose cyclosporine A show similar rates of biopsy-proven acute rejection, with significant improvements in 12-month renal function (in the range of 49–58 cc/min in B201 and B256 vs 63–65 cc/min in A2307 and 2307).
Taken together, data from the B201, B251, 156, A2306, and A2307 studies suggest a dosing strategy consisting of concentration-controlled everolimus with trough levels .3 ng/mL in combination with low-dose cyclosporine A provides adequate immunosuppression while minimizing nephrotoxicity. The recently published A2309 study compared this optimized everolimus-based strategy with a more standard calcineurin inhibitor/ mycophenolate mofetil-based regimen in 833 low-risk recipients of cadav-eric or living donor kidneys.71 This multicenter,
open-label Phase III trial randomized patients to receive either everolimus 1.5 mg/day (trough target 3–8 ng/mL) with reduced dose cyclosporine A, everolimus 3 mg/day (trough target 6–12 ng/mL) with reduced-dose cyclosporine A, or mycophenolate mofetil 720 mg twice daily with full-dose cyclosporine A, in addition to basiliximab induction and maintenance prednisone. Target cyclosporine A trough levels in both everolimus arms were 100–200 ng/mL in months 1–2 and were tapered to 25–50 ng/mL by month 12, compared with 200–300 ng/mL in months 1–2 and 100–250 ng/mL thereafter for patients in the mycophenolate mofetil arm. The primary composite endpoint of 1-year biopsy-proven acute rejection, graft loss, death, or loss to follow-up occurred in
similar numbers in each treatment arm (25.3%, 21.9%, and 24.2% in the everolimus 1.5 mg/day, everolimus 3 mg/day, and mycophenolate mofetil groups, respectively). Biopsy-proven acute rejection itself occurred in similar numbers as well (16.2%, 13.3%, and 17% in the everolimus 1.5 mg/day, everolimus 3 mg/day, and mycophenolate mofetil groups, respectively) and consisted mainly of mild Banff Grade IA episodes in all groups. One-year glomerular filtration rate by Nankivell formula was also equivalent between the groups (65.8 cc/min, 64 cc/min, and 62.6 cc/min for everolimus 1.5 mg/day, everolimus 3 mg/day, and mycophenolate mofetil groups, respectively).
The A2309 study thus confirms that the efficacy of a con-centration-controlled everolimus-based protocol is equivalent to a mycophenolic acid-based regimen, while allowing for an average 60% reduction in calcineurin inhibitor exposure over a 12-month period. However, this study did not include a reduced-dose cyclosporine A + mycophenolate mofetil arm such as that seen in the 1645-patient Efficacy Limiting Toxicity Elimination (ELITE)-Symphony study (low-dose cyclosporine A, trough goal 50–100 ng/mL throughout the study) which was associated with comparable 12-month renal function (creatinine clearance 59.4 cc/min by Cockcroft– Gault).11 Nevertheless, despite a similar 12-month glomerular
filtration rate between the groups in the A2309 study, a 60% reduction in calcineurin inhibitor exposure is an attractive treatment option for kidney transplant recipients that may result in improved longer-term graft function.
A more aggressive calcineurin inhibitor minimization strategy was employed in the recently published ZEUS trial in which 503 kidney transplant recipients receiving de novo cyclosporine A, mycophenolic acid, and prednisone were randomized 1:1 at post-transplant month 4–5 to either remain on cyclosporine A-based therapy (goal trough concentrations 120–180 ng/mL at month 4.5–6.0, and 100–150 ng/mL after month 6) or undergo cyclosporine A conversion to everoli-mus (goal trough concentration 3–8 ng/mL during conversion and 6–10 ng/mL thereafter).72 At the time of conversion,
300 of the original 503 recipients met the criteria to proceed with conversion. The primary endpoint of glomerular filtra-tion rate by Nankivell formula at 12 months post-transplant was significantly higher in the everolimus conversion group compared with patients remaining on a cyclosporine A-based regimen (71.8 cc/min vs 61.9 cc/min, respectively). Biopsy-proven acute rejection was significantly more common in everolimus-converted patients as well (10% vs 3% after randomization for nonconverted patients, P = 0.03), but all rejections were categorized as mild. Nevertheless, late
Transplant Research and Risk Management downloaded from https://www.dovepress.com/ by 118.70.13.36 on 27-Aug-2020
Dovepress everolimus in kidney transplantation rejection episodes have been associated with poor graft
outcomes in several studies,73,74 and further clinical studies
are needed prior to recommending this strategy in clinical practice.
everolimus
+
tacrolimus
While several trials have evaluated the use of sirolimus in combination with tacrolimus with varying results,75–77 a large
retrospective analysis of Scientific Registry of Transplant Recipients data has shown this combination to be inferior to mycophenolate mofetil-based regimens.78 However, it is
likely that these findings reflect increased nephrotoxicity as a result of higher tacrolimus trough levels, while lower tacrolimus exposure characteristic of recent practice may be associated with improved outcomes when combined with sirolimus.79 The US09 study was a 6-month multicenter,
open-label, prospective randomized trial evaluating the use of everolimus with either standard-exposure or low-exposure tacrolimus.46 Low-risk kidney transplant recipients received
basiliximab induction with maintenance steroids, everolimus at 1.5 mg/day adjusted for trough values .3 ng/mL, and randomized to either low tacrolimus (trough 4–7 ng/mL in months 0–3, and 3–6 ng/mL in months 4–6) or stan-dard tacrolimus (trough 8–11 ng/mL in months 0–3, and 7–10 ng/mL in months 4–6). Due to slow recruitment, the original goal of 202 patients was not reached, and enrollment stopped after 92 patients were included. The primary outcome of serum creatinine at 6 months needed to differ by at least 0.04 mg/dL in order to retain 80% power with a significance level of P , 0.05.
The majority (66%) of patients in this study received kidneys from living donors. Tacrolimus levels trended toward the upper end of the trough range for the low tacrolimus group and toward the lower end of the range for the standard tacrolimus group, resulting in less separation between groups than planned. Trough everolimus levels were equivalent in each group (5.2 ng/mL at 6 months). Six-month serum creatinine was lower in the low tacrolimus group (1.26 mg/dL vs 1.44 mg/dL for standard tacrolimus) but did not reach statistical significance (P = 0.114). Glomerular filtration rate by Nankivell formula was well preserved in each group at 75.3 cc/min for the low tacrolimus arm and 72.5 cc/min for the standard tacrolimus arm. Biopsy-proven acute rejection occurred in 14% of each group and most episodes were either Banff Grade IA or IB.
Everolimus in combination with either low-exposure or standard-exposure tacrolimus thus appears to maintain efficacy comparable with everolimus/cyclosporine A-based
regimens at 6 months, but a longer follow-up period may reveal significant differences in renal function between groups. This, in addition to poor recruitment, low number of deceased donors, and limited differentiation between tacrolimus arms, limits the applicability of this study, and results need to be interpreted with caution.
A post hoc analysis of data from the US09 study showed significantly fewer rejection episodes in patients with trough everolimus levels .3 ng/mL,45 similar to results seen in
comparable retrospective analyses of everolimus plus full-dose cyclosporine A studies B201 and B251.64,66 As a result
of these analyses, therapeutic monitoring of trough everoli-mus levels is recommended to maintain concentrations at 3–8 ng/mL.
Safety, tolerability, and side effects
mTOR-Is are associated with numerous potential side effects, which account for significant discontinuation rates in many sirolimus trials. Overall, the most common side effects associated with sirolimus in clinical trials have been lipid abnormalities, edema, lymphocele, delayed graft func-tion, delayed wound healing, proteinuria, and hematologic abnormalities.80 While data regarding common side effects
associated with everolimus are sparse due to the relatively recent introduction of this drug into clinical use, one can speculate a similar profile to sirolimus given their identical mechanisms of action. The following sections summarize the tolerability and adverse events reported from three large comparative trials described above.
Safety and tolerability
Studies comparing everolimus-based and mycophenolate mofetil-based regimens have generally shown similar patient survival but higher rates of drug discontinuation in the everolimus groups. In the B201 study,64,65 rates of death at
3 years were similar between both everolimus dose groups and mycophenolate mofetil, with the primary causes of death being myocardial infarction, sepsis, and pneumonia. The frequency of discontinuation of study medication due to adverse events was significantly higher in the higher-dose (everolimus 3 mg/day) group compared with the mycophe-nolate mofetil group (39% vs 28%, respectively, P = 0.03), while the lower-dose (everolimus 1.5 mg/day) group was not different from the mycophenolate mofetil group (31% vs 28%, P = 0.57). Mortality in the B251 study was simi-lar across groups, but a significantly higher rate of study drug discontinuation for any reason was observed in both everolimus groups compared with mycophenolate mofetil
Transplant Research and Risk Management downloaded from https://www.dovepress.com/ by 118.70.13.36 on 27-Aug-2020
Dovepress
Cooper et al
(57%, 65%, and 45% for everolimus 1.5 mg/day, 3 mg/day, and mycophenolate mofetil groups, respectively),66 with the
most common reason for drug discontinuation being adverse events. In the A2309 study, which included concentration-controlled everolimus dosing, study drug discontinuation due to adverse events was lower than reported in B201, but still higher in both everolimus groups compared with mycophe-nolate mofetil (23% and 28% vs 16% for everolimus 1.5 mg/ day and 3 mg/day vs mycophenolate mofetil, respectively, statistical significance not provided).71 While the total number
of patients discontinuing the study drug or requiring dose adjustment due to adverse events was less in those receiving 1.5 mg/day compared with 3 mg/day everolimus, a post hoc analysis did not reveal a significant relationship between the trough everolimus level and rate of discontinuation.71 Patient
survival was similar in the everolimus and mycophenolate mofetil groups.
Hyperlipidemia
Hyperlipidemia is the most commonly reported side effect associated with mTOR-I use. A review of 17 randomized controlled trials comparing sirolimus-based or everolimus-based drug regimens with regimens without mTOR-Is identi-fied higher cholesterol and triglycerides in patients receiving mTOR-Is in all but one trial,81 with two-fold higher use of
lipid-lowering agents in these patients (60%) compared with controls. This trend was seen in the B201 study, where mean total cholesterol and triglyceride levels were significantly higher for patients in both the everolimus 1.5 mg/day and 3 mg/day groups vs mycophenolate mofetil,65 as well as in
the A2309 study, where high total cholesterol and hypertrig-lyceridemia were reported as adverse events more frequently in the everolimus groups than with mycophenolate mofetil.71
Hyperlipidemia was also reported more frequently for the everolimus groups compared with mycophenolate mofetil in the B251 study (27.5% and 30.4% for everolimus 1.5 mg/day and 3 mg/day, respectively, vs 22.4% for mycophenolate mofetil), although not statistically significant.66 In the
A2307 study of concentration-controlled everolimus plus reduced-dose cyclosporine A, hyperlipidemia was reported as an adverse event in 37.6% and 33.1% of patients receiving 1.5 mg/day and 3 mg/day, respectively.70
Anemia
Anemia has frequently been associated with mTOR-I use. A study of 214 de novo kidney transplant recipients treated with either sirolimus-based or mycophenolate mofetil-based therapy showed significantly more anemia with sirolimus
(57%) than with mycophenolate mofetil (31%, P , 0.001).82
Additionally, conversion from sirolimus to mycophenolate mofetil appeared to result in increased hemoglobin levels in stable kidney transplant recipients.83 The mechanism
respon-sible for mTOR-I-induced anemia is unclear; hypotheses include a direct effect on iron homeostasis84 and induction of
a chronic inflammatory state.85 In the latter study, 48 patients
on calcineurin inhibitor-based therapy were converted to an everolimus-based regimen, with anemia increasing from 18.6% preconversion to 35% at 3 months after conver-sion. This everolimus-associated anemia was characterized by microcytosis, low serum iron, high serum ferritin, and elevated C-reactive protein. Interestingly, at 6 months after conversion, the percentage of anemic patients had returned to 18.6 despite no differences in the use of darbopoeitin, suggesting an initial period of inflammation and anemia that normalized with time.85 Despite this observation, at
36 months, significantly more anemia-related adverse events were reported for everolimus 1.5 mg/day and 3 mg/day compared with mycophenolate mofetil (32.1% and 39.2% vs 21.4%, respectively) in the B251 study.66
Proteinuria
Sirolimus use has been frequently associated with proteinuria.86
This finding appears to occur mainly in patients converted from calcineurin inhibitors to sirolimus,87,88 but has also been
reported with de novo sirolimus use as well.89,90 While the
mechanism of proteinuria in the former scenario is likely to involve hemodynamic glomerular changes after calcineurin inhibitor removal, the mechanism associated with de novo sirolimus use is unclear. Proposed mechanisms include a loss of tubular reabsorption of protein89 and an inhibitory action of
sirolimus on vascular endothelial growth factor.86 Recently, de
novo mTOR-I use was shown to be associated with a loss of nephrin in glomeruli,91 offering yet another possible
mecha-nism for this phenomenon. In the B251 study, where all groups received a calcineurin inhibitor, proteinuria .300 mg/day was more frequent in both everolimus arms compared with mycophenolate mofetil (39.5% and 39.2% on everolimus 1.5 mg/day and 3 mg/day vs 14.9% in mycophenolate mofetil, P , 0.0001), as was more severe proteinuria .1 g/day (11.6% and 11.4% in everolimus 1.5 mg/day and 3 mg/day vs 2.3% in mycophenolate mofetil, P = 0.028), suggesting a direct relationship between everolimus and proteinuria.66
Peritransplant complications
Reporting of delayed graft function in clinical trials is subject to considerable variability due to differences in
Transplant Research and Risk Management downloaded from https://www.dovepress.com/ by 118.70.13.36 on 27-Aug-2020
Dovepress everolimus in kidney transplantation kidney donor characteristics, ischemia time, delayed graft
function definition, and other aspects of the study design. Nevertheless, delayed graft function has been frequently associated with sirolimus use,92–94 and a retrospective
study of 8319 recipients of kidneys from deceased donors, 361 of whom had received de novo sirolimus, revealed an increased risk of delayed graft function in sirolimus-treated patients, with an odds ratio of 1.42 (95% confidence interval: 1.07–1.9).95 Contrary to these data, however, are data from
the ELITE-Symphony study in which patients in the de novo sirolimus arm experienced significantly less delayed graft function (defined by persistent oliguria, decrease in serum creatinine #0.5 mg/dL within 24 hours post-transplant, or dialysis) compared with both the cyclosporine A and tacrolimus arms.11 In studies of everolimus and a
non-everolimus-treated comparator group, the incidence of delayed graft function was similar between everolimus and mycophenolate mofetil groups.64–66,71 In these studies, the
incidence of delayed graft function in everolimus-treated patients ranged from 7.8% in the B251 study, which included 50% deceased donor kidneys and excluded those with delayed graft function within the first 48 hours, to 32% in the B201 study, which included 90% deceased donor kidneys without specific delayed graft function-related exclusion criteria. The US09 study of everolimus in combination with tacrolimus also reported low delayed graft function rates of 8.2%–9.3%, although the study design included an option for withhold-ing everolimus in the case of delayed graft function.46 Thus,
while the data for sirolimus are mixed, initial experience does not implicate everolimus as a significant risk factor for delayed graft function. In accordance with these data, a study of 139 patients receiving kidneys at high risk for delayed graft function (donor age .55 years, cold ischemia time .24 hours, or retransplantation) randomized to receive everolimus either de novo or as replacement for mycophe-nolate mofetil at 5 months post-transplant, in addition to cyclosporine A and prednisone, showed similar delayed graft function rates in both groups (24.6% immediate everolimus, 24.3% delayed everolimus).96
The association of mTOR-Is with lymphocele develop-ment and impaired wound healing is less controversial and now well documented.97–100 Clinical trials of everolimus
show lymphocele development ranging from 4% in the US09 study46 to 18% in the B251 study.66 In B201,
lym-phocele was significantly more likely to occur in either everolimus group compared with mycophenolate mofetil (9% and 12% vs 4% for everolimus 1.5 mg/day and 3 mg/day vs mycophenolate mofetil, respectively).64,65 Obese patients
are particularly susceptible to wound complications, and in the A2309 study, wound healing events in patients with body mass index .75th percentile were reported in 50% of the everolimus group vs 27% of the mycophenolate mofetil group (P , 0.05).70
Infection
While suppression of the recipient immune system allows for successful organ transplantation with increasingly minimal risk of rejection episodes, infectious complications are an unfortunate and frequent consequence. In the A2306 and 2307 studies of concentration-controlled everolimus plus low-dose cyclosporine A, infections were reported in 62%–64% of patients across groups, with serious infections reported in 14%–17% of all patients.69,70 In the B201,
B251, and A2309 studies comparing various everolimus doses with mycophenolate mofetil-treated patients, overall rates of reported infections were similar across groups, at approximately 60%–70%.65,66,71 Whereas reported bacterial
infections were similar between groups in these studies, a closer look at specific viral infections reveals some important differences. In the B201 study, viral infection was significantly more likely to occur in mycophenolate mofetil-treated patients compared with everolimus-treated patients (29.1% for mycophenolate mofetil vs 13.4% and 12.6% for everolimus 1.5 mg/day and 3 mg/day, P , 0.025). Cytomegalovirus infection in particular was significantly less likely in both everolimus groups (5.7% and 8.1% for everolimus 1.5 mg/day and 3 mg/day vs 19.9% for myco-phenolate mofetil, P = 0.001). The A2309 study also reported higher cytomegalovirus infection rates in mycophenolate mofetil-treated patients compared with everolimus-treated patients (5.9% vs 0.7% and 0% for everolimus 1.5 mg/day and 3 mg/day), as well as higher BK viruria and viremia rates (3.3% and 1.8%, respectively, vs 0.7% and 1.1% for everolimus 1.5 mg/day and 0.4% and 0.7% for everolimus 3 mg/day). Rates of cytomegalovirus infection were similar in mycophenolate mofetil-treated and everolimus-treated patients in the B251 study. Therefore, everolimus-based regimens appear to result in similar overall infection rates compared with mycophenolate mofetil, but may offer an advantage with regard to viral disease.
Malignancy
The risk of malignancy associated with organ transplantation and immunosuppression is considerably higher than that in the general population for almost all types of cancer,101–103
with differences ranging from a two-fold increased risk
Transplant Research and Risk Management downloaded from https://www.dovepress.com/ by 118.70.13.36 on 27-Aug-2020
Dovepress
Cooper et al
of solid tumors of the colon, lung, prostate, and breast, to a 20-fold increased risk of nonmelanoma skin cancer and non-Hodgkin’s lymphoma.104 Given the antiproliferative
effect that results from blockade of the mTOR signaling path-way, one might expect a more favorable malignancy profile associated with chronic mTOR-I use compared with other immunosuppressive agents. Indeed, the proliferation pathway downregulated by mTOR inhibition contains several enzymes that are important in tumor growth and development.105
Clinically, 5-year follow-up of the Rapamune® Maintenance
Regimen study showed reduced incidence of both skin and nonskin malignancy in sirolimus-treated patients who underwent cyclosporine A withdrawal at 3 months post-transplant compared with patients on both sirolimus and cyclosporine A,106 and the CONVERT study showed
sig-nificantly lower rates of malignancy at 2 years in patients converted from a calcineurin inhibitor to sirolimus compared with those who remained on a calcineurin inhibitor alone.10
The antiproliferative properties of everolimus have led to its therapeutic use in several malignancies, including advanced renal cell carcinoma and subependymal giant cell astrocytoma.107,108 However, conclusions regarding
malignancy resulting from chronic everolimus therapy in kidney transplant recipients are limited due to its recent introduction into clinical practice and a lack of sufficient long-term follow-up data. Three-year results of the B251 and B201 studies show low rates of malignancy that are equiva-lent across everolimus and mycophenolate mofetil groups, in the range of 4.5%–6.1%.65,66 Of interest, eight cases of
post-transplant lymphoproliferative disorder were reported in both B201 and B251, all of which occurred in patients receiving everolimus (six cases in the everolimus 1.5 mg/day group, and two in the everolimus 3 mg/day group). Because the phospho-inositide 3-kinase/Akt/mTOR signaling pathway plays an important role in post-transplant lymphoproliferative disorder-associated Epstein–Barr-positive lymphoma,109
an association between everolimus and post-transplant lymphoproliferative disorder would be unexpected, but nevertheless deserves close attention, given these data.
Other mTOR-I related adverse
events
Pneumonitis and hemolytic uremic syndrome are rare but potentially serious syndromes that have been associated with sirolimus use,110–114 the latter reported in patients treated
with sirolimus/cyclosporine A combinations. In the case of pneumonitis, withdrawal of sirolimus commonly results
in full recovery. Everolimus-associated pneumonitis has been reported in three heart transplant recipients,115 but has
not been described in clinical trials of everolimus use in kidney transplantation. Hemolytic uremic syndrome, on the other hand, was reported in a total of nine patients receiving everolimus with full-dose cyclosporine A in the B201 and B251 studies, compared with one patient receiving myco-phenolate mofetil.65,66 Hemolytic Uremic syndrome was not
reported in the A2306, A2307, and A2309 studies of everoli-mus plus reduced-dose cyclosporine A or in the US09 study of everolimus plus tacrolimus, suggesting that minimizing combined sirolimus and cyclosporine A exposure reduces the risk of this disease.46,70,71
Several other less serious, albeit troubling from the patient’s prospective, cutaneous side effects have been attributed spe-cifically to chronic mTOR-I use, including edema, acne, and apthous mouth ulceration.116,117 Edema was one of three
adverse events (along with diarrhea and lymphocele) reported as significantly more common for everolimus-treated patients compared with mycophenolate mofetil-treated patients in the B201 study (22.2% and 18.7% for everolimus 1.5 mg/day and 3 mg/day vs 13.3% for mycophenolate mofetil),65 and
one of two adverse events (along with anemia) more com-mon in everolimus vs mycophenolate mofetil-treated patients in B251 (52.3% and 47.4% for everolimus 1.5 mg/day and 3 mg/day vs 41.8% for mycophenolate mofetil).66 Acne
was reported in approximately 20% of each group in the B251 study, and mouth ulcers were reported in 0.5%–5% of everolimus-treated patients in B251 and A2309 vs 1.5%–1.8% of mycophenolate mofetil-treated patients.66,71
everolimus and FDA-mandated education
and monitoring for patients and providers
Based upon the side effect profile above and the adverse event reporting data from the 2309 trial and earlier studies, everolimus gained approval in the US for kidney transplanta-tion, with the expectation that health care professionals and patients be informed and monitored for certain side effects, referred to as a Risk Evaluation and Mitigation Strategy (REMS). This communication plan includes a health care professional and professional association letter to transplant surgeons, transplant medical physicians, physician extenders, and pharmacists, describing the increased risks of wound-related events, hyperlipidemia, proteinuria, graft thrombosis, and nephrotoxicity when coadministered with standard-dose cyclosporine A, as well as a medication guide for patients enclosed in all everolimus packaging that describes
Transplant Research and Risk Management downloaded from https://www.dovepress.com/ by 118.70.13.36 on 27-Aug-2020
Dovepress everolimus in kidney transplantation these risks. Periodic surveys of patients and providers will be
performed by Novartis, the manufacturer of everolimus, to ensure that the REMS is adequately conveying the need for increased attention to these potential complications.
Conclusion
Clinical trials have demonstrated that the mTOR-I, everolimus, in combination with reduced-dose cyclosporine A or tacrolimus, is effective in preventing rejection episodes and graft loss while preserving adequate renal function, resulting in its recent Food and Drug Administra-tion approval for use in combinaAdministra-tion with reduced-dose cyclosporine A, corticosteroids, and basiliximab in kidney transplant recipients at low to moderate immunologic risk. Compared with mycophenolate mofetil-based regimens, everolimus allows for a significant reduction in cyclosporine A exposure, which may translate into improved longer-term graft outcomes. Rates of viral infections and malignancy may be favorably impacted by the use of everolimus and is deserving of further study. These potential advantages must be weighed against the side effect profile of everolimus when selecting an optimal immunosuppressive regimen for kidney transplant recipients.
Disclosure
ACW has served as a consultant to Novartis, and UC has received grant support from Novartis. JEC has no conflicts of interest to report in this work.
References
1. Laupacis A, Keown P, Pus N, et al. A study of the quality of life and cost-utility of renal transplantation. Kidney Int. 1996;50(1):235–242. 2. Wolfe RA, Ashby VB, Milford EL, et al. Comparison of mortality in
all patients on dialysis, patients on dialysis awaiting transplantation, and recipients of a first cadaveric transplant. N Engl J Med. 1999;341(23): 1725–1730.
3. Chan L, Gaston R, Hariharan S. Evolution of immunosuppression and continued importance of acute rejection in renal transplantation. Am
J Kidney Dis. 2001;38(6 Suppl 6):S2–S9.
4. 2009 Annual Report of the US Organ Procurement and Transplantation Network and the Scientific Registry of Transplant Recipients: Transplant Data 1999–2008. Rockville, MD: US Department of Health and Human Services, Health Resources and Services Administration, Healthcare Systems Bureau, Division of Transplantation; 2009.
5. Pascual M, Theruvath T, Kawai T, Tolkoff-Rubin N, Cosimi AB. Strategies to improve long-term outcomes after renal transplantation.
N Engl J Med. 2002;346(8):580–590.
6. Lamb KE, Lodhi S, Meier-Kriesche HU. Long-term renal allograft survival in the United States: A critical reappraisal. Am J Transplant. 2011;11(3):450–462.
7. Meier-Kriesche HU, Schold JD, Srinivas TR, Kaplan B. Lack of improve-ment in renal allograft survival despite a marked decrease in acute rejection rates over the most recent era. Am J Transplant. 2004;4(3): 378–383.
8. Oberbauer R, Segoloni G, Campistol JM, et al. Early cyclosporine withdrawal from a sirolimus-based regimen results in better renal allograft survival and renal function at 48 months after transplantation.
Transpl Int. 2005;18(1):22–28.
9. Lebranchu Y, Thierry A, Toupance O, et al. Efficacy on renal func-tion of early conversion from cyclosporine to sirolimus 3 months after renal transplantation: Concept study. Am J Transplant. 2009;9(5): 1115–1123.
10. Schena FP, Pascoe MD, Alberu J, et al. Conversion from calcineurin inhibitors to sirolimus maintenance therapy in renal allograft recipi-ents: 24-month efficacy and safety results from the CONVERT trial.
Transplantation. 2009;87(2):233–242.
11. Ekberg H, Tedesco-Silva H, Demirbas A, et al. Reduced exposure to calcineurin inhibitors in renal transplantation. N Engl J Med. 2007;357(25):2562–2575.
12. Schuler W, Sedrani R, Cottens S, et al. SDZ RAD, a new rapamy-cin derivative: Pharmacological properties in vitro and in vivo. Transplantation. 1997;64(1):36–42.
13. Crowe A, Bruelisauer A, Duerr L, Guntz P, Lemaire M. Absorption and intestinal metabolism of SDZ-RAD and rapamycin in rats. Drug
Metab Dispos. 1999;27(5):627–632.
14. Kahan BD, Kaplan B, Lorber MI, Winkler M, Cambon N, Boger RS. RAD in de novo renal transplantation: Comparison of three doses on the incidence and severity of acute rejection. Transplantation. 2001; 71(10):1400–1406.
15. Schuurman HJ, Cottens S, Fuchs S, et al. SDZ RAD, a new rapamycin derivative: Synergism with cyclosporine. Transplantation. 1997;64(1): 32–35.
16. Zoncu R, Efeyan A, Sabatini DM. mTOR: From growth signal integra-tion to cancer, diabetes and ageing. Nat Rev Mol Cell Biol. 2011;12(1): 21–35.
17. Terada N, Lucas JJ, Szepesi A, Franklin RA, Takase K, Gelfand EW. Rapamycin inhibits the phosphorylation of p70 S6 kinase in IL-2 and mitogen-activated human T cells. Biochem Biophys Res Commun. 1992;186(3):1315–1321.
18. Kuo CJ, Chung J, Fiorentino DF, Flanagan WM, Blenis J, Crabtree GR. Rapamycin selectively inhibits interleukin-2 activation of p70 S6 kinase.
Nature. 1992;358(6381):70–73.
19. Sedrani R, Cottens S, Kallen J, Schuler W. Chemical modification of rapamycin: The discovery of SDZ RAD. Transplant Proc. 1998; 30(5):2192–2194.
20. Dumont FJ. Everolimus. Novartis. Curr Opin Investig Drugs. 2001; 2(9):1220–1234.
21. Crowe A, Lemaire M. In vitro and in situ absorption of SDZ-RAD using a human intestinal cell line (Caco-2) and a single pass perfusion model in rats: Comparison with rapamycin. Pharm Res. 1998;15(11): 1666–1672.
22. Kirchner GI, Meier-Wiedenbach I, Manns MP. Clinical pharmacokinet-ics of everolimus. Clin Pharmacokinet. 2004;43(2):83–95.
23. Kovarik JM, Hartmann S, Figueiredo J, Rouilly M, Port A, Rordorf C. Effect of rifampin on apparent clearance of everolimus.
Ann Pharmacother. 2002;36(6):981–985.
24. Kovarik JM, Kahan BD, Kaplan B, et al. Longitudinal assessment of everolimus in de novo renal transplant recipients over the first post-transplant year: Pharmacokinetics, exposure-response relationships, and influence on cyclosporine. Clin Pharmacol Ther. 2001;69(1): 48–56.
25. Jacobsen W, Serkova N, Hausen B, Morris RE, Benet LZ, Christians U. Comparison of the in vitro metabolism of the macrolide immunosuppres-sants sirolimus and RAD. Transplant Proc. 2001;33(1–2):514–515. 26. Filler G, Bendrick-Peart J, Christians U. Pharmacokinetics of
mycophenolate mofetil and sirolimus in children. Ther Drug Monit. 2008;30(2):138–142.
27. Filler G, Bendrick-Peart J, Strom T, Zhang YL, Johnson G, Christians U. Characterization of sirolimus metabolites in pediatric solid organ trans-plant recipients. Pediatr Transtrans-plant. 2009;13(1):44–53.
Transplant Research and Risk Management downloaded from https://www.dovepress.com/ by 118.70.13.36 on 27-Aug-2020