Development Of Psychometrically
Validated Standardized Test Instruments
For Outcomes Assessment In Experiential
Engineering Education
Mukasa E. Ssemakula, Wayne State University, USAGene Y. Liao, Wayne State University, USA Shlomo Sawilowsky, Wayne State University, USA
ABSTRACT
There is a major trend in engineering education to provide students with realistic hands-on learning experiences. This paper reports on the results of work done to develop standardized test instruments to use for student learning outcomes assessment in an experiential hands-on manufacturing engineering and technology environment. The specific outcomes targeted for assessment are those defined under the MILL (Manufacturing Integrated Learning Laboratory) Manufacturing Competency Model. In a unique feature aimed at experiential learning, the test instruments incorporate the use of a physical manipulative to evaluate attainment of particular hands-on skills. The resulting standardized tests have been subjected to extensive psychometric analysis. The results of the analysis indicate excellent structure of the test instruments. The test instruments have shown high levels of stability, internal consistency, and reliability. These tests can be used as instruments for outcomes assessment to help document attainment of targeted learning outcomes for program assessment, accreditation, and other assessment purposes.
Keywords: Outcomes Assessment; Standardized Test; Psychometrically Validated; Experiential Learning
INTRODUCTION
here has been a focus in recent developments in engineering education on improving student learning by providing more hands-on learning experiences. With respect to manufacturing, the Society of Manufacturing Engineers Education and Research Community’s Curricula 2015 report examined the state of manufacturing education and industry, emerging issues, and opportunities for improvement (Mott & Hugh 2011). It states that as manufacturing becomes more established as a discipline, it is necessary to work towards a strong yet flexible core curriculum and that there is a need for a consistent model that can be used to design and assess programs.
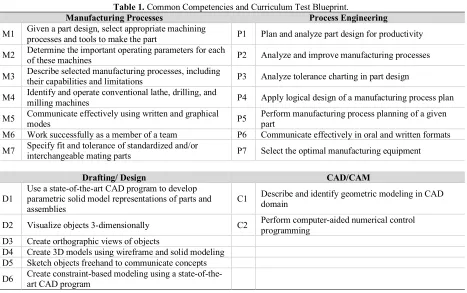
In our previous work, we described how a core common curriculum was developed by five departments at four different institutions to provide experiential hands-on manufacturing education. The following major curriculum areas emerged: (1) drafting/design, (2) manufacturing process, (3) process engineering, and (4) CAD/CAM. The associated competencies that students are expected to master are shown in Table 1. This table summarizes what came to be known as the MILL Manufacturing Competency Model (MILL Model for short). Further discussion of the MILL Model is found in Ssemakula, Liao, Ellis, Kim, and Sawilowsky (2009); Ssemakula et al. (2011a, 2011b).
Table 1. Common Competencies and Curriculum Test Blueprint.
Manufacturing Processes Process Engineering
M1 Given a part design, select appropriate machining processes and tools to make the part P1 Plan and analyze part design for productivity
M2 Determine the important operating parameters for each of these machines P2 Analyze and improve manufacturing processes
M3 Describe selected manufacturing processes, including their capabilities and limitations P3 Analyze tolerance charting in part design
M4 Identify and operate conventional lathe, drilling, and milling machines P4 Apply logical design of a manufacturing process plan
M5 Communicate effectively using written and graphical modes P5 Perform manufacturing process planning of a given part M6 Work successfully as a member of a team P6 Communicate effectively in oral and written formats M7 Specify fit and tolerance of standardized and/or interchangeable mating parts P7 Select the optimal manufacturing equipment
Drafting/ Design CAD/CAM
D1 Use a state-of-the-art CAD program to develop parametric solid model representations of parts and assemblies
C1 Describe and identify geometric modeling in CAD domain
D2 Visualize objects 3-dimensionally C2 Perform computer-aided numerical control programming D3 Create orthographic views of objects
D4 Create 3D models using wireframe and solid modeling D5 Sketch objects freehand to communicate concepts
D6 Create constraint-based modeling using a state-of-the-art CAD program
The competencies shown in Table 1 form the knowledge base or blueprint from which the standardized test instruments that are the subject of this paper were developed. A collaboration among diverse partners to develop a standardized test is likely to introduce novel issues in arriving at an agreement on matters that impact the psychometric priorities of the instrument. For example, consider evidence for content validity, “the degree that a test measures what it purports to measure” (Sawilowsky, 2000a, p. 155; see also Sawilowsky, 2000b). It may be obtained via a Venn diagram of the test’s blueprint of objectives with the following: outline of the curricular modules, subject matter experts’ analyses, school district curricula and objectives guides, standards set by blue-ribbon panels, and related resources. However, when there are multiple and diverse partners, there may be little opportunity for agreement on the choice of topics and certainly subtopics required to support claims of content validity.
The purpose of this paper, therefore, is to explicate the approach that was used to develop a standardized test of the core manufacturing competencies detailed in the MILL Model. This collaborative effort included partners from five different departments at three universities and one community college around the United States, and an advisory board of industry representatives. The goal was to develop a content-valid standardized test instrument to help validate the attainment of core student learning outcomes in the manufacturing arena. Among other things, the results from the test can be used to demonstrate that an educational program is addressing the competency gaps that were identified by industry (SME 2003); and meeting student outcomes established by accreditation agencies such as the Accreditation Board for Engineering and Technology (ABET 2016a, ABET 2016b).
DEVELOPMENT OF TEST INSTRUMENTS
from Table 1 formed the test’s subscales. The multiple competencies contained within each subscale naturally formed the test blueprint.
This particular test is unique in that it incorporates a hands-on manipulative which can be used to provide a direct assessment of student attainment of specific hands-on skills. This helps to maximize the applicability of the test to the all-important hands-on learning experiences that are so highly sought by industry as well as demanded by modern engineering education pedagogy. The manipulative was designed to encompass the same hands-on skills as those stipulated under the MILL Model. It provides a realistic manipulative to be referenced during the test itself, so as to tie in with the corresponding hands-on experiences. To make hands-on experiences explicitly relevant to the test, test questions frequently refer the examinee to inspect the artifact because the question is based directly on the artifact. Multiple copies of the artifact were fabricated and distributed to each partner institution to be made available to students during the testing.
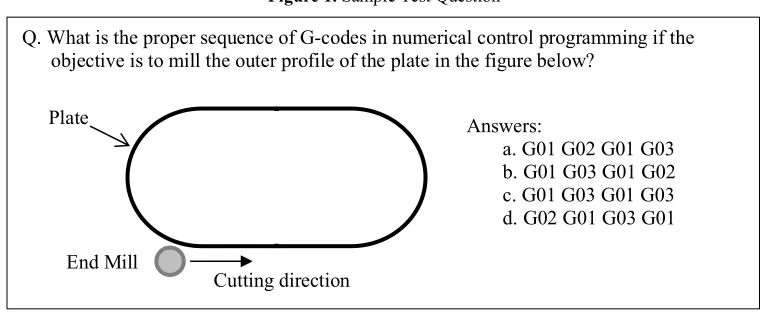
Two versions of a standardized test were developed (Forms A and B). The test length was initially set to be twice the number of items per target competency. A conference was organized where representatives from each partner school were trained in the use of the blueprint approach to test construction as described in Bridge, Musial, Roe, Frank, and Sawilowsky (2003). There were 33 test items written for Form A scale and 32 test items written for Form B scale. The items were sent to the advisory board to obtain validity evidence based on their expertise. The test content was also validated by academic and industry experts. The item pool was then administered to target students at all partner institutions. A sample test question (with possible answers) is shown in Figure 1. To maintain the academic integrity of the tests, we are including only one sample question to illustrate the nature of the test instruments.
Figure 1. Sample Test Question
After the tests were administered at the various consortia schools, extensive and rigorous psychometric analysis was carried out on the resulting student performance data as described below.
PSYCHOMETRIC ANALYSIS OF TEST INSTRUMENTS
An examination of the psychometric properties of the test items was initially undertaken by exploratory factor analysis (EFA) methods. Principal components extraction with varimax rotation was used with the number of factors fixed at four to identify the four factors of Manufacturing Processes, Process Engineering, Drafting/Design, and CAD/CAM which constitute the MILL Model. Test items with factor weights less than |.4| were suppressed, and the items were examined to ensure they did not load on more than one factor, or to ensure they did not fail to load on at least one factor. Then, an item deletion approach was undertaken wherein an item was retained only if its point-biseral correlation (a measure of the homogeneity of the item with the remainder of the scale) was approximately ≥ +.125. (Items were eliminated if the point-biserial was negative, or positive but approximately 0 < rPB < +.125.) The final
result was two 20-item test instruments, Form A and Form B.
Q. What is the proper sequence of G-codes in numerical control programming if the objective is to mill the outer profile of the plate in the figure below?
Cutting direction End Mill
Answers:
Reliability
“According to classical measurement theory, instrument reliability is the consistency that a test measures whatever it measures” (Sawilowsky, 2007, p. 516.). Two types of instrument reliability, parallel forms and internal consistency, were assessed for the test instruments developed.
Parallel Forms describes the stability of scores over time. It was obtained by administering both Form A, and after a delay (in order to eliminate fatigue), Form B to the same students. It is distinguished from test-retest, where the same test is administered twice to the same students, in that it has the advantage of precluding the memory effect (i.e., relying on recollection of the answer obtained previously instead of skills and abilities). It is obtained by computing the Pearson product-moment coefficient of correlation on the scores of the two parallel forms. The parallel forms reliability, rPF, was .86 (with p = .006), indicating a fairly high level of stability of scores.
Internal Consistency is a measure of the homogeneity of subject matter represented by the test items, where the test is randomly split into two parts and the Pearson correlation is computed on the scores for the two parts. This form of internal consistency is called split-halves, rSH, is dependent on the fashion in which the test is split. Cronbach’s α, an
improvement on split halves, is the long-run average correlation obtained from all possible permutations of splitting the test into two parts. To achieve an unbiased estimate, a parallel model was assumed and also reported. Cronbach’s α for Form A was .80, and the unbiased parallel model rPM was .81. The standard error of measure (SEM) was 1.82.
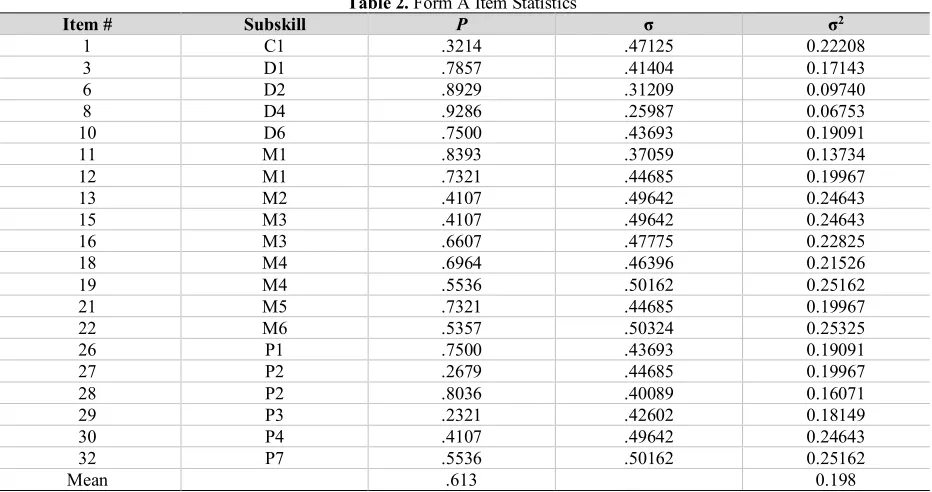
The items descriptors, level of difficulty, and other summary statistics are compiled in Table 2.
Table 2. Form A Item Statistics
Item # Subskill P σ σ2
1 C1 .3214 .47125 0.22208
3 D1 .7857 .41404 0.17143
6 D2 .8929 .31209 0.09740
8 D4 .9286 .25987 0.06753
10 D6 .7500 .43693 0.19091
11 M1 .8393 .37059 0.13734
12 M1 .7321 .44685 0.19967
13 M2 .4107 .49642 0.24643
15 M3 .4107 .49642 0.24643
16 M3 .6607 .47775 0.22825
18 M4 .6964 .46396 0.21526
19 M4 .5536 .50162 0.25162
21 M5 .7321 .44685 0.19967
22 M6 .5357 .50324 0.25325
26 P1 .7500 .43693 0.19091
27 P2 .2679 .44685 0.19967
28 P2 .8036 .40089 0.16071
29 P3 .2321 .42602 0.18149
30 P4 .4107 .49642 0.24643
32 P7 .5536 .50162 0.25162
Mean .613 0.198
The column titled P in the above table is also known, in Classical Measurement Theory, as the item’s difficulty index (Sawilowsky, 2007, p. 517). P values close to 1 indicate the items are easy, whereas P values close to 0 indicate the items are hard. For example, item #29 above would be considered difficult, whereas item #8 is considered to be very easy. Ideally, the average P value in a standardized test should be P = .5. In this case, the mean P value for Form A is
= .61, which is reasonably close to the desired middle point.
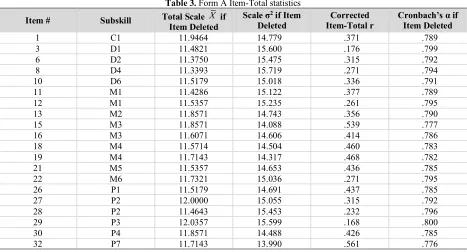
The item-total statistics are compiled in Table 3. They predict the impact of further adjustment through item deletion on Cronbach’s α. It is clear that no further item deletions would result in materially increasing the reliability of the
Table 3. Form A Item-Total statistics
Item # Subskill Total Scale if Item Deleted
Scale σ2 if Item
Deleted Item-Total r Corrected Cronbach’s Item Deleted α if
1 C1 11.9464 14.779 .371 .789
3 D1 11.4821 15.600 .176 .799
6 D2 11.3750 15.475 .315 .792
8 D4 11.3393 15.719 .271 .794
10 D6 11.5179 15.018 .336 .791
11 M1 11.4286 15.122 .377 .789
12 M1 11.5357 15.235 .261 .795
13 M2 11.8571 14.743 .356 .790
15 M3 11.8571 14.088 .539 .777
16 M3 11.6071 14.606 .414 .786
18 M4 11.5714 14.504 .460 .783
19 M4 11.7143 14.317 .468 .782
21 M5 11.5357 14.653 .436 .785
22 M6 11.7321 15.036 .271 .795
26 P1 11.5179 14.691 .437 .785
27 P2 12.0000 15.055 .315 .792
28 P2 11.4643 15.453 .232 .796
29 P3 12.0357 15.599 .168 .800
30 P4 11.8571 14.488 .426 .785
32 P7 11.7143 13.990 .561 .776
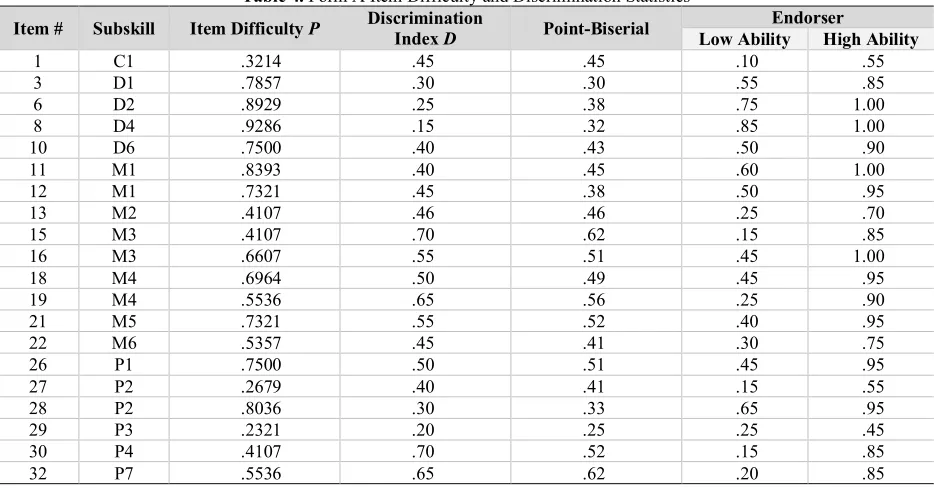
Discrimination statistics via Classical Measurement Theory, the discrimination index, and the point-biserial correlation, are provided in Table 4. Discrimination is the ability of a test item to differentiate between those who know and either those who do not know or are unable to produce the correct answer. These statistics are further refined by grouping students into ability levels. Students scoring in the top 27½ % are placed in the high ability group, whereas students scoring in the bottom 27½ % are placed in the low ability group. Students in the high ability group should correctly answer an item with high a discriminatory ability, while students in the low ability group should not be able to answer that item correctly. When the item difficulty P = .5, the discrimination index D takes on values from -1 to +1. All negative values are interpreted as unacceptable. As D increases from 0 to +1 the discrimination, which is desirable, increases. Note, however, that as the item difficulty rises or lowers from P=.5, the minimum and maximum values for D shrink, and their interpretation is dependent on the values of P. Hence, the point-biserial correlation is also given as an aid to interpreting the item discrimination. An inspection of Table 4 below indicates strong discriminatory ability for all items.
Table 4. Form A Item Difficulty and Discrimination Statistics
Item # Subskill Item Difficulty P Discrimination Index D Point-Biserial Low Ability Endorser High Ability
1 C1 .3214 .45 .45 .10 .55
3 D1 .7857 .30 .30 .55 .85
6 D2 .8929 .25 .38 .75 1.00
8 D4 .9286 .15 .32 .85 1.00
10 D6 .7500 .40 .43 .50 .90
11 M1 .8393 .40 .45 .60 1.00
12 M1 .7321 .45 .38 .50 .95
13 M2 .4107 .46 .46 .25 .70
15 M3 .4107 .70 .62 .15 .85
16 M3 .6607 .55 .51 .45 1.00
18 M4 .6964 .50 .49 .45 .95
19 M4 .5536 .65 .56 .25 .90
21 M5 .7321 .55 .52 .40 .95
22 M6 .5357 .45 .41 .30 .75
26 P1 .7500 .50 .51 .45 .95
27 P2 .2679 .40 .41 .15 .55
28 P2 .8036 .30 .33 .65 .95
29 P3 .2321 .20 .25 .25 .45
30 P4 .4107 .70 .52 .15 .85
32 P7 .5536 .65 .62 .20 .85
The final Form A total scale statistics are compiled in Table 5 below.
Table 5. Final Form A Total Scale Statistics, rPM = .81
N Total Scale σ2 σ SEM Mean Biserial
20 12.288 15.968 3.996 1.82 .604
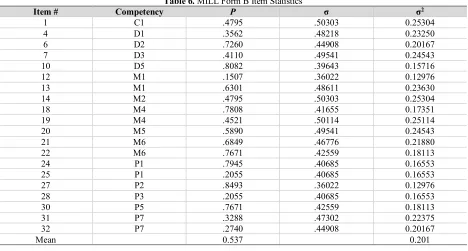
The same process used for obtaining psychometric results for Form A was applied to Form B. Cronbach’s α was .64, and under the parallel model, the unbiased reliability estimate rPM was .65. The SEM = 1.906. The remaining statistics
are compiled in Tables 6 - 9 below. It is also apparent in Table 7 that no further item deletion would materially improve the reliability of Form B, and there was adequate discriminatory power between high and low ability groups.
Table 6. MILL Form B Item Statistics
Item # Competency P σ σ2
1 C1 .4795 .50303 0.25304
4 D1 .3562 .48218 0.23250
6 D2 .7260 .44908 0.20167
7 D3 .4110 .49541 0.24543
10 D5 .8082 .39643 0.15716
12 M1 .1507 .36022 0.12976
13 M1 .6301 .48611 0.23630
14 M2 .4795 .50303 0.25304
18 M4 .7808 .41655 0.17351
19 M4 .4521 .50114 0.25114
20 M5 .5890 .49541 0.24543
21 M6 .6849 .46776 0.21880
22 M6 .7671 .42559 0.18113
24 P1 .7945 .40685 0.16553
25 P1 .2055 .40685 0.16553
27 P2 .8493 .36022 0.12976
28 P3 .2055 .40685 0.16553
30 P5 .7671 .42559 0.18113
31 P7 .3288 .47302 0.22375
32 P7 .2740 .44908 0.20167
Mean 0.537 0.201
Table 7. MILL Form B Item-Total Statistics
Item Competency Total Scale if Item Deleted
Scale σ2 if Item
Deleted
Corrected Item-Total r
Cronbach’s α if Item Deleted
1 C1 10.2603 9.445 .197 .635
4 D1 10.3836 9.518 .187 .636
6 D2 10.0137 9.208 .329 .619
7 D3 10.3288 8.696 .467 .598
10 D5 9.9315 9.815 .135 .641
12 M1 10.5890 9.857 .141 .640
13 M1 10.1096 9.904 .054 .653
14 M2 10.2603 9.251 .262 .627
18 M4 9.9589 9.512 .242 .630
19 M4 10.2877 8.736 .445 .601
20 M5 10.1507 9.769 .094 .649
21 M6 10.0548 8.608 .539 .590
22 M6 9.9726 9.694 .163 .638
24 P1 9.9452 9.803 .133 .641
25 P1 10.5342 9.808 .131 .642
27 P2 9.8904 9.432 .336 .621
28 P3 10.5342 9.863 .109 .644
30 P5 9.9726 9.527 .228 .631
31 P7 10.4110 9.662 .143 .642
32 P7 10.4658 9.419 .249 .629
Table 8. MILL Form B Item Difficulty and Discrimination Statistics.
Item Competency Item Difficulty P Discrimination Index D Point-Biserial Low Ability High Ability Endorser
1 C1 .4795 .50 .38 .17 .67
4 D1 .3562 .42 .35 .17 .58
6 D2 .7260 .54 .52 .42 .96
7 D3 .4110 .71 .55 .08 .79
10 D5 .8082 .29 .38 .63 .92
12 M1 .1507 .25 .30 .08 .33
13 M1 .6301 .42 .31 .42 .83
14 M2 .4795 .54 .43 .21 .75
18 M4 .7808 .42 .46 .54 .96
19 M4 .4521 .71 .56 .13 .83
20 M5 .5890 .25 .34 .42 .67
21 M6 .6849 .71 .65 .25 .96
22 M6 .7671 .29 .42 .50 .79
24 P1 .7945 .29 .39 .54 .83
25 P1 .2055 .21 .29 .08 .29
27 P2 .8493 .38 .52 .54 .92
28 P3 .2055 .33 .28 .08 .42
30 P5 .7671 .38 .43 .50 .88
31 P7 .3288 .42 .33 .13 .54
32 P7 .2740 .50 .39 .04 .54
Table 9. Final Form B Total Scale Statistics, rPM = .65
N Total Scale σ2 σ SEM Mean Biserial
20 10.476 14.347 3.788 1.906 .548
In standardized testing, raw scores are typically transformed to T scores, which are of the form T = 10Z + 50. This can easily be obtained in SPSS via menu choices of Transform | Rank Cases | Rank Types | Normal Scores | Blom. The resulting Z scores are then converted to T scores with the SPSS compute command (e.g., if the Z variable is named NVAR1, use Compute T = 10*NVAR1+50.).
This yields a standard scale of 20 to 80, with a mean of 50 and standard deviation of 10. For comparison purposes, the relevant scores on Form A are presented in Table 10. This table readily permits converting a raw score into T score, and percentile equivalents. (Note that not all raw scores were present in the original data (e.g., X = 1, 2, 4). Interpolation, extrapolation, or spline fitting techniques can be used to obtain the corresponding standardized scores for those data points.).
The results of the all the analyses demonstrate that the test instruments that were developed are internally consistent, and psychometrically reliable and valid.
Table 10. Standardized Scores for Form A
Raw Score Raw Score 20 T Score Percentile
3 0.15 27.13 1.11
5 0.25 31.03 2.89
7 0.35 37.18 10.00
8 0.40 40.85 18.00
9 0.45 42.72 23.33
10 0.50 44.63 29.56
11 0.55 47.52 40.22
12 0.60 50.67 52.67
13 0.65 52.25 58.89
14 0.70 53.41 63.33
15 0.75 55.37 70.44
16 0.80 57.57 77.56
17 0.85 59.50 82.89
18 0.90 62.82 90.00
19 0.95 68.97 97.11
CONCLUSION
This work shows that standardized tests can be used for outcomes assessment and authentication of the attainment of target hands-on competencies. The paper demonstrates that the test instruments that have been developed are robust, and psychometrically valid. For Form A, the instrument’s average difficulty index P of 0.61 is close to the middle point of 0.5 which is ideal for standardized tests; the parallel forms reliability, rPF, was .86, indicating a high level of
stability of test scores; Cronbach’s α was .80, while the unbiased parallel model rPM was .81; indicating a high level
of internal consistency. Form B has similar characteristics. The use of well-constructed standardized tests can conveniently document attainment of targeted learning outcomes for accreditation and other assessment purposes. This is an innovative use of standardized testing for programmatic evaluation. The incorporation of a physical manipulative to evaluate attainment of hands-on engineering competencies in a psychometrically validated standardized test is a unique pioneering contribution.
ACKNOWLEDGMENT
The work described in this paper was supported by the National Science Foundation IUSE Program under grant number DUE-1432284. Any opinions, findings, and/or recommendations in the paper are those of the authors and do not necessarily reflect the views of the sponsors.
AUTHOR BIOGRAPHIES
Mukasa E. Ssemakula is a full Professor in the Division of Engineering Technology at Wayne State University. He holds a Ph.D. and B.Sc. in Mechanical Engineering, and an M.Sc. in Manufacturing Technology, all from the University of Manchester Institute of Science and Technology (England). After working in industry, he joined the faculty of the University of Maryland, and joined Wayne State in 1993. He is a leader in developing fresh pedagogical approaches to engineering education and has research interests in Manufacturing Systems.
Gene Y. Liao is a full Professor in the Division of Engineering Technology at Wayne State University. He holds a Doctor of Engineering degree from the University of Michigan, an M.S. in Mechanical Engineering from the University of Texas, and a B.S, in Mechanical Engineering from National Central University, Taiwan.He had over 15 years of industrial experience in the automotive sector prior to becoming a faculty member.
non-parametric, robust, permutation, and exact statistics; classical measurement theory; and research and experimental design.
REFERENCES
ABET Inc. (2016a): Criteria for Accrediting Engineering Programs, 2017-2018 http://www.abet.org/accreditation/accreditation-criteria/criteria-for-accrediting-engineering-programs-2017-2018/ (accessed 12/28/2016).
ABET Inc. (2016b): Criteria for Accrediting Engineering Technology Programs, 2017-2018
http://www.abet.org/accreditation/accreditation-criteria/criteria-for-accrediting-engineering-technology-programs-2017-2018/ (accessed 12/28/2016).
Bridge P. D., Musial, J., Roe T., Frank, R., & Sawilowsky, S. S. (2003). Measurement practices: Methods for developing content valid student examinations. Medical Teacher, 25, 277-284.
Mott, R. L. & Hugh, J. (2011). What is Curricula 2015? Paper presented at the ASEE Annual Conference & Exposition, Vancouver, BC, Canada.
Sawilowsky, S. S. (2000a). Psychometrics versus datametrics: Comment on Vacha-Haase’s ‘Reliability generalization’ method and some EPM editorial policies. Educational and Psychological Measurement, 60(2), p. 157-173.
Sawilowsky, S. S. (2000b). Rejoinder to Thompson and Vacha-Haase. Educational and Psychological Measurement, 60(2), 196-200.
Sawilowsky, S. S. (2007). KR-20 and KR-21. In (N. J. Salkind, Ed.) Encyclopedia of Measurement and Statistics, Thousand Oaks, CA: Sage, 516-519.
SME Education Foundation (2003): Competency Gaps and Criteria, Society of Manufacturing Engineers, Dearborn, MI. Solomon, S., R., & Sawilowsky, S. S. (2009). Impact of rank-based normalizing transformations on the accuracy of test scores.
Journal of Modern Applied Statistical Methods, 8(2), 448 – 462.
Ssemakula, M. E., Liao, G., Ellis, D., Kim, K. Y., & Sawilowsky, S. S. (2009). Introducing a flexible adaptation framework for implementing ‘learning factory’–based manufacturing education. Paper presented at the ASEE Annual Conference & Exposition, Austin, TX.
Ssemakula, M. E., Liao, G., Ellis, R. D., Kim, K-Y, Aguwa, C., & Sawilowsky, S. S. (2011a): Manufacturing integrated learning lab (MILL): A curriculum model for hands-on manufacturing education. Paper presented at the ASEE Annual
Conference & Exposition, Vancouver, BC, Canada.