www.nat-hazards-earth-syst-sci.net/10/895/2010/ © Author(s) 2010. This work is distributed under the Creative Commons Attribution 3.0 License.
and Earth
System Sciences
Radon concentration in soil gas and radon exhalation rate at the
Ravne Fault in NW Slovenia
J. Vaupoticˇ1, A. Gregoriˇc1, I. Kobal1, P.Zvabˇ 2, K. Kozak3, J. Mazur3, E. Kochowska3, and D. Grza¸dziel3
1Joˇzef Stefan Institute, Ljubljana, Slovenia
2Faculty of Natural Sciences and Engineering, University of Ljubljana, Ljubljana, Slovenia
3The Henryk Niewodnicza˜nski Institute of Nuclear Physics, Polish Academy of Science, Krak´ow, Poland
Received: 30 November 2009 – Revised: 15 March 2010 – Accepted: 10 April 2010 – Published: 23 April 2010
Abstract. The Ravne tectonic fault in north-west (NW) Slovenia is one of the faults in this region, responsible for the elevated seismic activity at the Italian-Slovene border. Five measurement profiles were fixed in the vicinity of the Ravne fault, four of them were perpendicular and one par-allel to the fault. At 18 points along these profiles the fol-lowing measurements have been carried out: radon activity concentration in soil gas, radon exhalation rate from ground, soil permeability and gamma dose rate. The radon mea-surements were carried out using the AlphaGuard equip-ment, and GammaTracer was applied for gamma dose rate measurements. The ranges of the obtained results are as follows: 0.9–32.9 kBq m−3 for radon concentration (CRn),
1.1–41.9 mBq m−2s−1for radon exhalation rate (ERn), 0.5–
7.4×10⁻¹³m2for soil permeability, and 86–138 nSv h−1for gamma dose rate. The concentrations of222Rn in soil gas were found to be lower than the average for Slovenia. Be-cause the deformation zones differ not only in the direction perpendicular to the fault but also along it, the behaviour of eitherCRnorERn at different profiles differ markedly. The
study is planned to be continued with measurements being carried out at a number of additional points.
1 Introduction
Noble radon gas (222Rn) originates from radioactive transfor-mation of226Ra in the238U decay chain in the earth’s crust. Only a fraction of the radon atoms so created is able to em-anate from the mineral grains and enter the void space, filled either by gas or water. From here, radon moves further by
Correspondence to: A. Gregoriˇc (asta.gregoric@ijs.si)
diffusion and, for longer distances, by advection dissolved either in water or in carrier gases. Eventually it exhales into the atmosphere. Radon emanation depends mainly on
226Ra content and mineral grain size, its transport in the
earth governed by geophysical and geochemical parameters, while exhalation is controlled by hydrometeorological condi-tions (Etiope and Martinelli, 2002). Radon activity concen-tration, measured at the surface, either in a thermal spring or in soil gas is a result of a combined effect of the above mentioned parameters. Among diurnal and seasonal varia-tions which are ascribed to the hydrometeorological parame-ters, sudden changes (either increase or decrease, also called radon anomalies) may be observed in the time series of radon concentration. These have been found to be related to an in-crease in seismic (King, 1986; Zmazek et al., 2002) or vol-canic (Cigolini et al., 2007; Gasparini and Mantovani, 1978) activity of a region, or activity change of a tectonic or geo-logic fault (Sebela et al., 2010). On the other hand, radonˇ anomalies in the spatial distribution of radon levels in a re-gion have been observed to coincide with the locations of tec-tonic and geologic faults, either well expressed on the surface or still hidden (Burton et al., 2004; Swako˜n et al., 2005).
The Ravne fault is one of the faults in NW Slovenia responsible for elevated seismic activity along the Socaˇ
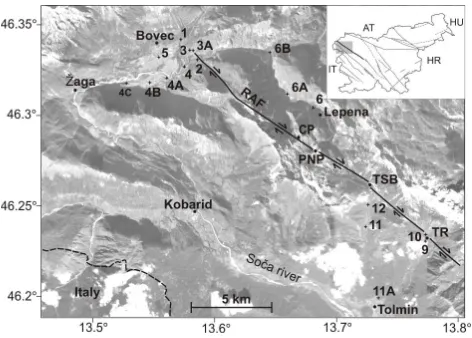
Fig. 1. Location of the Ravne fault with the measurement points
indicated. CP –Cez Potoˇ ˇce, PNP – Planina na Polju, RAF – Ravne fault, TR – Tolminske Ravne, TSB – Tolminka Springs basin.
2 Description of the Ravne Fault
The Ravne Fault is an actively propagating NW-SE trend-ing dextral strike-slip fault in the Julian Alps of NW Slove-nia (Fig. 1). Strike-slip displacements on moderate-steep fault planes are responsible for the recent seismic activity that is confined to shallow crustal levels. The fault is grow-ing by interaction of individual right steppgrow-ing fault segments and breaching of local transtensional step-over zones. The fault geometry is controlled by the original geometry of the NW-SE trending thrust zone, modified by successive fault-ing within the fault zone. At epicentral depths, the fault system is accommodating recent strain along newly formed fault planes, whereas in upper parts of the crust the activity is distributed over a wider deformation zone that includes re-activated brittle thrust faults. The active deformation along the Ravne fault zone is concentrated in the upper parts of the crust, which is characterized by a high density of older structural elements such as fault planes, fractures and cleav-age. The fault is best exposed in its central part around the Tolminka Springs basin over a length of approximately 11 km from theCez Potoˇ ce pass in the NW to the Tolminskeˇ
Ravne in the SE (Fig. 1) (Kastelic et al., 2008). The Bovec basin, at the north-western end of Ravne fault, is charac-terised by Triassic and Jurassic carbonates and Cretaceous flysch, covered by fluvio-glacial deposits. The Ravne fault is less exposed to the SE of the Tolminka Springs basin, where it is covered by grass and forested terrain. There are no individual fault planes outcropping between the Tolminka Springs basin and areas SE of Tolminske Ravne. Along that part of the fault trace, the fault exhibits a right-stepping fault segmentation pattern and both segments overstep in the area of Tolminske Ravne.
Fig. 2. Measurement profiles.
3 Experimental
3.1 Measurement points
In principle, measurement points were selected on the basis of geology and tectonics of the area. The number of cho-sen points had to be limited because of mountainous terrain with scarce roads. Some points were not accessible by car, which was necessary to transport equipment. Thus, in to-tal, measurements were performed at 18 points, grouped in five profiles, four perpendicular and one parallel to the fault (Fig. 2).
3.2 Radon in soil gas
The measurement set-up to analyse radon concentration in soil gasCRn(Bq m−3) consisted of an AlphaGuard PQ 2000
PRO (AG) radon monitor, a soil-gas probe and an Alpha-Pump (AP) (Genitron, Germany) (Fig. 3). Soil gas was pumped through the AG ionization chamber at a flow rate of 0.3 dm3min−1. The temporary radon (222Rn) concentrations
were registered in one-min intervals over approximately a 20-min period. After initial growth, the concentration be-came stabilised. The average of the last few stabilised values was taken as the radon concentration in soil gas. At this low flow rate, contribution of thoron (220Rn, half-life 55 s) was negligible (Zuni´c et al., 2006).ˇ
3.3 Radon exhalation from soil
The radon exhalation rateERn (Bq m−2s−1) from soil was
Fig. 3. Soil gas radon measurement.
every 10 min. The exhalation rate was calculated according to the formula:
ERn=B·
V F
where: B– slope of the straight line fixed to the increasing radon concentration points in the EB,V – volume of the EB (m3), F – surface area covered by EB (m2) (Zuni´c et al.,ˇ
2006).
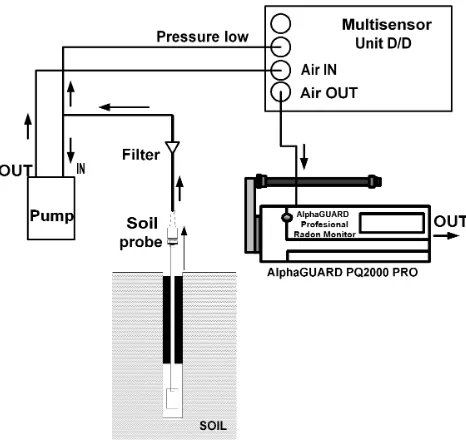
3.4 Soil permeability
The system to measure soil permeabilityksoil(m2) consisted
of a Multisensor Unit D/D device (Genitron, Germany) and the same AG monitor, AP pump and soil-gas probe as in Sect. 3.1 (Fig. 5). Soil gas was sucked from soil by soil-gas probe and pumped through the AG and Multisensor. The pressure difference between soil air and open air (1P) and flow rate(Q)were measured by the Multisensor D/D. The soil permeability was calculated using a modified equation of Fick’s law of diffusion (Janik, 2005):
ksoil=µ
Q
W·1P, (1)
in which:ksoilis soil permeability (m2),µis dynamic
viscos-ity of air (Pa s),W is shape parameter of the soil-gas probe (m),Qis soil gas flow rate (m3min−1), and1P is pressure difference measured (Pa) (Zuni´c et al., 2006).ˇ
3.5 Gamma dose rate
Gamma dose rateH˙γ (nSv h−1) was measured in outdoor air at the height of 1 m above the ground using a GammaTracer TM Wide Type E probe (Genitron, Germany). The values of gamma dose rate were registered in 5-min intervals. The average value of 12–15 records was taken as a final result.
Fig. 4. Radon exhalation measurement.
Fig. 5. Soil permeability measurement (Genitron Manual
Multisen-sor D/D).
4 Results and discussion
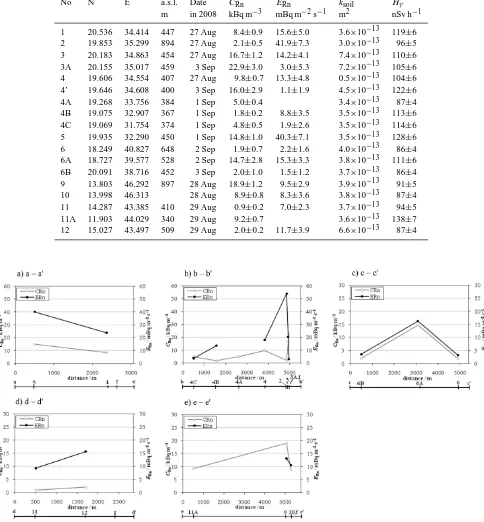
The results are shown in Table 1. The coordinates and eleva-tions above sea level (a.s.l.) of measurement points together with the dates of measurements are also presented. The mea-surement points lie from about 350 m to almost 900 m a.s.l. The values of radon concentration in soil gasCRn were in
the range 0.9–22.9 kBq m−3 and are lower than the aver-age of 40.1 kBq m−3obtained at 70 points all over Slovenia (Vaupotic, 2009). Also radon exhalation rateˇ ERnvaried
5 19.935 32.290 450 1 Sep 14.8±1.0 40.3±7.1 3.5×10⁻¹³ 128±6 6 18.249 40.827 648 2 Sep 1.9±0.7 2.2±1.6 4.0×10⁻¹³ 86±4 6A 18.727 39.577 528 2 Sep 14.7±2.8 15.3±3.3 3.8×10⁻¹³ 111±6 6B 20.091 38.716 452 3 Sep 2.0±1.0 1.5±1.2 3.7×10⁻¹³ 86±4 9 13.803 46.292 897 28 Aug 18.9±1.2 9.5±2.9 3.9×10⁻¹³ 91±5 10 13.998 46.313 28 Aug 8.9±0.8 8.3±3.6 3.8×10⁻¹³ 87±4 11 14.287 43.385 410 29 Aug 0.9±0.2 7.0±2.3 3.7×10⁻¹³ 94±5 11A 11.903 44.029 340 29 Aug 9.2±0.7 3.6×10⁻¹³ 138±7 12 15.027 43.497 509 29 Aug 2.0±0.2 11.7±3.9 6.6×10⁻¹³ 87±4
Fig. 6. Radon activity concentrations in soil gas (CRn) and radon exhalation rate (ERn) at profile (f – fault): (a) a–a’, (b) b–b’, (c) c–c’, (d)
d-d’, and (e) e–e’.
medium. Gamma dose rate in the range 86–138 nSv h−1is close to the average value obtained for the central part of Slovenia of 118 nSv h−1(Brajnik et al., 1992).
anomalies, as shown by Ciotoli et al. (1999). Furthermore, CRn and ERn depend also on local characteristics such as
thickness of soil covering the underlying deformed rocks. Thus, close to the fault bothCRn andERn are lower at the
a–a’ profile (Fig. 6a) and higher at the d-d’ profile (Fig. 6d). The contribution of different stages of rock deformation along the Ravne fault depends locally on the width of the fault deformation zone. Rock fractures could increase radon exhalation from deeper layers and its accumulation in soil (point 5 in the a–a’ profile, point 12 in d-d’ profile), whereas in the area of intensely deformed rocks, the process of ce-mentation could reduce radon exhalation from deeper layers (point 1 in the a–a’ profile and point 10 in the e–e’ profile). However deformation zones not only differ in perpendicu-lar direction to the fault but also along its length. Therefore interpretation of radon results is not always possible.
At the b–b’ profile (Fig. 6b), where a flat terrain enabled measurements at several distances from the fault, at least on one side of the fault, bothCRn andERn appear to be
con-stant in approaching the fault until about 1 km before the fault, whereERnincreases substantially, with a concomitant
reduction ofCRn(measurement point 2). The reason for such
deviation at measurement point 2 is not understood. At the same time light soil mixed with gravel could also contribute to radon exhalation from the measuring well to the air dur-ing the measurement. In close proximity to the faultERnis
very low, thus enhancing accumulation of radon in soil and consequently increasingCRn.
The c–c’ profile (Fig. 6c) lies along the Lepena valley, par-allel to the fault. HigherCRn andERn could be explained
by local characteristics of rock deformation and thickness of soil.
5 Conclusions
The results of measurements of radon activity concentration in soil gas, radon exhalation rate from ground, soil perme-ability and gamma dose rate in the vicinity of Ravne fault in NW Slovenia are presented. The study area was chosen using geological data and the knowledge of fault course.
The concentrations of222Rn in soil gas were found to be lower than the average for Slovenia. Unlike to the results of similar study (Swako˜n et al., 2005) there was no rapid increase of radon concentration in soil near the fault. Be-cause the deformation zones differ not only in the direction perpendicular to the fault but also along it, the behaviour of eitherCRnorERnat different profiles differ markedly.
There-fore, a full interpretation is very difficult based on the current database. The study is planned to be continued with measure-ments being carried out at a number of additional points, to build a more complete database to aid interpretation of re-sults. More precise identification of physical characteristics of the ground as well as determination of radium226Ra in soil profiles would be needed to give a detailed interpretation.
Edited by: T. Przylibski
Reviewed by: two anonymous referees
References
Brajnik, D., Miklavˇzic, U., and Tomˇsiˇ c, J.: Map of natural radioac-ˇ tivity in Slovenia and its correlation to the emanation of radon, Radiat. Prot. Dosim., 45, 273–276, 1992.
Burton, M., Neri, M., and Condarelli, D.: High spatial resolution radon measurements reveal hidden active faults on Mt. Etna, Geophys. Res. Lett., 31, L07618, doi:10.1029/2003GL019181, 2004.
Cigolini, C., Laiolo, M., and Coppola, D.: Earthquake-volcano in-teractions detected from radon degassing at Stromboli (Italy), Earth Planet. Sc. Lett., 257, 511–525, 2007.
Ciotoli, G., Etiope, G., Guerra, M., and Lombardi, S.: The detection of concealed faults in the Ofanto Basin using the correlation be-tween soil-gas fracture surveys, Tectonophysics, 301, 321–332, 1999.
Etiope, G. and Martinelli, G.: Migration of carrier and trace gases in the geosphere: an overview, Phys. Earth Planet. In., 129, 185– 204, 2002.
Gasparini, P. and Mantovani, M. S. M.: Radon anomalies and vol-canic eruptions, J. Volcanol. Geoth. Res., 3, 325–341, 1978. Janik, M.: Radon transport model and its verification by
measure-ments in houses, IFJ PAN, Krakow, 50–57, 2005.
Kastelic, V., Vrabec, M., Cunningham, D., and Gosar, A.: Neo-Alpine structural evolution and present-day tectonic activity of the eastern Southern Alps: The case of the Ravne Fault, NW Slovenia, J. Struct. Geol., 30, 963–975, 2008.
King, C. Y.: Gas geochemistry applied to earthquake prediction – an overview, J. Geophys. Res.-Solid, 91, 2269–2281, 1986. Swako˜n, J., Kozak, K., Paszkowski, M., Gradzi´nski, R.,
Łoskiewicz, J., Mazur, J., Janik, M., Bogacz, J., Horwacik, T., and Olko, P.: Radon concentration in soil gas around local dis-junctive tectonic zones in the Krakow area, J. Environ. Radioac-tiv., 78, 137–149, 2005.
ˇSebela, S., Vaupotic, J., Koˇs’t´ak, B., and Stemberk, J.: Micro-ˇ displacements and radon air concentrations in Postojna Cave, Slovenia, J. Cave Karst Stud., in press, 2010.
Vaupotic, J.:ˇ Review of radon research in Slovenia, IAEA-TECDOC, 2009.
Zmazek, B., ˇZivci´c, M., Vaupotiˇ c, J., Bidovec, M., Poljak, M., andˇ Kobal, I.: Soil radon monitoring in the Krˇsko Basin, Slovenia, Appl. Radiat. Isotopes, 56, 649–657, 2002.
ˇ