Nat. Hazards Earth Syst. Sci., 11, 205–217, 2011 www.nat-hazards-earth-syst-sci.net/11/205/2011/ doi:10.5194/nhess-11-205-2011
© Author(s) 2011. CC Attribution 3.0 License.
Natural Hazards
and Earth
System Sciences
Short-term retreat statistics of a slowly eroding coastal cliff
A. P. Young1, R. T. Guza1, W. C. O’Reilly1, R. E. Flick1, and R. Gutierrez2
1Integrative Oceanography Division, Scripps Institution of Oceanography, University of California San Diego, La Jolla,
California, USA
2Center for Space Research, The University of Texas at Austin, Austin, Texas, USA
Received: 29 July 2010 – Revised: 28 October 2010 – Accepted: 4 December 2010 – Published: 21 January 2011
Abstract. The frequency, spatial distribution, and
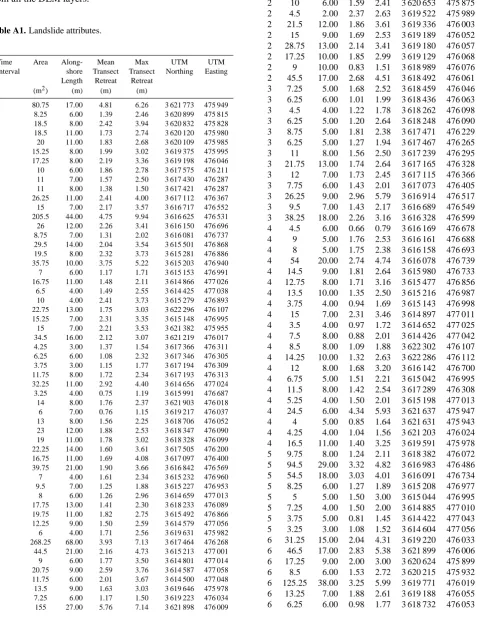
dimen-sions of coastal cliff retreats, a basic statistic underlying cliff top hazard assessment, are presented for 7.1 km of unprotected and slowly retreating coastal cliffs near Point Loma in San Diego, California, US. Using 8 airborne light detection and ranging (lidar) surveys collected over 5.5 years, 130 individual cliff edge failures (primarily rockfalls, block falls, and topples) were detected. Footprint areas varied from 3 to 268 m2, maximum landward retreats from 0.8 to 10 m, and alongshore lengths from 2 to 68 m. The failures with the largest landward retreats were also relatively long, and 13% of the slides accounted for 50% of the lost cliff area over the study period. On this short (5.5 years) time scale, “no change” was the most common observation (84% of the cliff edge). Probability distributions of non-zero cliff retreat during each time interval usually had a single peak between 1 and 2.5 m. Intervals with high mean retreat had elevated numbers of failure in all class sizes, and also contained the largest individual retreats. Small and medium slides tended to reoccur preferentially (relative to randomly) near previous small and medium slides, forming short-term hot spots, while large slides were less likely to reoccur near previous large slides. Cumulative distributions of landslide failure parameters (area, mean retreat, maximum retreat, and length) follow an inverse power-law for medium to large size events, similar to previously reported distributions of coastal and inland landsliding.
1 Introduction
Seacliff retreat threatens cliff top infrastructure, and estimates of future cliff positions are needed for coastal planning. Multiple marine and subaerial erosive processes
Correspondence to: A. P. Young ([email protected])
interact with complex site-specific local geology to pro-duce temporally and spatially variable retreat (Trenhaile, 1987; Sunamura, 1992). The limited available historical observations provide mean (time-and-alongshore averaged) retreat rates, but extrapolation of these rates to estimate site-specific future risk is problematic because the magnitude variability (in space and time) of cliff retreat is not considered (Cambers, 1976; Lee et al., 2001; Moore and Griggs, 2002; Quinn et al., 2009). Retreat magnitude variability and episodicity are included in recent probabilistic characterizations of cliff retreat (e.g. Lee et al., 2001, 2002; Hall et al., 2002; Williams et al., 2004; Teixeira, 2006; Milheiro-Oliveira, 2007; Furlan, 2008). These models highlight both the need for, and the scarcity of, observations of even basic statistics such as the dependence of cliff retreat frequency on retreat magnitude.
The statistics of inland mass movements have been studied extensively (e.g. Hovius et al., 1997; Pelletier et al., 1997; Dai and Lee, 2001; Dussauge-Peisser et al., 2002; Guzzetti et al., 2002; Hergarten, 2003; Brardinoni and Church, 2004; Brunetti et al., 2009; ten Brink et al., 2009). Historical records of coastal cliff failure statistics are relatively sparse. Dong and Guzzetti (2005) investigated the frequency statistics of soft cliff retreat for two data sets. The first (obtained from Hall et al., 2002) consisted of 32 (26 non-zero) measurements made along eight transects over four time intervals ranging from 7 to 29 years at East End in East Sussex, England. The second data set included 198 (168 non-zero) yearly measurements from 1953 to 1990 along six transects on the Holderness coast, England. For both datasets, the frequency of cliff retreat decreases with event size, and medium to large size events follow an inverse power-law distribution.
Teixeira (2006) investigated the frequency statistics and geometric relationships of coastal mass movements in Miocene aged rock cliffs of the Algarve, Portugal. These datasets consisted of 140 field measurements obtained over
nine years, and 177 events obtained from aerial photographs over 44 years. The cumulative frequency of cliff retreat for both datasets fit a power-law distribution above a critical value, and deviated for relatively small events. Teixeira (2006) also found power-law relationships between volume, horizontal area, and retreat. Marques (2008) further investigated the magnitude-frequency statistics of strong, slowly retreating coastal cliffs (<10 cm yr−1) in terms of volume, horizontal area, and cliff retreat. The database included about 600 events from regional scale observations obtained from aerial photographs spanning up to 53 years in Portugal and Morocco, and smaller scale insitu field observations (from Teixeira, 2006) in Portugal.
Rosser et al. (2007) used high resolution monthly terrestrial laser scans collected over 32 months in the North York Moors National Park, UK to compile a large database of over 500 000 coastal rockfalls. Rockfall volume and scar area (parallel to the rock face) followed a power law, and the cumulative distribution followed a linear trend for log volume versus normalized frequency. Their results suggested that rock type influenced scar geometry, and that smaller rockfalls often preceded larger failures.
Lim et al. (2010) recently compiled a database over 100 000 coastal rockfalls using monthly terrestrial laser scanning and orthophotography over 20 months at Staithes, North Yorkshire, UK. They found a linear trend in the non-cumulative distribution of log volumes, including the small changes that were resolved with their uniquely high-resolution observations. These results suggest under-sampling of small cliff failures caused the deviation of the magnitude-frequency relationships found previously in coastal (Dong and Guzzetti, 2005; Teixeira, 2006; Marques, 2008) and inland (e.g. Hovius et al., 1997; Stark and Hovius 2001; Dussauge-Peisser et al., 2002; Malamud et al., 2004) observations.
The different methods, measured parameters, and failure types make comparisons of failures from different studies difficult. For example Teixeira (2006) and Marques (2008) report horizontal (planimetric) area while Rosser et al. (2007) and Lim et al. (2010) consider area parallel to the cliff face. Some studies focus on magnitude-frequency relationships of cliff retreat (Dong and Guzzetti, 2005; Teixeira, 2006) while others on failure volume (Rosser et al., 2007; Lim et al., 2010). Cliff edge retreat failures, a subset of the cliff failures, are generally used in models to establish structural setbacks, while volumetric statistics are more appropriate for processed-based modeling. Many authors note that additional cliff failure inventories are required to assess the generality and predictive utility of observation-based, statistical characterizations of cliff retreat. The present study uses 8 airborne lidar surveys collected over 5.5 years to describe basic two dimensional (planimetric), short-term (5.5 yr) statistics of cliff edge failures over 7.1 km of unprotected coastal rock cliffs in southern California, US.
?
C
liff
S
tu
d
y S
e
cti
o
n
9.9
k
m
M
O
P
L
oc
a
tio
n
Ocean Beach
Coronado San
Dieg o Ba
y
0 10 Cliff Retreat (m) November 2003 to March 2009
Ü
Seawall / Riprap Locations
Califo rnia
Study Site
A
SunsetCliffs
Point Loma P1
P2
0 2
Kilometers
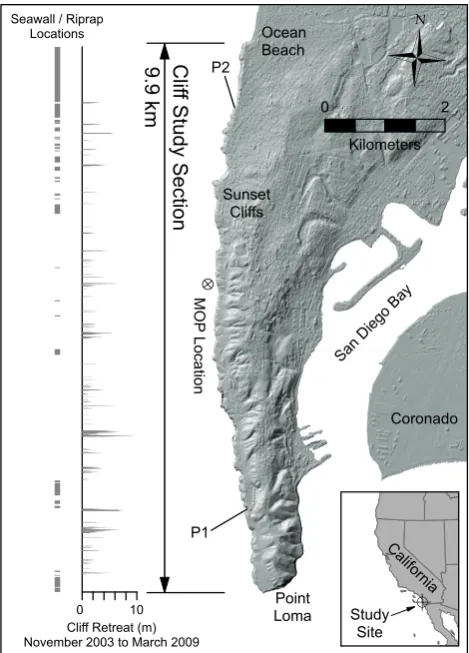
Fig. 1. Location map of the Sunset Cliffs to Point Loma study
area showing alongshore projected locations of seawall/riprap and the cumulative cliff retreat (unprotected cliffs) occurring during the study period (October 2003 to March 2009). At least two locations (P1 and P2) with seawall/riprap experienced significant erosion.
2 Study area
2.1 General description
A. P. Young et al.: Cliff retreat statistics 207
Fig. 2. Oblique photo showing the general stratigraphy and landscape of the study area (photo by Darren Wright, California Data Information Program).
2.2 Geology
Point Loma is a rock promontory uplifted by the Rose Canyon section of the Rose Canyon-Newport-Inglewood Fault. The seacliffs exposed on the seaward side of the promontory are generally 20 to 30 m high (range of 5 to 40 m), and are composed of two geologic units (Fig. 2). The lower unit is the Point Loma Formation, a lithified Cretaceous interbedded fine grain sandstone and shale, unconformably overlain by the Bay Point Formation, a poorly consolidated Pleistocene sandstone terrace deposit (Kennedy, 1975). The contact between the two units decreases in elevation towards the north, where it intersects the cliff base in the heavily armored section of Ocean Beach. The Point Loma Formation often forms a vertical cliff face except where undercut, while the weaker Bay Point Formation tends to form slope angles of about 30◦ (Figs. 2 and 3). There are two common cliff profiles; (1) nearly entirely vertical and composed primarily of the Point Loma Formation, and (2) a sloped upper cliff composed of the Bay Point Formation (Fig. 3). According to Emery and Kuhn (1982), both profiles indicate that marine erosion dominates subaerial erosion. However, Kuhn and Shepard (1984) and Flick (1994) document accelerated local erosion caused by concentrated surface runoff, and the relative importance of marine versus subaerial processes is unknown. Although the statistical failure properties described are for unprotected cliffs, they may be affected by adjacent armored cliffs and cliff top development.
Joints, fractures, and a series of northeasterly intersecting faults create weak areas in the lower cliff, resulting in alongshore variable cliff resistance, and a highly irregular shoreline containing sea caves, wave cut notches, surge channels, small headlands, a few pocket beaches, and an occasional sea stack, arch, or blow-hole. The shore platform,
Cliff Retreat
(m) 8
0
67 m 68 m
Ü
Cliff Retreat
(m) 6 0
A
A'
B
B'
Ü
0 10 20
Meters 0 20 40Meters
Cliff Retreat 4.0 m
Cliff Retreat 4.7 m
Profile A-A' Profile B-B'
Terrace Deposits
Point Loma Formation Talus
29 m Sunset Cliffs Blvd
(a)
(b
)
(c
)
(d
)
Talus
Seaward Cliff Edge Seaward
Cliff Edge
0 20
Meters
0 30 Meters
Point Loma Formation
Terrace Deposits
Cliff Top Edge
Cliff Retreat
(m) 8
0
67 m 68 m
Ü
Cliff Retreat
(m) 6 0
A
A'
B
B'
Ü
0 10 20
Meters 0 20 40Meters
Cliff Retreat 4.0 m
Cliff Retreat 4.7 m
Profile A-A' Profile B-B'
Terrace Deposits
Point Loma Formation Talus
29 m Sunset Cliffs Blvd
(a)
(b)(c
)
(d
)
Talus
Seaward Cliff Edge Seaward
Cliff Edge
0 20
Meters
0 30 Meters
Point Loma Formation
Terrace Deposits
Cliff Top Edge
Cliff Retreat
(m) 8
0
67 m 68 m
Ü
Cliff Retreat
(m) 6 0
A
A'
B
B'
Ü
0 10 20
Meters 0 20 40Meters
Cliff Retreat 4.0 m
Cliff Retreat 4.7 m
Profile A-A' Profile B-B'
Terrace Deposits
Point Loma Formation Talus
29 m Sunset Cliffs Blvd
(a)
(b
)
(c)
(d
)
Talus
Seaward Cliff Edge Seaward
Cliff Edge
0 20
Meters 0 30Meters
Point Loma Formation
Terrace Deposits
Cliff Top Edge
Cliff Retreat
(m) 8
0
67 m 68 m
Ü
Cliff Retreat
(m) 6 0
A
A'
B
B'
Ü
0 10 20
Meters 0 20 40Meters
Cliff Retreat 4.0 m
Cliff Retreat 4.7 m
Profile A-A' Profile B-B'
Terrace Deposits
Point Loma Formation Talus
29 m Sunset Cliffs Blvd
(a)
(b
)
(c
)
(d)Talus
Seaward Cliff Edge Seaward
Cliff Edge
0 20
Meters 0 30Meters
Point Loma Formation
Terrace Deposits
Cliff Top Edge
Fig. 3. Areas of large cliff failures (red) and resulting talus deposition (blue) that occurred in (a) Interval 5, and (b) Interval 2. Lower inset: cliff retreat versus alongshore location. (c) Schematic cut-away view on profiles A-A’ and (d) B-B’ before (red line) and after the cliff failures. Typical notch profiles in (c) and (d) were estimated from oblique photos (www.californiacoastline.org). Scale bars in panels (c) and (d) represent both the cross-shore and vertical cliff dimensions.
composed of the Point Loma Formation, is often submerged at the cliff base and lacking beach sand (with the exception of a few narrow pocket beaches), with wave attack during average or higher tide stages. At some locations, the shore platform elevation allows wave attack at all tide stages. Cliff undercutting at the cliff base from wave action is often present and can result in cliff instability, as at other cliffs (Hampton, 2002; Kogure et al., 2006; Young and Ashford, 2008; Budetta, 2010). Cliff failures in the Point Loma Formation generally occur as rock falls, block falls, and topples (Varnes, 1978).
2.3 Historical erosion
Historical photographs of Sunset Cliffs-Point Loma (Shepard and Grant IV, 1947; Shepard and Wanless, 1971; Kuhn and Shepard, 1984) show the collapse of sea arches and sea caves, the erosion of sea stacks, and an earthquake-triggered cliff failure. Kennedy (1973) used old photographs and observations to estimate an average cliff retreat rate of 1.2 cm yr−1 over 75 years, and noted that some sea caves extend landward as much as 18 m from the cliff face. Average cliff retreat of 8 cm yr−1 between 1952 and 1994 was estimated using orthorectified aerial photographs (Benumof and Griggs, 1999; Moore et al., 1999; Benumof et al., 2000). Spaulding and Crampton (2001) estimated retreat rates of 2 to 6 cm yr−1 for a small portion of Sunset Cliffs over a 70-year period beginning in 1928 from aerial photographs. Hapke and Reid (2007a) used 1934 T-sheets and a 1998 lidar survey to estimate cliff retreat rates along cross-shore transects that average to 17 cm yr−1. Several studies (Shepard and Grant IV, 1947;
Kennedy, 1973; Spaulding and Crampton, 2001) indicated no observable erosion at some locations over considerable time periods, while others (Kuhn and Shepard, 1984; Hapke and Reid, 2007b) found local cliff retreat rates as large as 100 cm yr−1. The large range of average long-term cliff retreat estimates results from differences in data quality, time period evaluated, cliff armoring, and study section. There is general agreement that cliff retreat is episodic in both space and time. Shepard and Wanless (1971) state “the coast is retreating, although very unevenly”, while Kennedy (1973) noted cliff retreat is “regionally negligible and locally high”.
2.4 Climate
San Diego’s semi-arid Mediterranean climate is character-ized by dry summers and occasionally wet winters, with 85% of rainfall from November through March. Annual precipitation amounts vary from about 10 to 60 cm, and average 25 cm. Rainfall during the study period was average or less, except for winter 2004 to 2005 (Interval 2), when rainfall exceeded twice the annual average (Fig. 4).
Jan-1-2000 Jan-1-2001 Jan-1-2002 Jan-1-2003 Jan-1-2004 Jan-1-2005 Jan-1-2006 Jan-1-2007 Jan-1-2008 Jan-1-2009
Da
ily Rainfall (cm
)
Mean Daily Hs (m
)
0 8
6
4 2 0 3.5
1.5 1.0 0.5 3.0 2.5 2.0
Time Interval
1 2 3 4 5 6 7
Mean C
lif
f
Retreat (cm)
16
0 12 8 4
Cumulative Rain
fa
ll (cm
)
0 80
60
40 20
Fig. 4. Top: mean section cliff retreat occurring during each
time interval. Center: mean daily significant wave height (Hs)
at a virtual buoy located seaward of the cliff section in 10 m water depth (monitoring and prediction point location (MOP), Fig. 1). Bottom: daily rainfall totals and cumulative daily rainfall during each interval (dotted line) at Cabrillo National Monument (http://www.wrh.noaa.gov/sgx/obs/rtp/cabrillo.html) located at the southern end of the study area. Gray bars indicate time periods between lidar surveys used in this study.
2.5 Waves
The seacliffs are exposed to swell from distant storms in both hemispheres and waves generated by local winds. During winter, swell from the North Pacific and the Gulf of Alaska are most energetic, whereas swell from the South Pacific dominates in summer. The seasonal cycle produces maximum wave energy in winter (Fig. 4). Wave conditions vary alongshore, and were estimated from a wave buoy network (CDIP, http://cdip.ucsd.edu) and a spectral refraction wave model that accounts for the effects of complex bathymetry in the southern California Bight, varying beach orientation, and wave exposure (O’Reilly and Guza, 1991, 1998). Mean daily significant wave height (Hs) at a virtual buoy or “Monitoring and Prediction point”
A. P. Young et al.: Cliff retreat statistics 209
2.6 Seismicity
Minor ground motions are relatively common in the tectonically active San Diego region. However, no earthquakes with magnitude>5.0 occurred within 100 km of the study site, during the study period (www.data.scec.org).
3 Methods
3.1 Lidar data collection
Eight airborne lidar surveys (Table 1) were conducted between October 2003 and March 2009 with an Optech Inc. Airborne Laser Terrain Mapper (ALTM) 1225. Each airborne survey consisted of 2 to 4 passes with a 40◦swath at an altitude ranging from 300 to 1150 m resulting in a point density of approximately 2 to 4 points m−2. The alongshore aircraft trajectory was located approximately 0 to 100 m seaward of the seacliffs. ALTM elevation points are computed using three sets of data: laser ranges and their associated scan angles, platform position and orientation information, and calibration data and mounting parameters (Wehr and Lohr, 1999). GPS receivers in the aircraft and on the ground at control points provide platform positioning. The GPS receivers record pseudo-range and phase information for post-processing. Platform orientation information comes from an Inertial Measurement Unit (IMU) containing three orthogonal accelerometers and gyroscopes. An aided-Inertial Navigation System (INS) solution for the aircraft’s attitude is estimated from the IMU output and the GPS information.
3.2 Digital elevation model
Lidar data was occasionally obtained in over-hanging locations such as seacaves and notches, however the partial coverage did not permit construction of fully 3-D terrain models, and volume statistics could not be estimated. Therefore, the point data were processed into 0.5 m resolution 2.5-D digital elevation models using the second of two returns (the most representative of the ground surface) and a modified “natural neighbors” interpolation that removes over-vertical features and maintains vertical cliff edges and complex topography (see Appendix A, LEM-DEM).
3.3 Change detection and cliff retreat
Vertical topographic change for the seven time intervals (Table 1), obtained by differencing successive digital elevations models to create digital change grids (DCG), shows erosion (negative changes) at failure locations, and accretion (positive changes) at cliff base talus deposits (Fig. 3). Sources of errors in the DCGs include the basic lidar observations, spatial interpolation, and vegetation. The
vertical root mean square difference between two surveys (RMSZ, Federal Geographic Data Committee, 1998), a
measure of the total error, was estimated using three control sections of stabilized slopes and seawalls that represent the range of slopes and vegetative conditions of the studied seacliffs. The average RMSZ of all control sections and
intervals was 18 cm, and ranged from 10 to 24 cm.
The DCGs were filtered and edited to remove noise and identify the individual failures causing seaward cliff edge retreat. First, all grid cells with a vertical change of less than 2 m (RMSZ) were removed. Next, a
minimum topographic footprint was imposed, requiring at least 12 connected cells of negative change, thus enforcing a minimum change area of 3 m2. The vertical and footprint thresholds, selected through trial and error and tested on the control surfaces, significantly reduced noise. Finally, the digital data footprints were visually inspected, yielding the topographic footprints of individual seaward cliff-edge failures during each time interval. The seaward cliff edge was used as the shoreline reference feature because cliff retreat is readily identifiable for landslides occurring in both profile types (Fig. 3). The seaward edge was coincident with the cliff top edge when the upper cliff slope was vertical (Fig. 3c). These interval changes could represent combined individual, adjacent landslides that occurred during a particular time interval.
3.4 Cliff failure parameters
Cliff failure footprints were sampled on local cross-shore oriented transects spaced 1.0 m alongshore (Fig. 5). The DCGs usually were not aligned with the local shoreline orientation, resulting in a range of retreat measurements (including values less than the grid size) rather than increments of the 0.5 m grid size. The alongshore failure length was defined as the number of transects intersecting the failure footprint. Mean failure retreat was estimated as the average of intersecting transects for each slide, while the maximum failure retreat represents the longest intersecting transect. The cliff footprint area was measured as the planimetric area on the DCGs. Note this method can result in small differences between the measured planimetric area, and area calculated as the product of alongshore failure length and mean failure retreat, but provides a simple automated way to estimate cliff failure attributes with locally changing shoreline orientation.
4 Results and discussion
4.1 Erosion at protected cliffs
Retreat at cliffs with riprap or seawalls was relatively minor, however at least two protected locations (P1 and P2, Fig. 1) experienced significant erosion. At P1 during Interval 2, a mid-cliff failure in the Point Loma Formation occurred
1.19 2.39
3.30 3.30 3.85 3.85 4.40 3.85 2.98
2.39 0.55
Local Shoreline Oreintation
Local Shoreline Perpendictular Retreat Transects (Length in meters) New Cliff Edge
1.0 m Spacing
0 2
Meters
Ü
Maximum FailureRetreat (4.40 m)
Alongshore Failue Length = 11.0 m (11 intersecting transects) Mean Failure Retreat = 2.92 m (average of intersecting transects) Maximum Failure Retreat = 4.40 m (longest intersecting transect)
Failure Area = 32.25 m (planimetric failure footprint area)2
Old Cliff Edge Cliff Failure Footprint
Fig. 5. Example of a cliff failure footprint, local shoreline perpendicular retreat transects, and estimated failure attributes and geometry.
Intersecting transects cross the failure footprint, determined on a 0.5 m grid. The old cliff edge (thick dashed gray/black line) and new cliff edge (thick solid black line) bound the cliff failure footprint.
between a rock revetment at the cliff base and an upper cliff retaining wall. Erosion (primarily of the terrace deposits) at location P2 occurred during Intervals 1 through 4 and 7, and involved a seawall failure with loss of residential property. These events (and others at protected cliffs) are excluded from further consideration because cliff protection significantly alters cliff failures.
4.2 Cliff failure footprint, geometry, correlations,
and probabilities
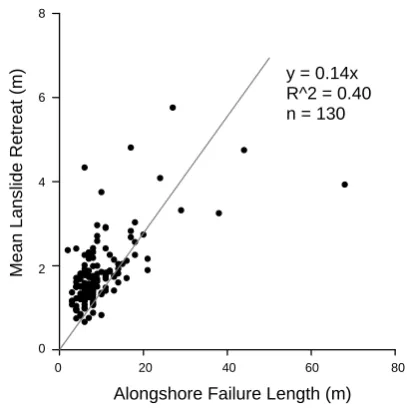
The 130 individual cliff edge failure footprints ranged in area from 3 to 268 m2with a mean of 22 m2(Appendix A, Table A1). Alongshore failure lengths ranged from 2 to 68 m with a mean of 10 m. The mean and maximum failure retreat measured perpendicular to the local shoreline orientation ranged from 0.7 to 5.8 m, and from 0.8 to 10.0 m, respectively. Although the alongshore failure length and mean retreat distance are correlated (mean retreat ∼0.14 length, Fig. 6), there is considerable variation in the length/retreat ratio, with the largest variation for large slides. For example, the largest mean retreats (between 3 and 6 m) have alongshore lengths varying by a factor of 17 (between 4 and 68 m). The shortest of slides with relatively large mean retreat (between 3 and 6 m) usually occurred in areas with relatively complex alongshore shape, whereas the longest slide was relatively straight alongshore. Geologic discontinuities (e.g. joints and faults) can exert strong control on cliff failure dimensions (Kogure and Matsukura, 2010), and likely affected the observed failure geometries.
20 40 60
0 80
Alongshore Failure Length (m)
4 8
6
2
Mean Lanslide Retreat (m)
0
y = 0.14x R^2 = 0.40 n = 130
Fig. 6. Mean failure retreat versus alongshore failure length for the
130 slides.
A. P. Young et al.: Cliff retreat statistics 211
Table 1. Interval information.
Interval 1 2 3 4 5 6 7 1–7
Start Date 25 Oct 2003 29 Sep 2004 19 Oct 2005 24 Mar 2006 28 Mar 2007 23 Nov 2007 28 Sep 2008 25 Oct 2003
End Date 29 Sep 2004 19 Oct 2005 24 Mar 2006 28 Mar 2007 23 Nov 2007 28 Sep 2008 8 Mar 2009 8 Mar 2009
Time Length (Days) 340 385 156 369 240 310 161 1961
Time Length (Years) 0.9 1.1 0.4 1.0 0.7 0.8 0.4 5.4
Mean Retreat (cm) 9.4 16.3 2.4 3.7 2.7 5.2 2.0 41.7
Mean Retreat Rate (cm yr−1) 10.0 15.4 5.7 3.6 4.1 6.1 4.5 7.8
Maximum Retreat (m) 10.0 7.1 5.8 5.9 4.8 6.0 3.7 10.0
Extent of Cliff Retreat (m) 248 473 98 155 78 155 81 1288/1153∗
Area Lost (m2) 655 1146 166 254 186 367 137 2910
Number of Landslides 24 42 13 21 8 14 8 130/102∗∗
∗1288 (sum of interval extent)/1153 (extent considering amalgamation over the combined intervals).
∗∗130 (sum of interval slides)/102 (slides considering amalgamation over the combined intervals).
" )
" ) ")
" ) " )
"
) ") ") ") ") ") ") ") ") ") ") ") ") ") ") ")") ") ") ") ") ") ") ") " ) !! !! ! !!!!!!! ! !!!!!!!!!!!!!!!! ! # #### # ### # ################### # ) ) ) )) ) ))))))))))))))))))))))) ) D DD D DDDDDDDDDDDDDDDDDDDDDDDDD D WW W WW WWWWWWWWWWWWWWWWWWWWWWWW W ( ( ( ( ((((((((((((((((((((((((( ( 0 6 4 2
(c
)
8Failure Area (m )
0 60 120 180 240 300
Interval 1 Interval 2 Interval 3 Interval 4 Interval 5 Interval 6 Interval 7 All Intervals " ) " )") " ) " )") " )")")
"
)")")")")")")")")")")")")")")")")")")")")")")")")")") ! ! !! ! !!!! !!!!!!!!! ! !!!!!!!!!!!!!!!!! # # # # #### # ##### # ##################### ) ) )) ) ) ))) ) )))))))))))))))))))))))))) D D D D D D D D D DDDDDDDDDDDDDDDDDDDDDDDDDDD W W WW WW W WW W W W
WWWWWWWWWWWWWWWWWWWWWWWW ( ( ( ( ( ( ( ( ( (((((((((((( ( (((((((((((((( 0 20 15 10 25 5 75 60 45 30 15 0
(b
)
Alongshore Failure Length (m)
( ( ( ( ( ( ( W W W
W W W
W D D
D
D D D
D ) ) ) ) ) ) ) # # # # # # # ! ! ! ! ! ! ! " ) " ) " ) "
) ") ")
" ) 0 80 60 40 100 20
(a
)
P e rc en t D e ns it y 6 4 2 0Mean Failure Retreat (m)
2 P e rc ent D e nsi ty P e rc ent D e nsi ty " ) " ) ")
" ) " )
"
) ") ") ") ") ") ") ") ") ") ") ") ") ") ") ")") ") ") ") ") ") ") ") " ) !! !! ! !!!!!!! ! !!!!!!!!!!!!!!!! ! # #### # ### # ################### # ) ) ) )) ) ))))))))))))))))))))))) ) D DD D DDDDDDDDDDDDDDDDDDDDDDDDD D WW W WW WWWWWWWWWWWWWWWWWWWWWWWW W ( ( ( ( (((( ( ((((((((((( ( (((((((( ( 0 6 4 2
(c
)
8Failure Area (m )
0 60 120 180 240 300
Interval 1 Interval 2 Interval 3 Interval 4 Interval 5 Interval 6 Interval 7 All Intervals " ) " )") " ) " )") " )")")
"
)")")")")")")")")")")")")")")")")")")")")")")")")")") ! ! !! ! !!!! !!!!!!!!! ! !!!!!!!!!!!!!!!!! # # # # #### # ##### # ##################### ) ) )) ) ) ))) ) )))))))))))))))))))))))))) D D D D D D D D D DDDDDDDDDDDDDDDDDDDDDDDDDDD W W WW WW W WW W W W
WWWWWWWWWWWWWWWWWWWWWWWW ( ( ( ( ( ( ( ( ( (((((((((((( ( (((((((((((((( 0 20 15 10 25 5 75 60 45 30 15 0
(b
)
Alongshore Failure Length (m)
( ( ( ( ( ( ( W W W
W W W
W D D
D
D D D
D ) ) ) ) ) ) ) # # # # # # # ! ! ! ! ! ! ! " ) " ) " ) "
) ") ")
" ) 0 80 60 40 100 20
(a
)
P e rc en t D e ns it y 6 4 2 0Mean Failure Retreat (m)
2 P e rc ent D e nsi ty P e rc ent D e nsi ty " ) " ) ")
" ) " )
"
) ") ") ") ") ") ") ") ") ") ") ") ") ") ") ")") ") ") ") ") ") ") ") " ) !! !! ! !!!!!!! ! !!!!!!!!!!!!!!!! ! # #### # ### # ################### # ) ) ) )) ) ))))))))))))))))))))))) ) D DD D DDDDDDDDDDDDDDDDDDDDDDDDD D WW W WW WWWWWWWWWWWWWWWWWWWWWWWW W ( ( ( ( ((((((((((((((((((((((((( ( 0 6 4 2
(c
)
8Failure Area (m )
0 60 120 180 240 300
Interval 1 Interval 2 Interval 3 Interval 4 Interval 5 Interval 6 Interval 7 All Intervals " ) " )") " ) " )") " )")")
"
)")")")")")")")")")")")")")")")")")")")")")")")")")") ! ! !! ! !!!! !!!!!!!!! ! !!!!!!!!!!!!!!!!! # # # # #### # ##### # ##################### ) ) )) ) ) ))) ) )))))))))))))))))))))))))) D D D D D D D D D DDDDDDDDDDDDDDDDDDDDDDDDDDD W W WW WW W WW W W W
WWWWWWWWWWWWWWWWWWWWWWWW ( ( ( ( ( ( ( ( ( (((((((((((( ( (((((((((((((( 0 20 15 10 25 5 75 60 45 30 15 0
(b
)
Alongshore Failure Length (m)
( ( ( ( ( ( ( W W W
W W W
W D D
D
D D D
D ) ) ) ) ) ) ) # # # # # # # ! ! ! ! ! ! ! " ) " ) " ) "
) ") ")
" ) 0 80 60 40 100 20
(a
)
P e rc en t D e ns it y 6 4 2 0Mean Failure Retreat (m)
2 P e rc ent D e nsi ty P e rc ent D e nsi ty
Fig. 7. Probability density of individual failures (a) mean retreat (% m−1), (b) alongshore length, (% m−1) and (c) area (% m−2) during each time interval, and averaged over all intervals (see legend).
Maximum Retreat for: x > 3 m y = 1289 x ^ (-2.951) R^2 = 0.988 n = 50
for: x > 10 m y = 1343 x ^ (-1.202) R^2 = 0.994 n = 78
Failure Area (m )
1 10 100 1000
1 10 100 1000
for: x > 6 m y = 3105 x ^ (-1.888) R^2 = 0.980 n = 84
1 10 100 1000
Alongshore Failure Length (m)
1 10 100 1000
1 10 100 1000 Cum u
lative Number Mean Retreat
for: x > 2 m y = 339.4 x ^ (-3.087) R^2 = 0.993 n = 38
Failure Retreat (m)
1 10 100
0.1
(c
)
(b
)
(a
)
2 2 Cumulative N umber C u mu la ti ve N u mb e r Maximum Retreat for: x > 3 m y = 1289 x ^ (-2.951) R^2 = 0.988 n = 50for: x > 10 m y = 1343 x ^ (-1.202) R^2 = 0.994 n = 78
Failure Area (m )
1 10 100 1000
1 10 100 1000
for: x > 6 m y = 3105 x ^ (-1.888) R^2 = 0.980 n = 84
1 10 100 1000
Alongshore Failure Length (m)
1 10 100 1000
1 10 100 1000 Cum u
lative Number Mean Retreat
for: x > 2 m y = 339.4 x ^ (-3.087) R^2 = 0.993 n = 38
Failure Retreat (m)
1 10 100
0.1
(c
)
(b
)
(a
)
2 2 Cumulative N umber C u mu la ti ve N u mb e r Maximum Retreat for: x > 3 m y = 1289 x ^ (-2.951) R^2 = 0.988 n = 50for: x > 10 m y = 1343 x ^ (-1.202) R^2 = 0.994 n = 78
Failure Area (m )
1 10 100 1000
1 10 100 1000
for: x > 6 m y = 3105 x ^ (-1.888) R^2 = 0.980 n = 84
1 10 100 1000
Alongshore Failure Length (m)
1 10 100 1000
1 10 100 1000 Cum u
lative Number Mean Retreat
for: x > 2 m y = 339.4 x ^ (-3.087) R^2 = 0.993 n = 38
Failure Retreat (m)
1 10 100
0.1
(c
)
(b
)
(a
)
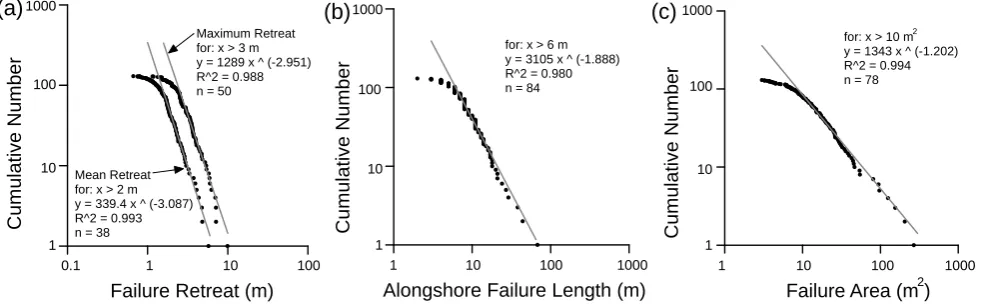
2 2 Cumulative N umber C u mu la ti ve N u mb e rFig. 8. Log of the cumulative number of failures versus log of (a) mean and maximum failure retreat, (b) alongshore length, and (c) area.
Probability density functions characterizing the calculated mean failure retreat (Fig. 7a), alongshore distance (Fig. 7b), and area (Fig. 7c) of individual slides are generally similar between intervals and are right skewed. The cumulative distributions of individual failure parameters; mean and maximum retreat (Fig. 8a), alongshore distance (Fig. 8b), and area (Fig. 8c), all fit well to inverse power-law distributions for relatively medium-large size events. The
scaling exponent of the cliff-edge failure area cumulative distribution (b=1.2, Fig. 8c), is similar to the b∼1.0 found by Marques (2008). Unimodal cliff failure probability density functions (Fig. 7), and power-law cumulative distributions for medium-large events were also reported by Dong and Guzzetti (2005) and Marques (2008). Small events were not reliably detected in these studies, and areas<3 m2 are excluded from the present statistics.
" )
" )
" )
" )
" )
" )
" )
" )
"
) ") ") ") ") ") ") ") ") ") ") ") "
)
! !
! !
!
! !
! ! ! !
!
! ! ! ! ! ! ! ! !
# #
# #
# # #
#
#
#
# # # # # # # # # # #
) )
) )
) ) )
) ) )
) )
) ) ) ) ) ) ) ) )
D D
D D
D
D D
D D
D D D D D D D D D D D D
W W
W W W
W
W
W
W W W W W W W
W W W W W W
( (
( (
( (
( (
( (
( (
( ( ( ( ( ( (
( (
0 2 4 6 8 10
0 60
40 80
10
Cliff Retreat (m)
Percent Density (%/m)
0 2 4 6 8 10
0 40
30
10 20
Cliff Retreat (m)
Percent Density (%/m)
Interval 1
All Intervals
Intervals
All Intervals
1-2 (Retreat Rates: 10-16 cm/yr) 3-7 (Retreat Rates: 3-6 cm/yr)
(a
)
(b
)
Cumulative Retreat
Percentage
(%)
C
Percentage
(%)
D
50
Interval 2
Interval 4 Interval 5 Interval 6 Interval 7 Interval 3
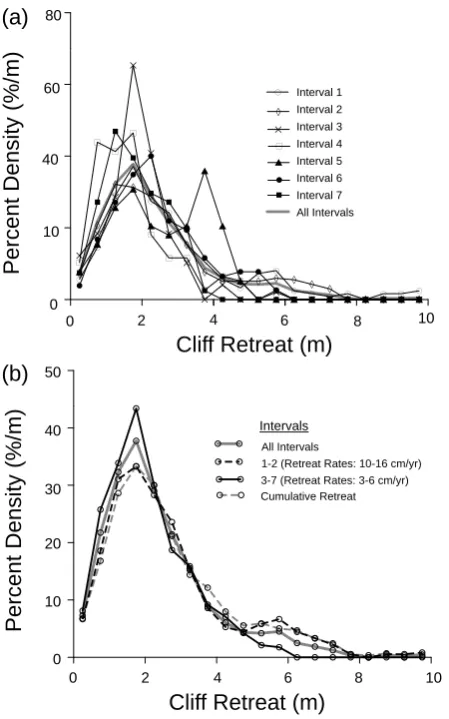
Fig. 9. Probability density functions of transect (a) cliff retreat
occurring during each time interval, and (b) combined time periods with relatively high (Intervals 1 and 2) and low retreat rates (Intervals 3 through 7). The probability density functions are based on 0.5 m intervals and plotted along the x-axis using the mid-interval location.
4.3 Footprint transect retreat measurements
The 130 individual cliff edge failures from all time intervals were sampled on transects spaced 1 m alongshore, resulting in approximately 1300 non-zero transects. Transect retreats ranged from 0.01 to 10 m, with a mean and median of 2.3 m and 2.0 m, respectively. The maximum cumulative cliff retreat at single location during the study period was 10 m (1.8 m yr−1). Approximately 84% of the cliff edge
experienced no detectable retreat over the study period based on the described methods.
The shapes of the retreat probability density functions for each time interval were similar, with a single peak ranging between 1 and 2.5 m (Fig. 9a), except for the bimodal Interval 5. The retreat events of combined large mean retreat intervals (1 and 2), small mean retreat intervals (3 through 7),
Exponential Fit for: x > 1 m
y = 2010 exp (-0.603 x) R^2 = 0.993
n = 1076
1 10 100 1000
Cum
m
u
lativ
e Nu
mb
er
10000
0.01
Transect Retreat (m)
1 10 100
0.1
Power Fit for: x > 4 m
y = 107,256 x ^ (-4.435) R^2 = 0.939
n = 166
Fig. 10. Log of cumulative number of transect retreats versus log of
transect retreat.
all-intervals, and cumulative retreat are all positive skewed with a peak around 2 m (Fig. 9b). However, the retreat distribution during large and small mean retreat intervals are significantly different (k-s test,p=0.000031, compare bold dashed with bold solid curve in Fig. 9b). During intervals of large mean section retreat, larger retreat events occur more often than expected compared to intervals with low mean section retreat. The converse is also true suggesting the distributions of cliff retreat may differ for time periods with varying amounts of overall failure activity.
The distributions of cumulative (e.g. total on transects) and average-all-interval retreat differ (Fig. 9b) because locations that retreat more than once are amalgamated into a single value in the cumulative distribution. The cumulative distribution of all individual retreat measurements (Fig. 10) fits better to an exponential distribution rather than a law, particularly for medium size events where the power-law fit deviates for values >4 m. A single failure affects multiple adjacent transect retreat measurements, and the non-independence of transects probably contributed to power law deviation, along with amalgamation and under sampling of small areas.
4.4 Mean interval cliff retreat
A. P. Young et al.: Cliff retreat statistics 213
20 30 40
10
0 50
Number of Failures
0.10 0.20
0.15
0.05
Mean
Sectio
n Retrea
t (m)
0
y = 0.344 x R^2 = 0.865 n = 7
Fig. 11. Mean retreat (over the unprotected cliffs) versus the number of failures during each time interval.
If the size distribution of retreats were constant from interval to interval, then the mean retreat and number of failures in the interval would be linearly related, as was only approximately observed (Fig. 11). Mean retreat values in Intervals 1 and 2 were elevated above the best fit line because large slides occur disproportionally more often in the intervals with the most slides (Fig. 11).
4.5 Spatial distribution of cliff retreat
Retreat occurred along less than 3% of the cliff length in all intervals except Interval 2, when 7% of the section retreated. In total, about 1150 m of the unprotected cliffs experienced measurable cliff retreat during the study period. Forty eight of the failure footprints were spatially adjacent to at least one other failure resulting in 20 amalgamated footprints and 135 m of cliff retreating more than once.
The potential presence of short-term cliff retreat hot spots (Young et al., 2009a) was investigated with a simple Monte Carlo simulation of cliff retreat for the study period. The simulated cliff retreat for each time interval used the observed interval failure events and random spatial placement along the 7.1 km (unprotected) cliff section.
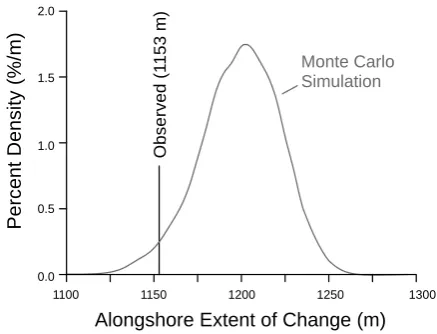
The random spatial placement of the Monte Carlo simulation over-predicted the maximum cumulative cliff retreat by 6 m (Fig. 12), and the observed alongshore extent of cliff retreat was about 50 m smaller than the Monte Carlo mean (Fig. 13). The differences between the Monte Carlo simulation and observations are consistant with cliff retreat history at a particular location influencing subsequent cliff retreat. For example, the simulated alongshore extent of failures can be made to match the observations by forcing some small to moderate failures to coincide with previous events, creating non-random, short-term hot spots. Small failure events could redistribute stress to nearby locations causing strain accumulation and concentrating future failures
Observed
% E
xceedence (Log S
cale)
Cliff Retreat (m)
Cumulative Cliff Retreat October 2003 to March 2009
0.01 0.1 100
10
1
0 5 10 15
Monte Carlo Simulation
20
Fig. 12. Observed and Monte Carlo simulation (100 realizations)
of % exceedence of cumulative transect cliff retreat. The most common cumulative retreat is zero. The observed and modeled cumulative retreat distributions differ for large, infrequent events, but the distributions are overall only marginally different (k-s test, p=0.21).
1100 1150 1200 1250 1300
Alongshore Extent of Change (m)
2.0
1.5
1.0
0.5
0.0
Perc
ent D
e
nsity (%
/m
)
Obse
rved (1
153 m) Monte Carlo Simulation
Fig. 13. Probability density function of alongshore extent of change
based on a Monte Carlo simulation of random placement (solid curve). Only about 3% of the realizations had alongshore change extents less than or equal to the observed 1153 m, suggesting observed failures tended to reoccur at some locations.
in both space and time. That is, the observed failures may be part of a progressive failure (Bjerrum, 1967; Bishop, 1971; Petley et al., 2005), or sequence of successive coastal failures (e.g. Hutchison, 1969; Brunsden and Jones, 1976; Alveirinho Dias and Neal, 1992; Collins and Sitar, 2008; Young et al., 2009a) where an intial failure may result in adjacent unstable rock masses (Chowdhury et al., 2010). Rosser et al. (2007) suggested that small failures preceded larger events at the same and nearby locations. Lim et al. (2010) emphasized that
sequential failures are a “connected process“, and stressed the importance of including non-random events in coastal cliff erosion models. The random simulation over-prediction of maximum cumulative retreat suggests that a large failure is relatively unlikely to be followed by more large failures at the same location over short time periods. All locations that retreated at least 6.9 m during one time interval did not retreat in any other interval. Longer data sets are required to test these preliminary suggestions.
4.6 Temporal distribution of cliff retreat
Relationships between erosional processes or failure trigger-ing events (waves, rainfall, and seismicity) and cliff retreat could not be established statistically. Although the most cliff retreat and rainfall both were in Interval 2, the second largest amount of retreat occurred during time Interval 1, when rainfall was relatively light (Table 1, Fig. 4). The retreat in Interval 1 might have resulted from wave action, however Intervals 4, 6, and 7, had similar wave conditions with relatively little cliff retreat. Heavy rainfall in Interval 2 might have triggered failures that would have otherwise occurred from wave action in subsequent time intervals, resulting in abnormally large cliff retreat during Interval 2 and low retreat afterwards. Longer data sets are required to confirm the suggestion that, in these slowly retreating cliffs, non-random failure sequences serve to decouple failures from local environmental forcing. In the comparatively softer, more erosive cliffs in northern San Diego County, cliff erosion and rainfall in the study period were well correlated (Young et al., 2009b).
5 Summary
This cliff failure inventory provides the basic statistics of cliff edge retreat caused by medium and large size planimetric cliff changes along 7.1 km of unprotected rocky coastal cliffs over 5.5 years. Footprint areas of the 130 individual cliff edge failures ranged between 3 and 268 m2. On this short (5.5 yearr) time scale, “no change” was the most common observation (84% of the cliff edge). Probability distributions of non-zero cliff retreat during each time interval usually had a single peak between 1 and 2.5 m. Intervals with high mean retreat had elevated numbers of failure in all class sizes, and also contained the largest individual retreats. Small and medium failures tended to reoccur preferentially (relative to randomly) near previous small and medium failures, forming short-term hot spots. Large failures were less likely than random to reoccur near previous large failures, but longer records are needed to confirm this statistically tentative result. Cumulative distributions of failure parameters (area, retreat, and length) follow an inverse power-law for medium to large size events and roll off for (poorly sampled) small events, similar to previously reported distributions of coastal and inland mass movements.
(c) TIN Layer > 4 m
(a) TIN - All Points (b) Base DEM
(d) LEM - DEM
Elevation (m) 0 36
Ü
0 20 40
Meters
Fig. A1. Example of the “Layered Elevation Mosaic” – Digital
Elevation Model (LEM-DEM) technique. (a) Initial TIN created from all points and the associated DEM (b), showing how points collected in seacaves and notches produce pits and a jagged, incorrect cliff edge. (c) A TIN layer produced from points greater than 4 m in elevation, showing the removal of seacave and notch points. (d) The final LEM-DEM which has eliminated the over vertical surfaces while maintaining the complex cliff topography and a well-defined cliff edge.
Appendix A
LEM-DEM
A. P. Young et al.: Cliff retreat statistics 215 between each DEM. Lastly, the final LEM-DEM (Fig. A1d)
was produced by selecting the maximum grid cell elevation from all the DEM layers.
Table A1. Landslide attributes.
Time Area Along- Mean Max UTM UTM
Interval shore Transect Transect Northing Easting
Length Retreat Retreat
(m2) (m) (m) (m)
1 80.75 17.00 4.81 6.26 3 621 773 475 949
1 8.25 6.00 1.39 2.46 3 620 899 475 815
1 18.5 8.00 2.42 3.94 3 620 832 475 828
1 18.5 11.00 1.73 2.74 3 620 120 475 980
1 20 11.00 1.83 2.68 3 620 109 475 985
1 15.25 8.00 1.99 3.02 3 619 375 475 995
1 17.25 8.00 2.19 3.36 3 619 198 476 046
1 10 6.00 1.86 2.78 3 617 575 476 211
1 11 7.00 1.57 2.50 3 617 430 476 287
1 11 8.00 1.38 1.50 3 617 421 476 287
1 26.25 11.00 2.41 4.00 3 617 112 476 367
1 15 7.00 2.17 3.57 3 616 717 476 552
1 205.5 44.00 4.75 9.94 3 616 625 476 531
1 26 12.00 2.26 3.41 3 616 150 476 696
1 8.75 7.00 1.31 2.02 3 616 081 476 737
1 29.5 14.00 2.04 3.54 3 615 501 476 868
1 19.5 8.00 2.32 3.73 3 615 281 476 886
1 35.75 10.00 3.75 5.22 3 615 203 476 940
1 7 6.00 1.17 1.71 3 615 153 476 991
1 16.75 11.00 1.48 2.11 3 614 866 477 026
1 6.5 4.00 1.49 2.55 3 614 425 477 038
1 10 4.00 2.41 3.73 3 615 279 476 893
1 22.75 13.00 1.75 3.03 3 622 296 476 107
1 15.25 7.00 2.31 3.35 3 615 148 476 995
2 15 7.00 2.21 3.53 3 621 382 475 955
2 34.5 16.00 2.12 3.07 3 621 219 476 017
2 4.25 3.00 1.37 1.54 3 617 366 476 311
2 6.25 6.00 1.08 2.32 3 617 346 476 305
2 3.75 3.00 1.15 1.77 3 617 194 476 309
2 11.75 8.00 1.72 2.34 3 617 193 476 313
2 32.25 11.00 2.92 4.40 3 614 656 477 024
2 3.25 4.00 0.75 1.19 3 615 991 476 687
2 14 8.00 1.76 2.37 3 621 903 476 018
2 6 7.00 0.76 1.15 3 619 217 476 037
2 13 8.00 1.56 2.25 3 618 706 476 052
2 23 12.00 1.88 2.53 3 618 347 476 090
2 19 11.00 1.78 3.02 3 618 328 476 099
2 22.25 14.00 1.60 3.61 3 617 505 476 200
2 16.75 11.00 1.69 4.08 3 617 097 476 400
2 39.75 21.00 1.90 3.66 3 616 842 476 569
2 7 4.00 1.61 2.34 3 615 232 476 960
2 9.5 7.00 1.25 1.88 3 615 227 476 953
2 8 6.00 1.26 2.96 3 614 659 477 013
2 17.75 13.00 1.41 2.30 3 618 233 476 089
2 19.75 11.00 1.82 2.75 3 615 492 476 866
2 12.25 9.00 1.50 2.59 3 614 579 477 056
2 6 4.00 1.71 2.56 3 619 631 475 982
2 268.25 68.00 3.93 7.13 3 617 464 476 268
2 44.5 21.00 2.16 4.73 3 615 213 477 001
2 9 6.00 1.77 3.50 3 614 801 477 014
2 20.75 9.00 2.59 3.76 3 614 587 477 058
2 11.75 6.00 2.01 3.67 3 614 500 477 048
2 13.5 9.00 1.63 3.03 3 619 646 475 978
2 7.25 6.00 1.17 1.50 3 619 223 476 034
2 155 27.00 5.76 7.14 3 621 898 476 009
2 97 24.00 4.08 7.00 3 621 479 475 941
2 9.5 8.00 1.13 2.00 3 621 404 475 927
2 13 6.00 2.25 2.63 3 620 826 475 838
2 10 6.00 1.59 2.41 3 620 653 475 875
2 4.5 2.00 2.37 2.63 3 619 522 475 989
2 21.5 12.00 1.86 3.61 3 619 336 476 003
2 15 9.00 1.69 2.53 3 619 189 476 052
2 28.75 13.00 2.14 3.41 3 619 180 476 057
2 17.25 10.00 1.85 2.99 3 619 129 476 068
2 9 10.00 0.83 1.51 3 618 989 476 076
2 45.5 17.00 2.68 4.51 3 618 492 476 061
3 7.25 5.00 1.68 2.52 3 618 459 476 046
3 6.25 6.00 1.01 1.99 3 618 436 476 063
3 4.5 4.00 1.22 1.78 3 618 262 476 098
3 6.25 5.00 1.20 2.64 3 618 248 476 090
3 8.75 5.00 1.81 2.38 3 617 471 476 229
3 6.25 5.00 1.27 1.94 3 617 467 476 265
3 11 8.00 1.56 2.50 3 617 239 476 295
3 21.75 13.00 1.74 2.64 3 617 165 476 328
3 12 7.00 1.73 2.45 3 617 115 476 366
3 7.75 6.00 1.43 2.01 3 617 073 476 405
3 26.25 9.00 2.96 5.79 3 616 914 476 517
3 9.5 7.00 1.43 2.17 3 616 689 476 549
3 38.25 18.00 2.26 3.16 3 616 328 476 599
4 4.5 6.00 0.66 0.79 3 616 169 476 678
4 9 5.00 1.76 2.53 3 616 161 476 688
4 8 5.00 1.75 2.38 3 616 158 476 693
4 54 20.00 2.74 4.74 3 616 078 476 739
4 14.5 9.00 1.81 2.64 3 615 980 476 733
4 12.75 8.00 1.71 3.16 3 615 477 476 856
4 13.5 10.00 1.35 2.50 3 615 216 476 987
4 3.75 4.00 0.94 1.69 3 615 143 476 998
4 15 7.00 2.31 3.46 3 614 897 477 011
4 3.5 4.00 0.97 1.72 3 614 652 477 025
4 7.5 8.00 0.88 2.01 3 614 426 477 042
4 8.5 8.00 1.09 1.88 3 622 302 476 107
4 14.25 10.00 1.32 2.63 3 622 286 476 112
4 12 8.00 1.68 3.20 3 616 142 476 700
4 6.75 5.00 1.51 2.21 3 615 042 476 995
4 11.5 8.00 1.42 2.54 3 617 289 476 308
4 5.25 4.00 1.50 2.01 3 615 198 477 013
4 24.5 6.00 4.34 5.93 3 621 637 475 947
4 4 5.00 0.85 1.64 3 621 631 475 943
4 4.25 4.00 1.04 1.56 3 621 203 476 024
4 16.5 11.00 1.40 3.25 3 619 591 475 978
5 9.75 8.00 1.24 2.11 3 618 382 476 072
5 94.5 29.00 3.32 4.82 3 616 983 476 486
5 54.5 18.00 3.03 4.01 3 616 091 476 734
5 8.25 6.00 1.27 1.89 3 615 208 476 977
5 5 5.00 1.50 3.00 3 615 044 476 995
5 7.25 4.00 1.50 2.00 3 614 885 477 010
5 3.75 5.00 0.81 1.45 3 614 422 477 043
5 3.25 3.00 1.08 1.52 3 614 604 477 056
6 31.25 15.00 2.04 4.31 3 619 220 476 033
6 46.5 17.00 2.83 5.38 3 621 899 476 006
6 17.25 9.00 2.00 3.00 3 620 624 475 899
6 8.5 6.00 1.53 2.72 3 620 215 475 932
6 125.25 38.00 3.25 5.99 3 619 771 476 019
6 13.25 7.00 1.88 2.61 3 619 188 476 055
6 6.25 6.00 0.98 1.77 3 618 732 476 053
6 11.25 6.00 1.92 2.00 3 618 307 476 106
6 25.25 14.00 1.82 2.57 3 618 255 476 092
6 25 9.00 2.71 4.05 3 617 805 476 159
6 10.5 7.00 1.50 2.12 3 617 556 476 216
6 13 7.00 1.77 2.53 3 617 300 476 307
6 30.25 11.00 2.90 5.43 3 616 411 476 588
6 3 3.00 1.17 1.50 3 616 387 476 600
7 28 16.00 1.70 2.52 3 616 061 476 739
7 6.75 5.00 1.34 2.70 3 616 058 476 733
7 42.75 18.00 2.56 3.65 3 614 797 477 010
7 26 14.00 1.93 3.39 3 614 659 477 017
7 10.25 8.00 1.19 1.50 3 614 436 477 038
7 8.75 8.00 1.06 1.50 3 614 393 477 056
7 10.25 8.00 1.31 2.25 3 621 763 475 952
7 4 4.00 0.97 1.34 3 615 484 476 865
Acknowledgements. Lidar surveys were sponsored by the U.S.
Army Corps of Engineers as part of the Southern California
Beach Processes Study. Wave data collection was sponsored
by the California Department of Boating and Waterways, and the U.S. Army Corps of Engineers, as part of the Coastal Data Information Program (CDIP). APY received Post-Doctoral Scholar support from the California Department of Boating and Waterways
Oceanography Program. Portions of this work were conducted
in collaboration with SPAWAR Systems Center Pacific under grant #SI-1703 from the Strategic Environmental Research and Development Program (SERDP).
Here we also thank F. Marques and R. Calvo for reviews that significantly improved the manuscript.
Edited by: O. Katz
Reviewed by: F. Marques and R. Calvo
References
Alveirinho Dias, J. M. and Neal, W. J.: Sea cliff retreat in southern Portugal: profiles, processes and problems, J. Coastal Res., 8, 641–654, 1992.
Benumof, B. T. and Griggs, G. B.: The dependence of seacliff erosion rates, cliff material properties, and physical processes: San Diego County, California, Shore & Beach, 67(4), 29–41, 1999.
Benumof, B. T., Storlazzi, C. D., Seymour, R. J., and Griggs, G. B.: The relationship between incident wave energy and seacliff erosion rates: San Diego County, California, J. Coastal Res., 16(4), 1162–1178, 2000.
Bishop, A. W.: The infuence of progressive failure on the method of stability analysis, Geotechnique, 21, 168–172, 1971. Bjerrum, L.: Progressive failure of slopes of over consolidated
plastic clay and clay shales, in: Proceedings American Society Civil Engineers, Soc. Civ. Eng., Journal of Soil Mechanics and Foundations Division, 93, 1–49, 1967.
Brardinoni, F. and Church, M.: Representing the landslide
magnitude-frequency relation: Capilano River basin, British Columbia, Earth Surf. Proc. Land., 29(1), 115–124, 2004.
Brunetti, M. T., Guzzetti, F., and Rossi, M.: Probability
distributions of landslide volumes, Nonlin. Processes Geophys., 16, 179–188, doi:10.5194/npg-16-179-2009, 2009.
Brunsden, D. and Jones, D. K. C.: The evolution of landslide slopes in Dorset, Philos. T. R. Soc. A, 283, 605–631, 1976.
Budetta, P.: Stability of an undercut sea-cliff along a Cilento coastal stretch (Campania, Southern Italy), Nat. Hazards, in press, doi:10.1007/s11069-010-9565-y, 2010.
Cambers, G.: Temporal scales in coastal erosion systems, T. I. Brit. Geogr., 1(2), 246–256, 1976.
Chowdhury, R., Flentje, P., and Bhattacharya, G.: Geotechnical Slope Analysis, CRC Press/Balkema, Leiden, The Netherlands, 737 pp., 2010.
Collins, B. D. and Sitar, N.: Processes of coastal bluff
erosion in weakly lithified sands, Pacifica, California, USA, Geomorphology, 97, 483–501, 2008.
Dai, F. C. and Lee, C. F.: Frequency-volume relation and prediction of rainfall-induced landslides, Eng. Geol., 59, 253–266, 2001. Dong, P. and Guzzetti, F.: Frequency-size statistics of coastal
soft-cliff erosion, J. Waterw. Port C.-ASCE, 131(1), 37–42, 2005. Dussauge-Peisser, C., Helmstetter, A., Grasso, J.-R., Hantz, D.,
Desvarreux, P., Jeannin, M., and Giraud, A.: Probabilistic approach to rock fall hazard assessment: potential of historical data analysis, Nat. Hazards Earth Syst. Sci., 2, 15–26, doi:10.5194/nhess-2-15-2002, 2002.
Emery, K. O. and Kuhn, G. G.: Sea cliffs: their processes, profiles, and classification, Geol. Soc. Am. Bull., 93, 644–654, 1982.
Federal Geographic Data Committee: Geospatial positioning
accuracy standards, FGDC-STD-007.3-1998, 28 pp., 1998. Flick, R. E.: Shoreline Erosion Assessment and Atlas of the San
Diego Region, 2 volumes, Sacramento, California: California Department of Boating and Waterways, 1994.
Flick, R. E.: Dana Point to the international border, in: Living with the Changing California Coast, edited by: Griggs, G., Patsch, K., and Savoy, L., University of California Press, Berkeley and Los Angeles, California, 474–514, 2005.
Furlan, C.: Hierarchical random effect models for coastal erosion of cliffs in the Holderness coast, Stat. Method. Appl., 17, 335–350, 2008.
Guzzetti, F., Malamud, B. D., Turcotte, D. L., and Reichenbach, P.: Power-law correlations of landslide areas in central Italy, Earth Planet. Sc. Lett., 195, 169–183, 2002.
Hall, J. W., Meadowcroft, I. C., Lee, E. M., and Van Gelder, P. H. A. J. M.: Stochastic simulation of episodic soft cliff recession, Coast. Eng., 46, 159–174, 2002.
Hampton, M. A.: Gravitational failure of sea cliffs in weakly lithified sediment, Environ. Eng. Geosci., 8(3), 175–191, 2002. Hapke, C. J. and Reid, D.: socal transects.shp – Cliff Erosion
Rates for Southern California Generated at a 20 m Transect Spacing, 1928–1998: Open-File Report 2007-1112, Coastal and Marine Geology Program, U.S. Geological Survey, Pacific Science Center, Santa Cruz, California, 2007a.
Hapke, C. J. and Reid, D.: National Assessment of Shoreline
Change, Part 4: Historical Coastal Cliff Retreat along the
California Coast: U.S. Geological Survey Open-file Report
2007-1133, 2007b.
Hergarten, S.: Landslides, sandpiles, and self-organized criticality, Nat. Hazards Earth Syst. Sci., 3, 505–514, doi:10.5194/nhess-3-505-2003, 2003.
A. P. Young et al.: Cliff retreat statistics 217
Hutchinson, J. N.: A reconsideration of the coastal landslides at Folkestone Warren, Kent, Geotechnique, 19, 6–38, 1969. Kennedy, M. P.: Sea-cliff erosion at Sunset Cliffs, San Diego,
California Geology, 27–31, February 1973.
Kennedy, M. P.: Geology of the San Diego metropolitan area, western area, California Division of Mines and Geology Bulletin, 200, 56 pp., 1975.
Kogure, T., Aoki, H., Maekado, A., Hirose, T., and Matsukura, Y.: Effect of the development of notches and tension cracks on instability of limestone coastal cliffs in the Ryukyus, Japan, Geomorphology, 80(3–4), 236–244, 2006.
Kogure, T. and Matsukura, Y.: Critical notch depths for failures of coastal limestone cliffs: case study at Kuro-shima Island,
Okinawa, Japan, available at: http://dx.doi.org/10.1002/esp.
1940, Earth Surf. Proc. Land., 35(9), 1044–1056, 2010. Kuhn, G. G. and Shepard, F. P.: Sea Cliffs, Beaches, and Coastal
Valleys of San Diego County: Some Amazing Histories and Some Horrifying Implications, Berkeley, California, University of California Press, 193 pp., 1984.
Lee, E. M., Hall, J. W., and Meadowcroft, I. C.: Coastal
cliff recession: the use of probabilistic prediction methods, Geomorphology, 40, 253–269, 2001.
Lee, E. M., Meadowcroft, I. C., Hall, J. W., and Walkden, M.: Coastal landslide activity: a probabilistic simulation model, B. Eng. Geol. Environ., 61, 347–355, 2002.
Lim, M., Rosser, N. J., Allison, R. J., and Petley, D. N.: Erosional processes in the hard rock coastal cliffs at Staithes, North Yorkshire, Geomorphology, 114, 12–21, 2010.
Malamud, B. D., Turcotte, D. L., Guzzetti, F., and Reichenbach P.: Landslide inventories and their statistical properties, Earth Surf. Proc. Land., 29, 687–711, 2004.
Marques, F. M. S. F.: Magnitude-frequency of sea cliff instabilities, Nat. Hazards Earth Syst. Sci., 8, 1161–1171, doi:10.5194/nhess-8-1161-2008, 2008.
Milheiro-Oliveira, P.: Bayesian statistical methods for modeling and prediction of major landslides in coastal cliffs, Coast. Eng. J., 49(1), 45–61, 2007.
Moore, L. J. and Griggs, G. B.: Long-term cliff retreat and erosion hotspots along the central shores of the Monterey Bay National Marine Sanctuary, Mar. Geol., 181, 265–283, 2002.
Moore, L. J., Benumof, B. T., and Griggs, G. B.: Coastal erosion hazards in Santa Cruz and San Diego Counties, California, in: Crowell, M. and Leatherman, S. P., Coastal Erosion Mapping and Management, J. Coastal Res., SI 28, 121–139, 1999. O’Reilly, W. C. and Guza, R. T: Comparison of spectral refraction
and refraction-diffraction wave models, J. Waterw. Port C.-ASCE, 117, 199–215, 1991.
O’Reilly, W. C. and Guza, R. T.: Assimilating Coastal Wave Observations in Regional Swell Predictions, Part I: Inverse Methods, J. Phys. Oceanogr., 28, 679–691, 1998.
Pelletier, J. D., Malamud, B. D., Blodgett, T., and Turcotte, D. L.: Scale-invariance of soil moisture variability and its implications for the frequency-size distribution of landslides, Eng. Geol., 48, 255–268, 1997.
Petley, D. N., Higuchi, T., Petley, D. J., Bulmer, M. H., and Carey, J.: The development of progressive landslide failure in cohesive materials, Geology, 33(3), 201–204, 2005.
Quinn, J. D., Phillip, L. K., and Murphy, W.: Understanding the recession of the Holderness Coast, east Yorkshire, UK: a new presentation of temporal and spatial patterns, Q. J. Eng. Geol. Hydroge., 42, 165–178, 2009.
Rosser, N., Lim, M., Petley, D., Dunning, S., and Allison, R.: Patterns of precursory rockfall prior to slope failure, J. Geophys. Res., 112, F04014, doi:10.1029/2006JF000642, 2007.
Shepard, F. P. and Grant IV, U. S.: Wave erosion along the southern California coast, Bull. Geol. Soc. Am., 58, 919–926, 1947. Shepard, F. P. and Wanless, H. R.: Our Changing Coastlines,
McGraw-Hill Inc. New York, New York, 579 pp., 1971. Spaulding, G. A. and Crampton, W. F.: Pump station 35: assessing
coastal bluff stability – a geomorphic perspective, in: Coastal Processes and Engineering Geology of San Diego, California, edited by: Stroh, R. C., San Diego Association of Geologists, 75–91, 2001.
Stark, C. P. and Hovius, N.: The characterization of landslide size distributions, Geophys. Res. Lett., 28(6), 1091–1094, 2001. Sunamura, T.: Geomorphology of Rocky Coasts, John Wiley,
Hoboken, N. J., 302 pp., 1992.
Teixeira, S. B.: Slope mass movements on rocky sea-cliffs: a power-law distributed natural hazard on the Barlavento Coast, Algarve, Portugal, Cont. Shelf Res., 26, 1077–1091, 2006.
ten Brink, U. S., Barkan, R., Andews, B. D., and Chaytor, J. D.: Size distributions and failure initiation of submarine and subaerial landslides, Earth Planet. Sc. Lett., 287, 31–42, 2009.
Trenhaile, A. S.: The Geomorphology of Rock Coasts, Oxford Univeristy Press, Oxford, UK, 384 pp., 1987.
Varnes, D. J.: Slope movement types and processes, in: Landslides, analysis and control, edited by: Schuster, R. L. and Krizek, R. J., National Academy of Sciences Transportation Research Board, Sp. Rep. No. 176, 11–33, 1978.
Wehr, A. and Lohr, U.: Airborne laser scanning – an introduction and overview, ISPRS J. Photogramm., 54(2–3), 68–82, 1999. Williams, B. M., Lu, C. C., and Qin, W.: Coastal bluff erosion –
numerical model using Monte Carlo simulation technique and Sunamura’s equation, Shore & Beach, 72(3), 3–9, 2004. Young, A. P. and Ashford, S. A.: Instability investigation of
cantilevered seacliffs, Earth Surf. Proc. Land., 33, 1661–1677, 2008.
Young, A. P., Flick, R. E., Gutierrez, R., and Guza, R. T.: Comparison of short-term seacliff retreat measurement methods in Del Mar, California, Geomorphology, 112, 318–323, 2009a. Young, A. P., Guza, R. T., Flick, R. E., O’Reilly, W. C., and
Gutierrez, R.: Rain, waves, and the short-term evolution of composite seacliffs in southern California, Mar. Geol., 267, 1– 7, 2009b.