Receipt of Health Care Transition Counseling in the
National Survey of Adult Transition and Health
WHAT’S KNOWN ON THIS SUBJECT: Successful transition from pediatric to adult-centered health care requires structured counseling for youth from their health care providers.
WHAT THIS STUDY ADDS: In a national survey of young adults, we found that many do not report receiving anticipatory guidance regarding transition to adult care. Improved communication with health care providers is associated with receipt of more
guidance regarding health care transition.
abstract
OBJECTIVE:The goal of this study was to examine factors associated with receiving health care transition counseling services as reported by young adults.
METHODS:We analyzed data from the 2007 Survey of Adult Transition and Health, a nationwide survey of young adults aged 19 to 23 years conducted by the National Center for Health Statistics, to explore self-reported receipt of services to support transition from pediatric to adult health care. Multivariate logistic regression was used to identify whether sociodemographic characteristics, health status, or markers of provider-youth health communication were associated with the re-ceipt of 3 key transition counseling services.
RESULTS:Among the 1865 Survey of Adult Transition and Health re-spondents, 55% reported that their physicians or other health care providers had discussed how their needs would change with age, 53% reported that their physicians or other health care providers had dis-cussed how to obtain health insurance as an adult, and 62% reported having participated in a transition plan in school. Only 24% reported receiving all 3 transition counseling services. In multivariate logistic regression analyses, although gender, age, and race were not associ-ated with increased receipt of the transition-relassoci-ated outcomes, mark-ers of strong communication with the health system were associated with increased rates of receiving transition guidance.
CONCLUSIONS:Many young adults reported not having received health care transition counseling. Provider-youth communication was associated with increased health care transition guidance, and sug-gests that a medical home model that promotes anticipatory guidance for health care transition could promote improvements in the transi-tion process.Pediatrics2011;128:e521–e529
AUTHORS:Gregory S. Sawicki, MD, MPH,aRuth Whitworth,
MBA,bLaura Gunn, PhD,bRyan Butterfield, DrPH,cKatryne
Lukens-Bull, MPH,cand David Wood, MD, MPHc,d
aDivision of Respiratory Diseases, Children’s Hospital Boston,
Harvard Medical School, Boston, Massachusetts;bKarl E. Peace
Center for Biostatistics, Jiann-Ping Hsu College of Public Health, Georgia Southern University, Statesboro, Georgia;cCenter for
Health Equity and Quality Research, anddDepartment of
Pediatrics, University of Florida, College of Medicine–Jacksonville, Jacksonville, Florida
KEY WORDS
health care transition, anticipatory guidance, special health care needs
ABBREVIATIONS
YSHCN—youth with special health care needs HCT—health care transition
NS-CSHCN—National Survey of Children with Special Health Care Needs
SATH—Survey of Adult Transition and Health SHCN—special health care need
OR—odds ratio CI—confidence interval
Drs Sawicki and Wood were responsible for study design, data analysis, preparation and revision of the manuscript; Ms Lukens-Bull was responsible for study design, data acquisition, and revision of the manuscript; and Ms Whitworth, Dr Butterfield, and Dr Gunn were responsible for data analysis, and preparation and revision of the manuscript.
www.pediatrics.org/cgi/doi/10.1542/peds.2010-3017 doi:10.1542/peds.2010-3017
Accepted for publication May 13, 2011
Address correspondence to Gregory S. Sawicki, MD, MPH, Division of Respiratory Diseases, Children’s Hospital Boston, 300 Longwood Ave, Boston, MA 02115. E-mail: gregory.sawicki @childrens.harvard.edu
PEDIATRICS (ISSN Numbers: Print, 0031-4005; Online, 1098-4275). Copyright © 2011 by the American Academy of Pediatrics
Over the past several decades, many more youth with special health care needs (YSHCN) are surviving well into adulthood.1,2 As a result, services to
support health care transition (HCT) to adult-oriented health care are increas-ingly critical.3,4 Individual,
disease-specific, health system, and health insurance–related factors may facili-tate or impede provision of adequate services to youth before and during HCT. This transition should start in early adolescence and involves individ-ualized planning and ongoing skills de-velopment.5However, for many youth,
HCT is disorganized because of many different factors, including lack of transition counseling by pediatric pro-viders, developmental challenges of the youth themselves, lack of social supports, poor communication and co-ordination of care between pediatric and adult health care systems, and gaps in insurance at the age of transi-tion.3Youth may be precipitously
dis-charged out of pediatric care without appropriate follow-up5,6 or they may
transfer from pediatric-centered health systems without the skills and knowledge needed to succeed in an adult-oriented system.
Receipt of anticipatory guidance re-garding transition has been linked to improved health outcomes. For exam-ple, counseling led to improved adher-ence with appointments for young peo-ple with juvenile idiopathic arthritis7
and improved adherence and disease control in young adults with diabe-tes.8–10A composite of 4 aspects of
an-ticipatory guidance to support HCT is used as 1 of the 6 Maternal and Child Health Bureau system-wide quality in-dicators for community-based ser-vices geared toward YSHCN.11Previous
research from the National Survey of Children with Special Health Care Needs (NS-CSHCN) revealed that only a minority of parents of YSHCN report having discussed transition with their
adolescent’s physician12and only 30%
had a plan for addressing transition needs.13 In a subanalysis of the
NS-CSHCN restricted to those aged 12 to 17 years, less than half had received transition guidance by their pediatric health providers.14 Taken together,
these data suggest that many YSHCN, regardless of disease severity, are not receiving anticipatory guidance to sup-port transition to adult care from their pediatric health care providers. In ad-ditional, from a health system per-spective, an analysis of the 2005 NS-CSHCN revealed that the presence of a medical home and provision of ade-quate health insurance predicted an individual state’s performance (high, medium, or low) on the Maternal and Child Health Bureau transition ser-vices quality metric.14This finding
sug-gests that a focus on health coverage and development of medical home models could improve provision of HCT services. Failure to receive such ser-vices has been associated with delays in health care and lack of future health coverage.15
In this study, we examined the receipt of transition-related anticipatory guid-ance by 1865 youth and young adults, aged 19 to 23 years, participating in the 2007 Survey of Adult Health and Transition (SATH), a 6-year follow-up survey of the 14- to 17-year-old chil-dren who had participated in the 2001 NS-CSHCN. This survey is the first of young adults to assess their self-reported experience during the period of expected transition to adult-centered care. On the basis of previous work highlighting disparities in ac-cessing the medical home based on so-ciodemographic characteristics,16 we
were particularly interested in exam-ining the hypothesis that sociodemo-graphic factors—particularly race/ ethnicity, insurance status, and health status—would be associated with re-ceipt of HCT counseling. In addition,
be-cause communication with health care providers is a key component of a high-quality medical home,17we examined
the association between the quality of communication with health care pro-viders and receipt of transition ser-vices among the SATH cohort, hypothe-sizing that youth rating their providers higher on communication would also report higher rates of receiving guid-ance regarding HCT.
METHODS
Data set
The 2007 SATH was conducted by the National Center for Health Statistics to explore self-reported transition pro-cesses and outcomes for young adults. SATH was a nationwide telephone sur-vey of young adults aged 19 to 23 years whose parents were interviewed when the youth were 14 to 17 years old in the 2001 NS-CSHCN. Researchers identified 10 933 cases that were eligible for follow-up, and the resulting SATH data set includes 1865 of the 1916
inter-views completed with the young
adults.18 The primary reason for the
low response rate (17.5%) was the in-ability to contact the potential respon-dents. The cooperation rate once con-tacted was very high (97%). The strengths and weaknesses of the sur-vey as well as the methods are dis-cussed at www.cdc.gov/nchs/slaits/ sath.htm.
Variables
Primary Outcome Measures: Receipt of Transition Counseling
any-one discussed with you how to obtain or keep some type of health insurance coverage?”; and (3) “Did you ever meet with adults at school or somewhere else to set goals for what you would do after high school and make a plan for how to achieve them? Sometimes this is called a transition plan.” Binary re-sponses to each of these 3 questions, which we refer to as Transition Coun-seling Outcomes 1 (Discuss Change in Needs), 2 (Discuss Health Insurance), and 3 (Make a Plan), respectively, served as the primary outcomes for our analyses.
Young Adult and Family-Level Variables
We included sociodemographic vari-ables from the SATH data set, including age, gender, and race/ethnicity. In-come was reported by the young adult and categorized in 4 levels: ⬍200% federal poverty level, 200% to 400% of federal poverty level,⬎400% of the federal poverty level, or “don’t know/ refused.” To measure educational at-tainment, we included data on whether the young adult reported having re-ceived a high school diploma and whether he or she received special ed-ucation services. We included health insurance status as reported by the young adult dichotomized into “contin-uous insurance” if they were insured all of the previous 12 months or “no insurance or a gap in insurance in the past 12 months” if they hadⱖ1 months with no insurance during the past 12 months. Data on maternal education, dichotomized into high school diploma or less, and any post– high school edu-cation, was obtained through linking the SATH data with the parental re-sponses from the 2001 NS-CSHCN.
Health Status and Medical Home Variables
The health status variables used in the analysis were obtained from the 2007 SATH questions. Respondents were
asked to rate their general health, which we categorized as excellent, very good, good, and fair–poor. We in-cluded dichotomous indicators to the responses for the following questions: “A person with special health care needs is someone who needs special health care services because of a med-ical, mental health, or other health condition. People with special health care needs might need medicine, ther-apy, or specialty care on a regular basis—stuff other people don’t typi-cally need or only need once in a while. Do you consider yourself to have a spe-cial health care need?” We defined a respondent as having an “activity limi-tation” if they answered yes to any of 3 questions assessing limitations due to health concerns. Current assessment of health status was based on the response to a question asking respondents to rate their health status in the 2007 survey compared with their reported health in 2001 and was categorized into “better” or “worse or about the same.”
The key components of a medical home include a usual place of comprehen-sive care, an accessible place of care, care coordination, and patient-centered care.19,20 In the 2001
NS-CSHCN, individual components of the medical home were assessed and re-ported as a composite medical home variable.21In the data set, the
compos-ite medical home variable was con-structed by combining responses to several questions. For some questions, skip patterns were built into the sur-vey design such that the number of ob-servations for each of the individual characteristics of the medical home varied. Because of the skip patterns, therefore, many SATH respondents had missing data for the composite medical home variable, precluding our use of this particular variable in our analysis. Instead, we identified 2 key aspects of the medical home as key predictors in our analysis. We included
dichotomous indicators of whether the young adult reported having a per-sonal physician or nurse as a marker of a usual place of care, and we ana-lyzed questions related to communica-tion as markers of accessible and family-centered care.
Health Communication Variables
In the SATH survey, the following 5 questions related to communication during the past 12 months with health care providers were asked: (1) “How often did your doctors and other health care providers spend enough time with you?”; (2) “How often did your doctors and other health care providers listen carefully to you?”; (3) “How often did your doctors or other health care providers help you feel like a partner in your care?”; (4) “How often did you get the specific information you needed from your doctors and other health care providers”; and (5) “How often are your doctors and other health care providers sensitive to your values and customs?” Responses to these questions were initially catego-rized as always, usually, sometimes, or never and were dichotomized in our analyses to “always” versus “other.”
Statistical Analyses
Descriptive statistics were used to
summarize the sociodemographic,
sociode-mographic variables, health status in-dicators, and health communication covariates. The multivariate regres-sion analyses were conducted using the PROC LOGISTIC backward stepwise selection modeling technique to iden-tify significant factors associated with each of the 3 outcomes. All analyses were conducted in SAS 9.2 (SAS Insti-tute, Inc, Cary, NC).
RESULTS
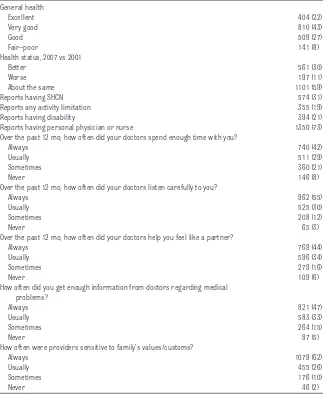
Characteristics of the SATH Cohort The SATH cohort was predominantly white (90%), and a high percentage of respondents had high school diplomas (91%) (Table 1). A majority of respon-dents (65%) reported their health as excellent or very good, and only 31% reported having a current special health care need (SHCN) (Table 2). Most respondents (73%) reported hav-ing a personal physician or nurse. Re-spondents’ assessments of different aspects of health care communication from their providers were generally
positive, with 42% to 62% of respon-dents answering “always” to the spe-cific communication processes as-sessed in the survey (Table 2).
Reported Receipt of Transition Counseling
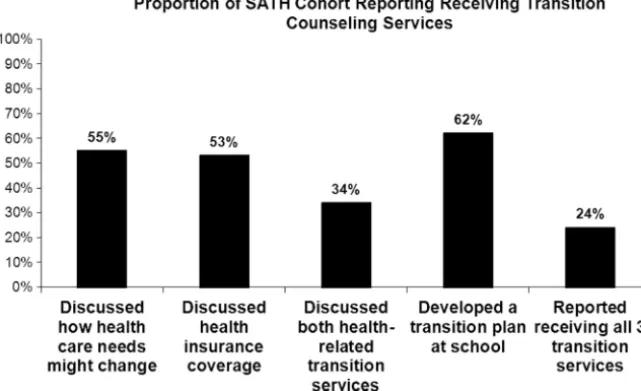
Fig 1 displays the percentage of spondents who positively reported re-ceiving any of the specific transition counseling assessed in SATH: 87% re-ported receiving counseling in at least 1 of the 3 transition topics, 55% re-ported that their physicians or other health care providers had discussed how their needs might change with age (Discuss Change in Needs), 53%
reported that their physicians or other health care providers had discussed how to keep or obtain health insurance as an adult (Discuss Health Insurance), and 62% reported having a plan for what to do after high school (Make a Plan). Thirty-four percent reported receiving the 2 health-related transition counsel-ing outcomes, and only a minority of re-spondents (24%) reported receiving all 3 transition counseling outcomes as-sessed in the survey.
Factors Associated With Reporting Health Care Transition Counseling
In the multivariate analysis for Transi-tion Counseling Outcome 1 (Discuss TABLE 1 SATH Respondent Characteristics:
Demographic Characteristics (N⫽1865)
Characteristic Value
Age, mean, y 21.4
Gender
Male 1011 (54)
Female 852 (46)
Race/ethnicity
White 1668 (90)
Non-white 193 (10) Income
⬍200% federal poverty level 362 (20) 200%–400% federal poverty level 671 (36)
ⱖ400% federal poverty level 658 (35) Do not know/refused 174 (9) High school diploma 1681 (91) Receives special education 473 (26) Maternal education
8th grade or less 12 (1) Some high school, not graduated 53 (3) High school 379 (21) Some post–high school but not a
4-y degree
494 (27)
4-y degree or more 876 (48) Insurance status
Continuous insurance 1214 (65) Gap in insurance or no
insurance
651 (35)
Values aren(%), other otherwise noted.
TABLE 2 SATH Respondent Characteristics: Health Status (N⫽1865) General health
Excellent 404 (22)
Very good 810 (43)
Good 509 (27)
Fair–poor 141 (8)
Health status, 2007 vs 2001
Better 561 (30)
Worse 197 (11)
About the same 1101 (59)
Reports having SHCN 574 (31)
Reports any activity limitation 355 (19)
Reports having disability 394 (21)
Reports having personal physician or nurse 1350 (73) Over the past 12 mo, how often did your doctors spend enough time with you?
Always 740 (42)
Usually 511 (29)
Sometimes 360 (21)
Never 146 (8)
Over the past 12 mo, how often did your doctors listen carefully to you?
Always 962 (55)
Usually 525 (30)
Sometimes 208 (12)
Never 65 (3)
Over the past 12 mo, how often did your doctors help you feel like a partner?
Always 769 (44)
Usually 596 (34)
Sometimes 279 (16)
Never 109 (6)
How often did you get enough information from doctors regarding medical problems?
Always 821 (47)
Usually 583 (33)
Sometimes 264 (15)
Never 87 (5)
How often were providers sensitive to family’s values/customs?
Always 1079 (62)
Usually 455 (26)
Sometimes 176 (10)
Never 46 (2)
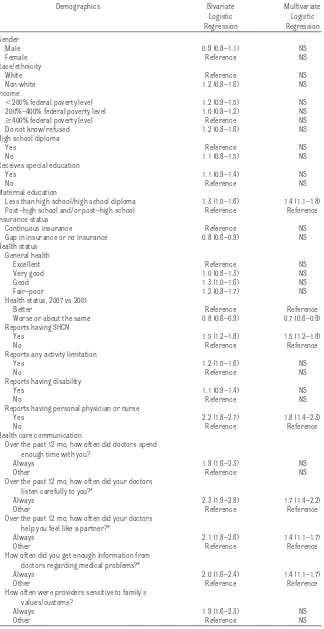
Change in Needs) (adjustedR2: 11.7%),
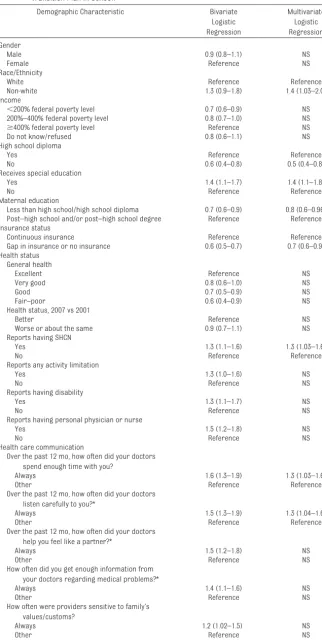
respondents with mothers with lower educational attainment were more likely to report that a physician or other health care providers had dis-cussed how health care needs might change with age (odds ratio [OR]: 1.4 [95% confidence interval (CI): 1.1–1.8]) (Table 3). Those reporting a SHCN (OR: 1.5 [95% CI: 1.2–1.8]) were more likely and those with a health status that was worse or the same compared with 2001 were less likely (OR: 0.7 [95% CI: 0.6 – 0.9]) to report having had discus-sions on changing health care needs. Having a personal physician or nurse was associated with increased odds of discussing how needs might change with age (OR: 1.8 [95% CI: 1.4 –2.3]). Three of the 5 measures of communi-cation were associated with Transi-tion Counseling Outcome 1 (Discuss Change in Needs): reporting that phy-sicians always listened carefully (OR: 1.7 [95% CI: 1.4 –2.2]), reporting that physicians always helped them feel like a partner (OR: 1.4 [95% CI: 1.1– 1.7]), and always receiving enough in-formation from their physician regard-ing medical problems (OR: 1.4 [95% CI: 1.1–1.7]). Race, gender, income, and respondent education were not asso-ciated with this outcome.
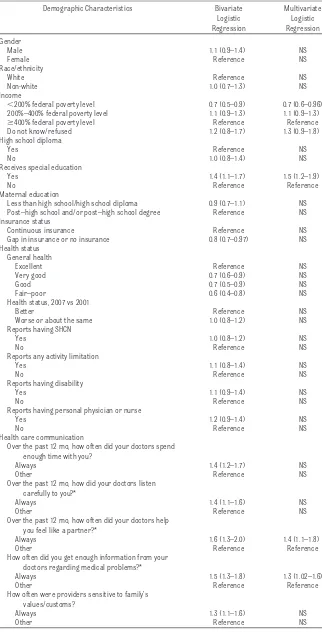
In the multivariate analysis for Transi-tion Counseling Outcome 2 (Discuss Health Insurance) (adjustedR2: 3.8%),
only 2 sociodemographic variables were significantly associated with this outcome (Table 4): those with lower in-come were less likely (OR: 0.7 [95% CI: 0.6 – 0.96]) and those receiving special education were more likely (OR: 1.5 [95% CI: 1.2–1.9]) to have received counseling on future health insurance needs. No measures of health status were significant in the multivariate analysis. Two measures of health care communication were associated with increased odds of receiving counsel-ing related to health insurance: report-ing that physicians always helped them feel like a partner (OR: 1.4 [95% CI: 1.1–1.8]) and always receiving enough information from their physi-cian regarding medical problems (OR: 1.3 [95% CI: 1.02–1.6]).
The sociodemographic characteristics associated with Transition Counseling Outcome 3 (Make a Plan) (adjustedR2:
5.6%), were race, education, and insur-ance status (Table 5). In addition, lower maternal and youth educational achievement were both associated with a lower likelihood of the youth having a transition plan in school.
Among the health status variables, re-porting a SHCN was associated with higher odds of having developed a transition plan in school (OR: 1.3 [95% CI: 1.0 –1.6]). Two of the 5 measures of health care communication were asso-ciated with this outcome in the multi-variate analyses: reporting that their physicians always spent enough time with them (OR: 1.3 [95% CI: 1.03–1.6]) and reporting that their physicians al-ways listened carefully (OR: 1.3 [95% CI: 1.04 –1.6]).
DISCUSSION
In this study, we analyzed data from the national SATH to assess factors as-sociated with receipt of counseling and anticipatory guidance regarding preparing youth for HCT. Overall, just more than one-half of respondents ported receiving some counseling re-garding HCT, and markers of good communication with health providers were consistently associated with in-creased likelihood of reported coun-seling regarding HCT.
The SATH respondents generally re-ported good health, and interestingly, only a minority reported having a cur-rent SHCN, despite the fact that these were individuals who were screened as meeting criteria for a CSHCN in 2001 when their parents were enrolled in the NS-CSHCN. At the same time, these youth seemed quite connected to the health care system, with 73% report-ing that they could identify a personal physician or nurse. However, only a mi-nority of respondents reported having received all 3 transition counseling services. These results echo results of previous national surveys that re-vealed similar low rates of receipt of transition guidance as reported by parents of children aged 14 to 17 years.2,14The SATH survey obtains data
regarding self-reported receipt of transition services by youth aged 19 to 23 years, who by that age should have FIGURE 1
received such guidance. The similar rates of receipt of transition services reported in the SATH and the NS-CSHCN demonstrate that pediatric health pro-viders are not consistently offering transition-focused anticipatory guid-ance. Consistent with our findings, a recent survey of pediatricians also found that less than half of pediatri-cians provide assistance with refer-rals to adult primary care or specialty care for their adolescent patients with SHCN.22 A 2002 Consensus Statement
issued by the American Academy of Pe-diatrics, American Academy of Family Physicians, and the American College of Physicians stated as a goal that by 2010 “all physicians who provide pri-mary or subspecialty care to young people with special health care needs [to] (1) understand the rationale for transition from child-oriented to adult-oriented health care; (2) have the knowledge and skills to facilitate that process; and (3) know if, how, and when transfer of care is indicated.”3
Future work is needed to help develop structured programs and tools for pe-diatric providers to provide transition guidance.
Very few sociodemographic or health status indicators were associated with either of the 2 health system–specific transition services outcomes. Race was not associated with either out-come, although this finding could be a function of the population sampled. Lower maternal educational attain-ment was associated with higher re-ported rates of discussing how needs would change with age, which could reflect a youth’s earlier engagement in their health care with a parent of lower education. Importantly, youth who self-identified as having a SHCN were more likely to report having had such discussions with their physi-cians, which is encouraging in that transition services and future plan-ning are more critical in YSHCN. TABLE 3 Multivariate Analysis for Transition Counseling Outcome 1: “Has Your Doctor Discussed
How Your Health Needs Might Change With Age”?
Demographics Bivariate Logistic Regression
Multivariate Logistic Regression Gender
Male 0.9 (0.8–1.1) NS
Female Reference NS
Race/ethnicity
White Reference NS
Non-white 1.2 (0.9–1.6) NS
Income
⬍200% federal poverty level 1.2 (0.9–1.5) NS 200%–400% federal poverty level 1.0 (0.8–1.2) NS
ⱖ400% federal poverty level Reference NS
Do not know/refused 1.2 (0.8–1.6) NS
High school diploma
Yes Reference NS
No 1.1 (0.8–1.5) NS
Receives special education
Yes 1.1 (0.9–1.4) NS
No Reference NS
Maternal education
Less than high school/high school diploma 1.3 (1.0–1.6) 1.4 (1.1–1.8) Post–high school and/or post–high school Reference Reference Insurance status
Continuous insurance Reference NS
Gap in insurance or no insurance 0.8 (0.6–0.9) NS Health status
General health
Excellent Reference NS
Very good 1.0 (0.8–1.3) NS
Good 1.3 (1.0–1.6) NS
Fair–poor 1.2 (0.8–1.7) NS
Health status, 2007 vs 2001
Better Reference Reference
Worse or about the same 0.8 (0.6–0.9) 0.7 (0.6–0.9) Reports having SHCN
Yes 1.5 (1.2–1.8) 1.5 (1.2–1.8)
No Reference Reference
Reports any activity limitation
Yes 1.2 (1.0–1.6) NS
No Reference NS
Reports having disability
Yes 1.1 (0.9–1.4) NS
No Reference NS
Reports having personal physician or nurse
Yes 2.2 (1.8–2.7) 1.8 (1.4–2.3)
No Reference Reference
Health care communication
Over the past 12 mo, how often did doctors spend enough time with you?
Always 1.9 (1.6–2.3) NS
Other Reference NS
Over the past 12 mo, how often did your doctors listen carefully to you?*
Always 2.3 (1.9–2.8) 1.7 (1.4–2.2)
Other Reference Reference
Over the past 12 mo, how often did your doctors help you feel like a partner?*
Always 2.1 (1.8–2.6) 1.4 (1.1–1.7)
Other Reference Reference
How often did you get enough information from doctors regarding medical problems?*
Always 2.0 (1.6–2.4) 1.4 (1.1–1.7)
Other Reference Reference
How often were providers sensitive to family’s values/customs?
Always 1.9 (1.6–2.3) NS
Other Reference NS
The key indicators associated with higher odds of receiving transition ser-vices were related to provider-patient health care communication, including reporting that physicians always lis-tened, provided adequate information, or partnered with the young adult. Be-cause communication is a key compo-nent of a high-quality medical home,17
these findings lend further support to the concept of a medical home in which comprehensive, coordinated, ongoing health care is provided to youth experi-encing a health care transition.3An
im-portant finding of our study is that 27% of the young adults in the SATH reported no personal physician or nurse, higher than those reported by parents of ado-lescents before transition to adult-hood.23Youth who did not report having
a personal physician or nurse were less likely to report having had discussions about changing needs with age, suggest-ing that a relationship with a medical provider leads to increased engagement in the transition planning process. These results echo the findings from the 2005– 2006 NS-CSHCN that youth with a usual source of care were more likely to re-ceive counseling on their future needs.24
Better communication with health care providers was also associated with higher odds of reporting a school-based transition plan. Taken together, our find-ings underscore the importance of family-centered care in the medical home; specifically the individual relation-ship between an adolescent or young adult and his or her health care team, as a key factor promoting education, trust, and transition planning.3,24,25
Our analysis has several limitations. We could not assess the association between specific health conditions not captured in the survey and HCT ser-vices. However, the survey did have a number of measures of health status, including self-reported disability, spe-cial health care needs, and health sta-tus rating. An additional limitation is TABLE 4 Multivariate Analysis for Transition Counseling Outcome 2: “Has Your Doctor Discussed
How to Obtain Health Insurance as an Adult?”
Demographic Characteristics Bivariate Logistic Regression
Multivariate Logistic Regression Gender
Male 1.1 (0.9–1.4) NS
Female Reference NS
Race/ethnicity
White Reference NS
Non-white 1.0 (0.7–1.3) NS
Income
⬍200% federal poverty level 0.7 (0.5–0.9) 0.7 (0.6–0.96) 200%–400% federal poverty level 1.1 (0.9–1.3) 1.1 (0.9–1.3)
ⱖ400% federal poverty level Reference Reference Do not know/refused 1.2 (0.8–1.7) 1.3 (0.9–1.8) High school diploma
Yes Reference NS
No 1.0 (0.8–1.4) NS
Receives special education
Yes 1.4 (1.1–1.7) 1.5 (1.2–1.9)
No Reference Reference
Maternal education
Less than high school/high school diploma 0.9 (0.7–1.1) NS Post–high school and/or post–high school degree Reference NS Insurance status
Continuous insurance Reference NS
Gap in insurance or no insurance 0.8 (0.7–0.97) NS Health status
General health
Excellent Reference NS
Very good 0.7 (0.6–0.9) NS
Good 0.7 (0.5–0.9) NS
Fair–poor 0.6 (0.4–0.8) NS
Health status, 2007 vs 2001
Better Reference NS
Worse or about the same 1.0 (0.8–1.2) NS Reports having SHCN
Yes 1.0 (0.8–1.2) NS
No Reference NS
Reports any activity limitation
Yes 1.1 (0.8–1.4) NS
No Reference NS
Reports having disability
Yes 1.1 (0.9–1.4) NS
No Reference NS
Reports having personal physician or nurse
Yes 1.2 (0.9–1.4) NS
No Reference NS
Health care communication
Over the past 12 mo, how often did your doctors spend enough time with you?
Always 1.4 (1.2–1.7) NS
Other Reference NS
Over the past 12 mo, how did your doctors listen carefully to you?*
Always 1.4 (1.1–1.6) NS
Other Reference NS
Over the past 12 mo, how often did your doctors help you feel like a partner?*
Always 1.6 (1.3–2.0) 1.4 (1.1–1.8)
Other Reference Reference
How often did you get enough information from your doctors regarding medical problems?*
Always 1.5 (1.3–1.8) 1.3 (1.02–1.6)
Other Reference Reference
How often were providers sensitive to family’s values/customs?
Always 1.3 (1.1–1.6) NS
Other Reference NS
the relatively homogeneous nature of the SATH cohort. Because of the diffi-culty in finding youth who had partici-pated in the 2001 NS-CSHCN, the re-sponse rate was low and the final cohort is not representative of the gen-eral US population. An analysis of the response bias by the National Center for Health Statistics staff concluded that youth who were more affluent and those with continuous health insur-ance were more likely to be located and those who were black, poor, and less educated were less likely to be located (personal communication, Kathleen O’Connor, MPH, written com-munication, National Center for Health Statistics, October 21, 2010). The diffi-culty in finding youth who are undergo-ing transition to adulthood underscores the many changes that occur at this time and which may undermine health care services. Given the skewed SATH sample, we may not have detected important differences in transition counseling services or other outcomes related to health status, socioeconomic status, and demographic factors. The results, therefore, may not be generalizable across race/ethnicity, geographic loca-tion, health status, or socioeconomic strata. In addition, our results may not be applicable to the health care transi-tion experience of youth with specific chronic diseases that disproportionately affect minority populations (eg, sickle cell disease). We conjecture that the re-ceipt of transition services might be even lower among such young adults who were not included in the SATH co-hort. However, despite these limitations, the SATH is the first national sample that has attempted to survey young adults with SHCN to assess their self-reported experience during the period of expected transition to adult-centered care. We encourage future study of young adults with SHCN and in broader populations to evaluate their HCT ex-perience and outcomes. Finally, al-though the transition counseling out-TABLE 5 Multivariate Analysis for Transition Counseling Outcome 3: “Have You Developed a
Transition Plan in School?”
Demographic Characteristic Bivariate Logistic Regression
Multivariate Logistic Regression Gender
Male 0.9 (0.8–1.1) NS
Female Reference NS
Race/Ethnicity
White Reference Reference
Non-white 1.3 (0.9–1.8) 1.4 (1.03–2.0)
Income
⬍200% federal poverty level 0.7 (0.6–0.9) NS 200%–400% federal poverty level 0.8 (0.7–1.0) NS
ⱖ400% federal poverty level Reference NS
Do not know/refused 0.8 (0.6–1.1) NS
High school diploma
Yes Reference Reference
No 0.6 (0.4–0.8) 0.5 (0.4–0.8)
Receives special education
Yes 1.4 (1.1–1.7) 1.4 (1.1–1.8)
No Reference Reference
Maternal education
Less than high school/high school diploma 0.7 (0.6–0.9) 0.8 (0.6–0.96) Post–high school and/or post–high school degree Reference Reference Insurance status
Continuous insurance Reference Reference Gap in insurance or no insurance 0.6 (0.5–0.7) 0.7 (0.6–0.9) Health status
General health
Excellent Reference NS
Very good 0.8 (0.6–1.0) NS
Good 0.7 (0.5–0.9) NS
Fair–poor 0.6 (0.4–0.9) NS
Health status, 2007 vs 2001
Better Reference NS
Worse or about the same 0.9 (0.7–1.1) NS Reports having SHCN
Yes 1.3 (1.1–1.6) 1.3 (1.03–1.6)
No Reference Reference
Reports any activity limitation
Yes 1.3 (1.0–1.6) NS
No Reference NS
Reports having disability
Yes 1.3 (1.1–1.7) NS
No Reference NS
Reports having personal physician or nurse
Yes 1.5 (1.2–1.8) NS
No Reference NS
Health care communication
Over the past 12 mo, how often did your doctors spend enough time with you?
Always 1.6 (1.3–1.9) 1.3 (1.03–1.6)
Other Reference Reference
Over the past 12 mo, how often did your doctors listen carefully to you?*
Always 1.5 (1.3–1.9) 1.3 (1.04–1.6)
Other Reference Reference
Over the past 12 mo, how often did your doctors help you feel like a partner?*
Always 1.5 (1.2–1.8) NS
Other Reference NS
How often did you get enough information from your doctors regarding medical problems?*
Always 1.4 (1.1–1.6) NS
Other Reference NS
How often were providers sensitive to family’s values/customs?
Always 1.2 (1.02–1.5) NS
Other Reference NS
comes assessed in the SATH survey
rep-resent 3 key processes in health care transition, they do not completely cap-ture the complexities of the HCT process from both a developmental and medical
perspective. Future work is needed to re-fine and improve both process and out-come measures for the assessment of HCT, particularly in higher-risk
popula-tions.
CONCLUSIONS
We report on the first national survey of young adults to assess their
experi-ences of receiving counseling regard-ing HCT. Communication and engage-ment with the health care system were more strongly linked to receiving HCT services than sociodemographic and health status measures. Although fu-ture work is needed in larger, more diverse populations, developing a medical home model that promotes anticipatory guidance for HCT, includ-ing provider-youth communication and incorporates skills assessment and building for young adults, will pro-mote improvements in HCT services and may ultimately improve health
out-comes after transition to
adult-centered care.
ACKNOWLEDGMENTS
We acknowledge the National Center for Health Statistics and State and Local
Area Integrated Telephone Survey (SLAITS) for the initial data collection and administration of the SATH survey. We also acknowledge Kathy O’Connor, MPH,
at National Center for Health Statistics, for technical support with the data set. The authors are responsible for the anal-ysis, interpretation, and conclusions.
REFERENCES
1. Perrin JM, Bloom SR, Gortmaker SL. The in-crease of childhood chronic conditions in the United States.JAMA. 2007;297(24):2755–2759 2. Lotstein DS, Ghandour R, Cash A, McGuire E,
Strickland B, Newacheck P. Planning for health care transitions: results from the 2005-2006 National Survey of Children With Special Health Care Needs.Pediatrics. 2009; 123(1). Available at: www.pediatrics.org/ cgi/content/full/123/1/e145
3. American Academy of Pediatriacs, American Academy of Family Physicians, American College of Physicians–American Society of Internal Med-icine. A consensus statement on health care transitions for young adults with special health care needs.Pediatrics. 2002;110(6 pt 2): 1304 –1306
4. Rosen DS, Blum RW, Britto M, Sawyer SM, Siegel DM, Society for Adolescent Medicine. Transition to adult health care for adolescents and young adults with chronic conditions: position paper of the Society for Adolescent Medicine.J Adolesc Health. 2003;33(4):309 –311
5. Reiss J, Gibson R. Health care transition: destinations unknown. Pediatrics. 2002; 110(6 pt 2):1307–1314
6. Rosen D. Between two worlds: bridging the cultures of child health and adult medicine.
J Adolesc Health. 1995;17(1):10 –16 7. Rettig P, Athreya BH. Adolescents with
chronic disease. Transition to adult health care.Arthritis Care Res. 1991;4(4):174 –180 8. Salmi J, Huupponen T, Oksa H, Oksala H, Koivula T, Raita P. Metabolic control in adolescent insulin-dependent diabetics referred from pediatric to adult clinic.Ann Clin Res. 1986;18(2):84 – 87 9. Orr DP, Fineberg NS, Gray DL. Glycemic control
and transfer of health care among adolescents with insulin dependent diabetes mellitus.J Ado-lesc Health. 1996;18(1):44 – 47
10. Vanelli M, Caronna S, Adinolfi B, Chiari G, Gug-liotta M, Arsenio L. Effectiveness of an uninter-rupted procedure to transfer adolescents with Type 1 diabetes from the Paediatric to the Adult Clinic held in the same hospital: eight-year expe-rience with the Parma protocol.Diabetes Nutr Metabol. 2004;17(5):304 –308
11. Progress toward implementing community-based systems of services for children with special health care needs: summary tables from the National Survey of Children With Spe-cial Health Care Needs, 2005–2006. Available at: www.cdc.gov/nchs/data/slaits/Summary_ tables_NSCSHCN_0506.pdf Accessed Novem-ber 18, 2008
12. Lotstein DS, McPherson M, Strickland B, Newacheck PW. Transition planning for youth with special health care needs: re-sults from the National Survey of Children with Special Health Care Needs.Pediatrics. 2005;115(6):1562–1568
13. Scal P, Ireland M. Addressing transition to adult health care for adolescents with spe-cial health care needs.Pediatrics. 2005; 115(6):1607–1612
14. Kane DJ, Kasehagen L, Punyko J, Carle AC, Penziner A, Thorson S. What factors are as-sociated with state performance on provi-sion of transition services to CSHCN? Pedi-atrics. 2009;124(suppl 4):S375–S383 15. Lotstein DS, Inkelas M, Hays RD, Halfon N, Brook
R. Access to care for youth with special health care needs in the transition to adulthood.J Ado-lesc Health. 2008;43(1):23–29
16. Fulda KG, Lykens K, Bae S, Singh K. Factors for accessing a medical home vary among CSHCN from different levels of socioeconomic status.
Matern Child Health J. 2009;13(4):445– 456 17. Benedict RE. Quality medical homes:
meet-ing children’s needs for therapeutic and
supportive services. Pediatrics. 2008; 121(1). Available at: www.pediatrics.org/ cgi/content/full/121/1/e127
18. State and Local Area Integrated Telephone Sur-vey, Survey of Adult Transition and Health. 2007. Available at: www.cdc.gov/nchs/slaits/sath.htm. Accessed March 1, 2010
19. Cooley WC. Redefining primary pediatric care for children with special health care needs: the primary care medical home.
Curr Opin Pediatr. 2004;16(6):689 – 692 20. Strickland B, McPherson M, Weissman G, van
Dyck P, Huang ZJ, Newacheck P. Access to the medical home: results of the National Survey of Children with Special Health Care Needs. Pediat-rics. 2004;113(5 suppl):1485–1492
21. Blumberg SJ, Welch EM, Chowdhury SR, Up-church HL, Parker EK, Skalland BJ. Design and operation of the National Survey of Chil-dren with Special Health Care Needs, 2005-2006.Vital Health Stat. 2008;(45):1–188 22. McManus M, Fox H, O’Connor K, Chapman T,
MacKinnon J. Pediatric Perspectives and Prac-tices on Transitioning Adolescents with Special Needs to Adult Health Care. 2008. Available at: www.thenationalalliance.org/jan07/factsheet6. pdf. Accessed August 18, 2010
23. Newacheck PW, Hung YY, Park MJ, Brindis CD, Irwin CE Jr. Disparities in adolescent health and health care: does socioeconomic status matter?
Health Serv Res. 2003;38(5):1235–1252 24. Duke NN, Scal PB. Adult care transitioning for
ad-olescents with special health care needs: a piv-otal role for family centered care.Matern Child Health J. 2011;15(1):98 –105
DOI: 10.1542/peds.2010-3017 originally published online August 8, 2011;
2011;128;e521
Pediatrics
Lukens-Bull and David Wood
Gregory S. Sawicki, Ruth Whitworth, Laura Gunn, Ryan Butterfield, Katryne
Transition and Health
Receipt of Health Care Transition Counseling in the National Survey of Adult
Services
Updated Information &
http://pediatrics.aappublications.org/content/128/3/e521
including high resolution figures, can be found at:
References
http://pediatrics.aappublications.org/content/128/3/e521#BIBL
This article cites 19 articles, 5 of which you can access for free at:
Subspecialty Collections
nsition_-_discharge_planning_sub
http://www.aappublications.org/cgi/collection/continuity_of_care_tra
Continuity of Care Transition & Discharge Planning
http://www.aappublications.org/cgi/collection/hospital_medicine_sub
Hospital Medicine
following collection(s):
This article, along with others on similar topics, appears in the
Permissions & Licensing
http://www.aappublications.org/site/misc/Permissions.xhtml
in its entirety can be found online at:
Information about reproducing this article in parts (figures, tables) or
Reprints
http://www.aappublications.org/site/misc/reprints.xhtml
DOI: 10.1542/peds.2010-3017 originally published online August 8, 2011;
2011;128;e521
Pediatrics
Lukens-Bull and David Wood
Gregory S. Sawicki, Ruth Whitworth, Laura Gunn, Ryan Butterfield, Katryne
http://pediatrics.aappublications.org/content/128/3/e521
located on the World Wide Web at:
The online version of this article, along with updated information and services, is
by the American Academy of Pediatrics. All rights reserved. Print ISSN: 1073-0397.