Medical Home and Out-of-Pocket Medical Costs for
Children With Special Health Care Needs
WHAT’S KNOWN ON THIS SUBJECT: Families whose children with special needs receive health care in a medical home setting are less likely to report financial stress attributable to medical expenses incurred on behalf of those children. Financial stress is measured subjectively through parents’ perceptions.
WHAT THIS STUDY ADDS: Families whose children with special needs receive health care in a medical home setting incur significantly lower out-of-pocket costs per $1000 of household income compared with similar families without a medical home. This study used objective measures of financial stress.
abstract
OBJECTIVE:We examined key factors that affect out-of-pocket medical expenditures per $1000 of household income for children with special health care needs (CSHCN) with a broad range of conditions, control-ling for insurance type and concentrating on the potentially moderat-ing role of the medical home.
METHODS:A Heckman selection model was used to estimate whether the medical home influenced out-of-pocket medical costs per $1000 of household income for children covered by either private or public health insurance. Data from the 2005–2006 National Survey of CSHCN (N⫽31 808) were used.
RESULTS:For families that incurred out-of-pocket medical costs for their CSHCN, these costs represented 2.2% to 3.9% of income. Both insurance type and the medical home had significant effects on out-of-pocket costs. Lower out-of-out-of-pocket medical costs per $1000 of income were incurred by children with public insurance and those receiving care coordination services.
CONCLUSIONS:Families with CSHCN incur lower out-of-pocket medical costs when their children receive health care in a setting in which the care-coordination component of the medical home is in place.
Pediatrics2011;128:892–900
AUTHORS:Shirley L. Porterfield, PhD,aand LeaAnne
DeRigne, MSW, PhDb
aSchool of Social Work, University of Missouri-St Louis, St Louis,
Missouri; andbSchool of Social Work, Florida Atlantic University,
Boca Raton, Florida
KEY WORDS
health care costs, out-of-pocket costs, medical home, children with special health care needs, insurance
ABBREVIATIONS
CSHCN—children with special health care needs
NS-CSHCN—National Survey of Children With Special Health Care Needs
www.pediatrics.org/cgi/doi/10.1542/peds.2010-1307
doi:10.1542/peds.2010-1307
Accepted for publication Jul 22, 2011
Address correspondence to Shirley L. Porterfield, PhD, School of Social Work, University of Missouri-St Louis, One University Boulevard, St Louis, MO 63121. E-mail: porterfields@umsl.edu
PEDIATRICS (ISSN Numbers: Print, 0031-4005; Online, 1098-4275).
Copyright © 2011 by the American Academy of Pediatrics
Raising children is expensive, and many families struggle financially. US Department of Agriculture esti-mates of the annual costs of raising a child range from $11 610 to $13 480 for a 2-child, 2-parent, middle-income household.1Financial struggles can be
even more difficult for families raising children with special health care
needs (CSHCN) with ⬎20% of such
families reporting financial problems attributable to their child’s condi-tion.2–5 Evaluation of this issue is
es-sential, because ⬎1 in 5 households
(21.8%) with children in the United
States are estimated to have ⱖ1
CSHCN.6 This translates into nearly
14% of US children or ⬎10 million
CSHCN, defined by the Maternal and Child Health Bureau as children who “have or are at risk for a chronic phys-ical, developmental, behavioral, or emotional condition and who also re-quire health and related services of a type or amount beyond that required by children generally.”7
Out-of-pocket medical expenditures are estimated to be twice as high for CSHCN as for children without chronic conditions.2Being uninsured or having
private insurance, being an adoles-cent, being black, having a more se-vere condition, and living in
lower-income households increase the
likelihood of experiencing higher out-of-pocket health expenditures.2,4,8
Out-of-pocket expenditures also vary ac-cording to the medical condition. In 1997–2000, such expenditures aver-aged $161 per year for children with mental retardation, $613 for children with autism, and $687 for children with a diagnosis of depression.9–13
More than 80% of families with CSHCN in the 2001 National Survey of CSHCN (NS-CSHCN) reported having annual out-of-pocket medical expenditures for their children, which averaged $752.14
In the 2005–2006 NS-CSHCN, nearly one-third of families surveyed had
more than $1000 in annual out-of-pocket medical costs.15Similar results
were found in a study that used 1999 and 2000 Medical Expenditure Panel Survey data.16
Families with CSHCN are less likely to
report financial problems if their chil-dren receive health care in a medical home.3,15,16The medical home concept
originated with the American Academy of Pediatrics in 1967 and was posited as a method for improving the care of CSHCN.17A medical home involves care
that is accessible, family-centered,
co-ordinated, comprehensive, continu-ous, compassionate, and culturally ef-fective. The care-coordination aspect of the medical home might be key. Families whose “health care providers communicated with other service pro-viders and who helped them feel like
partners in their child’s care were sig-nificantly less likely to report financial or employment problems.”8
Nearly 50% of CSHCN are estimated
to have a medical home.6 Research
suggests that lower-income and non-white children are less likely to have a medical home, and children whose mothers have more education are
more likely to have a medical
home.18–20Although a few studies have
analyzed how receiving care in a
med-ical home setting affects subjective measures of family financial status, none, to our knowledge, has analyzed the relationship between the 4 compo-nents of the medical home and out-of-pocket expenditures for CSHCN by using more-objective monetary mea-sures. This article explores factors af-fecting out-of-pocket medical
expendi-tures for CSHCN, controlling for
insurance type and concentrating on the potentially moderating role of the medical home. We hypothesized that CSHCN who had a medical home would
incur lower out-of-pocket medical
costs.
METHODS
Study Sample
This study used data from the 2005–
2006 NS-CSHCN.6,21 The sample
in-cluded children from birth to 17 years of age who were covered by either pri-vate or public health insurance, but not both, in the past year. Household income data were missing for 9% of the sample, and nearly 5% of the re-maining sample did not complete all questions necessary for calculation of
a medical home variable.14 The only
significant difference between the missing and included samples was higher out-of-pocket costs for CSHCN covered by private insurance in the in-cluded sample. The final sample size used in this analysis was 31 808 (23 175 children with private insur-ance and 8633 children with public insurance).
Dependent Variable
Rather than using subjective questions about financial problems attributable to costs associated with CSHCN, we measured out-of-pocket medical costs (in dollars) incurred on behalf of CSHCN per $1000 of household income in the past year. Previous research suggested that recall of this type of cost information is valid, provided that the recall time period does not exceed 12 months, and that patients tend to underestimate the costs of health care.22,23
Medical Expenditure Panel Survey.14
Data for the dependent variable de-nominator, that is, household income (in thousands of dollars), were not available in the public release file. However, we were able to obtain data on median incomes according to pov-erty level, household size, and state, as compiled by researchers at the Na-tional Center for Health Statistics from actual incomes reported by survey respondents.
Independent Variables
The independent variable of interest was the medical home variable. This variable was operationalized through the definition developed by the Child and Adolescent Health Measurement Initiative into 4 components, including whether (1) the child had a usual source of care and/or personal pro-vider, (2) the care provided was “fam-ily centered,” (3) care-coordination services were received, and (4) the family had no problems getting all of the referrals needed.24Nearly 55% of
children in the private insurance sam-ple and 42% of children in the public insurance sample met the criteria for all 4 components and thus received care in a medical home.
The remaining independent variables were grouped as need, enabling, and
predisposing variables.25 Need
vari-ables were those measuring aspects of the child’s medical condition that might affect directly the out-of-pocket costs associated with the provision of health care for the child. These vari-ables included the child’s medical di-agnoses and the severity of the child’s condition, as rated by the responding parent. Seventeen diagnoses were combined into 12 categories for this analysis (Table 1). In addition, we in-cluded variables indicating whether the child had both emotional, develop-mental, or behavioral conditions (in-cluding attention-deficit/hyperactivity
disorder, autism, mental retardation, and emotional problems) and physical health diagnoses (all other conditions) and whether the child was delayed in receiving care or had unmet medical needs.
Enabling variables measured the re-sources the family had in place that might affect out-of-pocket costs. These variables included whether the child
had been uninsured forⱖ1 month
dur-ing the previous year, household in-come as a proportion of the poverty level, whether the family had unmet mental health needs, and the presence of other children who also might incur medical costs, including other CSHCN, in the household. Household income as a proportion of the poverty level was likely an indicator not only of the ability to pay but also of the family’s ability to negotiate the complexities of health service access and utilization for their children.
Predisposing variables were those that likely affected out-of-pocket costs for the focal child only indirectly. These variables included the age, gender, race, and ethnicity of the child, the family structure, the education level of the primary caregiver, the immigrant status of the family, and the urban or rural location of the household.
Analyses
The data were analyzed descriptively and in a multivariate model. The de-pendent variable, that is, out-of-pocket medical costs per $1000 of household income, was continuous but truncated at $0. Costs were estimated for each insurance type sample according to whether the child had a medical home, to allow prediction of the full effects of the medical home on out-of-pocket costs. The models were estimated by using a Heckman selection model in Stata 11 (Stata Corp, College Station, TX) with correction for the complex
sampling scheme of the NS-CSHCN.26
Some families reported no out-of-pocket medical costs for their CSHCN. The Heckman model allowed us to cor-rect for this selection effect by identi-fying first factors influencing whether there were out-of-pocket costs (probit
model) and then factors influencing the level of those costs for families that incurred them (ordinary least-squares
regression). Out-of-pocket medical
costs were estimated as a function of the needs of the child, family re-sources, and family sociodemographic characteristics.
RESULTS
Study Population
Descriptive statistics and
out-of-pocket medical costs for each of the samples are shown in Table 1. Children covered by private insurance were sig-nificantly different from children cov-ered by public insurance with respect to both health conditions and
sociode-mographic characteristics. Larger
proportions of children with public in-surance were diagnosed in every dis-ability category with the exception of diabetes, and those children’s
condi-tions were reported as being more se-vere than those reported for children with private insurance. Children with public insurance were more likely to have unmet medical needs, delays in needed medical care, and gaps in in-surance coverage in the past year. Their families were more likely to clude single mothers with lower in-comes, and other family members were more likely to report unmet men-tal health needs. Children with public insurance were somewhat younger than children with private insurance; there was a larger proportion of chil-dren younger than 5 years and a smaller proportion in high school. Such children also were more likely to
be members of minority groups
ar-TABLE 1 Descriptive Statistics and Out-of-Pocket Medical Costs for CSHCN Covered by Private or Public Insurance
Variables Proportion, % OOP Costs Per $1000 of
Income, Mean, $
Actual OOP Costs, Mean, $
Private Insurance (N⫽23 175)
Public Insurance (N⫽8633)
Private Insurance (N⫽23 175)
Public Insurance (N⫽8633)
Private Insurance (N⫽23 175)
Public Insurance (N⫽8633)
Overall 21.27 17.86 1298 317
Variables suggesting financial stress
OOP medical costs for CSHCN in previous year
With OOP costs above $0 96.8 45.5a 21.96 39.15 1341 694
With OOP costs⬎5% of income 12.2 6.9a 94.74 186.97 4163 2939
With OOP costs⬎10% of income 3.2 4.2 166.68 255.35 4267 3601
Costs caused family financial problems 15.1 20.3a 52.98 46.97 2576 879
Family needs additional income for child’s medical expenses 13.4 16.9a 54.37 58.15 2616 1 026
Has medical home 54.4 41.5a 16.68 10.40 1088 215
Has usual doctor/source of care 99.2 97.5a 21.11 17.77 1300 318
Care is family-centered 72.8 59.2a 19.64 12.59 1252 271
Care coordination received 67.4 60.7a 16.94 11.45 1085 235
No problem getting referrals 94.2 91.1a 20.49 15.84 1252 279
Need variables
Child’s medical conditionb
Asthma 37.6 40.9a 19.65 19.64 1177 300
Attention-deficit/hyperactivity disorder 25.3 35.8a 23.98 19.85 1469 333
Autism 4.4 6.1a 37.88 28.96 2129 472
Mental retardation 6.6 18.6a 37.63 31.11 2006 474
Diabetes mellitus 1.5 1.7 38.25 28.29 2280 614
Heart or blood condition 4.4 7.4a 35.68 30.77 1717 510
Emotional condition 15.6 30.0a 35.03 26.50 1930 404
Cystic fibrosis, cerebral palsy, or muscular dystrophy 1.3 3.1a 41.49 47.20 2398 845
Seizure disorder or migraines 13.2 23.6a 30.65 28.06 1700 456
Joint condition/arthritis 3.1 5.8a 37.15 39.11 2008 558
Allergies 54.7 50.8a 20.80 21.15 1253 358
Blind/deaf 3.2 5.5a 26.40 21.69 1608 354
Child has both physical and emotional, developmental, or behavioral conditions
21.2 38.0a 31.41 27.33 1734 441
Severity of child’s medical condition
Mild 67.4 44.3a 15.97 10.04 1039 193
Moderate 28.1 41.3a 29.55 18.12 1722 364
Major 4.5 14.3a 49.09 41.29 2541 564
Child has unmet health needs 8.9 18.4a 36.92 30.02 1867 497
Enabling variables
Gaps in health insurance in previous year 3.0 10.3a 35.25 36.12 1336 960
Household income in previous year
ⱕ100% of poverty level 2.4 50.1a 95.37 23.02 1004 207
101%–200% of poverty level 12.9 36.8a 35.37 13.88 1142 388
201%–400% of poverty level 40.0 10.9a 21.30 9.99 1242 496
⬎400% of poverty level 41.2 2.0a 13.32 6.79 1409 708
Mother’s/caregiver’s education level
Did not complete high school 1.8 15.1a 21.96 13.38 949 162
High school completion only 14.3 39.0a 26.29 19.01 1124 266
Post-high school education/training 83.8 45.5a 20.38 18.20 1332 409
Other family members have unmet mental health needs 1.4 3.4a 54.11 50.59 2500 695
Child is only child in household 30.5 30.7 27.00 27.05 1448 400
Multiple CSHCN in household 30.5 37.5a 19.11 15.30 1234 304
Delays getting health care 5.7 9.9a 34.48 29.97 1737 495
Predisposing variables Child’s age
0–4 y 15.0 18.6a 19.95 12.24 1228 281
5–10 y 34.5 36.7 19.83 17.72 1209 299
11–13 y 20.6 20.6 22.57 20.38 1390 356
14–17 y 29.9 24.1a 22.70 20.34 1374 339
Child is male 59.2 58.8 20.50 18.36 1254 310
eas, and to have siblings who also had special health care needs.
On average, families with CSHCN who had private insurance spent $1298, or 2.1% of their household incomes ($21.27 per $1000), on out-of-pocket, unreimbursed, medical costs for their CSHCN. Families with CSHCN who had public insurance spent $317, or 1.8% of their household in-comes ($17.86 per $1000).
Out-of-pocket medical costs for the child ex-ceeded 5% of household income for 12.2% of families with private
insur-ance, and costs exceeded 10% of household income for 3.2% of those
families. Comparable figures for
families with public insurance were 6.9% and 4.2%. In both samples, fam-ilies whose children had a medical home spent significantly less, on av-erage (families with private
insur-ance: $1088 [or 1.6% of income]; fam-ilies with public insurance: $215 [or 1% of income]), than did families
whose child did not have a medical home. Families with public insur-ance were significantly more likely to report that their children’s medical expenses caused family financial
problems (20.3%) or that they
needed additional income to pay for the medical expenses (16.9%).
Medi-TABLE 1 Continued
Variables Proportion, % OOP Costs Per $1000 of
Income, Mean, $
Actual OOP Costs, Mean, $
Private Insurance (N⫽23 175)
Public Insurance (N⫽8633)
Private Insurance (N⫽23 175)
Public Insurance (N⫽8633)
Private Insurance (N⫽23 175)
Public Insurance (N⫽8633) Child’s race
White 80.4 53.2a 21.54 20.23 1347 380
Black 9.3 29.9a 18.05 12.94 905 199
Other or multiple races 9.8 15.9a 21.75 19.24 1256 321
Child is Hispanic 10.5 21.4a 22.97 18.48 1245 279
Immigrant family 1.8 8.5a 31.76 14.72 1513 253
Lives in urban area 77.0 70.0a 20.68 17.09 1294 313
Lives in rural area 23.0 30.0a 26.60 19.56 1348 302
Family structure
Married couple 76.7 36.8a 19.07 15.30 1312 381
Single mother 18.0 47.5a 29.98 19.05 1270 262
Other family structure 4.1 6.6a 24.24 16.72 1233 369
OOP indicates out-of-pocket.
aSignificantly different from children with private insurance, at the 95% confidence level.
bNew to the 2005–2006 NS-CSHCN were questions regarding the child’s specific diagnosis. Parents were asked, “To the best of your knowledge, does the child currently have the following
conditions: (1) asthma, (2) attention-deficit disorder or attention-deficit/hyperactivity disorder, (3) autism or autism spectrum disorder, (4) Down syndrome, mental retardation, or
developmental delay, (5) depression, anxiety, an eating disorder, or other emotional problems, (6) diabetes, (7) heart problems, including congenital heart disease, (8) blood problems, (9) cystic fibrosis, (10) cerebral palsy, (11) muscular dystrophy, (12) epilepsy or other seizure disorder, (13) migraine or frequent headaches, (14) arthritis or other joint problems, and/or (15)
allergies.” Parents also were asked whether their child was deaf or blind, which were combined into a single category for this analysis. Because of small sample sizes, we also combined heart and blood problems into 1 category, cystic fibrosis, cerebral palsy, and muscular dystrophy into 1 category, and seizure disorders and migraines into 1 category.
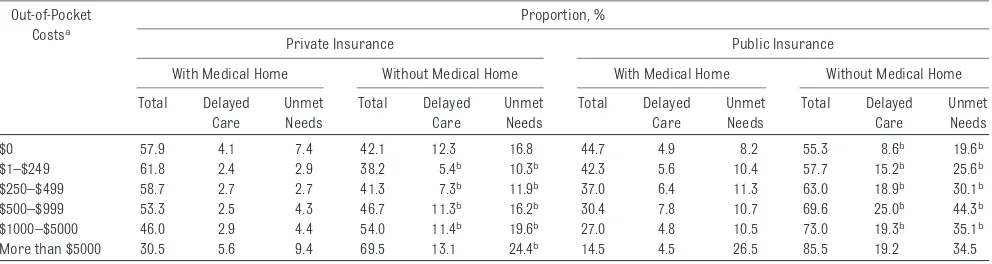
TABLE 2 Proportion of Subjects in Each Out-of-Pocket Cost Category With Delays in Needed Health Care or Unmet Health Care Needs, According to Type of Insurance and Medical Home
Out-of-Pocket Costsa
Proportion, %
Private Insurance Public Insurance
With Medical Home Without Medical Home With Medical Home Without Medical Home
Total Delayed
Care
Unmet Needs
Total Delayed
Care
Unmet Needs
Total Delayed
Care
Unmet Needs
Total Delayed
Care
Unmet Needs
$0 57.9 4.1 7.4 42.1 12.3 16.8 44.7 4.9 8.2 55.3 8.6b 19.6b
$1–$249 61.8 2.4 2.9 38.2 5.4b 10.3b 42.3 5.6 10.4 57.7 15.2b 25.6b
$250–$499 58.7 2.7 2.7 41.3 7.3b 11.9b 37.0 6.4 11.3 63.0 18.9b 30.1b
$500–$999 53.3 2.5 4.3 46.7 11.3b 16.2b 30.4 7.8 10.7 69.6 25.0b 44.3b
$1000–$5000 46.0 2.9 4.4 54.0 11.4b 19.6b 27.0 4.8 10.5 73.0 19.3b 35.1b
More than $5000 30.5 5.6 9.4 69.5 13.1 24.4b 14.5 4.5 26.5 85.5 19.2 34.5
aThis variable was constructed from 2 questions in the NS-CSHCN, the first asking whether out-of-pocket medical costs for the CSHCN (including all types of health-related needs such as
copayments, dental or vision care, medications, special foods, adaptive clothing, durable equipment, home modifications, or any kind of therapy but not health insurance premiums or costs
that were or will be reimbursed by insurance or another source) were more than $500, $250 to $500, less than $250, or nothing and the second asking whether these costs were more than $5000, $1000 to $5000, or less than $1000.
cal costs per $1000 of household in-come were highest ($47–$58) for families that reported that they needed additional income, for fami-lies with other members who had un-met mental health needs ($50 –$54), and, in the private insurance sample, for families in poverty ($95). Out-of-pocket costs increased with the se-verity of conditions in both samples.
Delayed Care, Unmet Medical Needs, and the Medical Home
Higher levels of unmet needs and de-layed care were reported by those with no or very high out-of-pocket costs (Ta-ble 2). The highest levels of reported unmet needs were for mental health care and counseling; physical, occupa-tional, or speech therapy; and dental
care, regardless of insurance type. CSHCN with public insurance, com-pared with private insurance, were significantly more likely to experience unmet needs or delayed medical care. CSHCN with public insurance were less likely to receive care in a medical home, and those without a medical home were more likely to report un-met needs or delayed medical care. Re-gardless of insurance type, Table 2 shows a linear inverse relationship be-tween the proportion of CSHCN who re-ceived health care in a medical home setting and out-of-pocket costs.
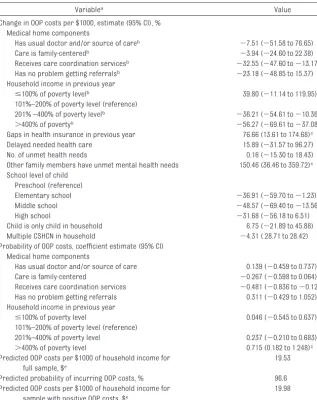
Insurance and the Medical Home Table 3 shows results from the Heck-man model estimating out-of-pocket medical costs per $1000 of household income for children with private insur-ance, whereas Table 4 shows results for children with public insurance. Al-though all independent variables were included in 1 or both of the equations in this model, only variables of interest are shown.
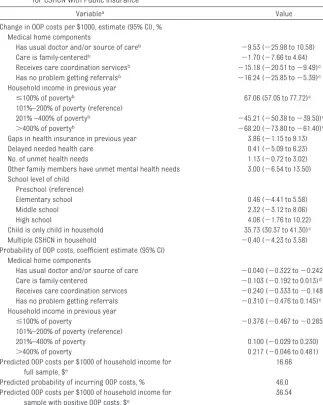
Care coordination was the only sig-nificant medical home component for children with private insurance (Table 3). Children who received care-coordination services were signifi-cantly less likely to have any out-of-pocket costs and, if costs were incurred, they were 32% lower than those incurred by children without care-coordination services. Children with public insurance who received family-centered care, received care co-ordination, or had no problems with referrals were significantly less likely to incur any out-of-pocket costs (Table 4). Costs incurred by children with cacoordination services and no re-ferral problems were 15% and 16% lower, respectively, than costs in-curred by children without those services.
Children with both types of insurance were significantly more likely to incur
TABLE 3 Heckman Selection Model for Out-of-Pocket Medical Costs per $1000 of Household Income for CSHCN With Private Insurance
Variablea Value
Change in OOP costs per $1000, estimate (95% CI), % Medical home components
Has usual doctor and/or source of careb ⫺7.51 (⫺51.58 to 76.65)
Care is family-centeredb ⫺3.94 (⫺24.60 to 22.38)
Receives care coordination servicesb ⫺32.55 (⫺47.60 to⫺13.17)c
Has no problem getting referralsb ⫺23.18 (⫺48.85 to 15.37)
Household income in previous year
ⱕ100% of poverty levelb 39.80 (⫺11.14 to 119.95)
101%–200% of poverty level (reference)
201% –400% of poverty levelb ⫺36.21 (⫺54.61 to⫺10.36)c
⬎400% of povertyb ⫺56.27 (⫺69.61 to⫺37.08)c
Gaps in health insurance in previous year 76.66 (13.61 to 174.68)c
Delayed needed health care 15.89 (⫺31.57 to 96.27)
No. of unmet health needs 0.16 (⫺15.30 to 18.43)
Other family members have unmet mental health needs 150.46 (36.46 to 359.72)c
School level of child Preschool (reference)
Elementary school ⫺36.91 (⫺59.70 to⫺1.23)d
Middle school ⫺48.57 (⫺69.40 to⫺13.56)c
High school ⫺31.68 (⫺56.18 to 6.51)
Child is only child in household 6.75 (⫺21.89 to 45.88)
Multiple CSHCN in household ⫺4.31 (.28.71 to 28.42)
Probability of OOP costs, coefficient estimate (95% CI) Medical home components
Has usual doctor and/or source of care 0.139 (⫺0.459 to 0.737)
Care is family-centered ⫺0.267 (⫺0.598 to 0.064)
Receives care coordination services ⫺0.481 (⫺0.836 to⫺0.126)c
Has no problem getting referrals 0.311 (⫺0.429 to 1.052)
Household income in previous year
ⱕ100% of poverty level 0.046 (⫺0.545 to 0.637)
101%–200% of poverty level (reference)
201%–400% of poverty level 0.237 (⫺0.210 to 0.683)
⬎400% of poverty level 0.715 (0.182 to 1.248)c
Predicted OOP costs per $1000 of household income for full sample, $e
19.53
Predicted probability of incurring OOP costs, % 96.6
Predicted OOP costs per $1000 of household income for sample with positive OOP costs, $e
19.98
OOP indicates out-of-pocket; CI, confidence interval.
aAlthough all independent variables were included in the estimation of each model, only the independent variables of
interest are shown. Variables not shown include diagnosis, severity of medical condition, race, ethnicity, family structure,
education level of primary caregiver, immigrant status, and urban location. Full results are available on request from Dr Porterfield.
bAdjusted coefficients to account for variables in both estimation and selection equations. cSignificant at the 99% confidence level.
dSignificant at the 95% confidence level.
out-of-pocket costs with more-severe disabilities (data not shown) and higher household incomes (Tables 3 and 4). Out-of-pocket costs per $1000 of household income decreased as household incomes increased (36% to 56% lower than in households between 100% and 200% of the poverty level for
CSHCN with private insurance in
households above 200% of the poverty level and 45% to 68% lower for CSHCN
with public insurance with similar
characteristics). Compared with
CSHCN with public insurance in house-holds with income between 100% and 200% of the poverty level, children in households with incomes below the poverty line spent significantly more (67% more) in out-of-pocket costs per $1000 of income. Gaps in insurance af-fected out-of-pocket costs only for CSHCN with private insurance; costs
for those children were 77% higher than those for CSCHN without insur-ance gaps (Table 3). Similarly, if other family members had unmet mental health needs, then out-of-pocket costs for CSHCN with private insurance were significantly higher (150%). School level also had a significant influence on out-of-pocket costs for CSHCN with pri-vate insurance. Families spent similar amounts per $1000 of household in-come on CSHCN in preschool and high
school and significantly smaller
amounts for children in elementary school (37% smaller) and middle school (48% smaller). More (36% more) was spent on out-of-pocket medical costs per $1000 of household income for CSHCN with public insur-ance if they were the only children in their households (Table 4).
DISCUSSION
Results from this study highlight the high costs associated with raising CSHCN and suggest that these high costs are mod-erated by a medical home, specifically the receipt of care-coordination ser-vices. Both descriptive and multivariate analyses showed lower out-of-pocket costs for CSHCN who received health care in a medical home setting that in-cluded care coordination.
For the 46% of families with public insur-ance that incurred out-of-pocket costs, affordability was an issue. Affordability also was an issue for children with pri-vate insurance who had gaps in insur-ance or other family members with un-met mental health needs. Previous research showed that the proportion of families reporting that they had prob-lems paying medical bills increased pre-cipitously when spending exceeded 2.5% of income.27 In this analysis, we found
12.2% of families with private insurance and 6.9% of families with public insur-ance spending⬎5% of their income and 3.2% to 4.2% of families spending⬎10% of their income on medical costs for
TABLE 4 Heckman Selection Model for Out-of-Pocket Medical Costs per $1000 of Household Income for CSHCN With Public Insurance
Variablea Value
Change in OOP costs per $1000, estimate (95% CI), % Medical home components
Has usual doctor and/or source of careb ⫺9.53 (⫺25.98 to 10.58)
Care is family-centeredb ⫺1.70 (⫺7.66 to 4.64)
Receives care coordination servicesb ⫺15.18 (⫺20.51 to⫺9.49)c
Has no problem getting referralsb ⫺16.24 (⫺25.85 to⫺5.39)c
Household income in previous year
ⱕ100% of povertyb 67.06 (57.05 to 77.72)c
101%–200% of poverty (reference)
201% –400% of povertyb ⫺45.21 (⫺50.38 to⫺39.50)c
⬎400% of povertyb ⫺68.20 (⫺73.80 to⫺61.40)c
Gaps in health insurance in previous year 3.86 (⫺1.15 to 9.13)
Delayed needed health care 0.41 (⫺5.09 to 6.23)
No. of unmet health needs 1.13 (⫺0.72 to 3.02)
Other family members have unmet mental health needs 3.00 (⫺6.54 to 13.50) School level of child
Preschool (reference)
Elementary school 0.46 (⫺4.41 to 5.58)
Middle school 2.32 (⫺3.12 to 8.06)
High school 4.06 (⫺1.76 to 10.22)
Child is only child in household 35.73 (30.37 to 41.30)c
Multiple CSHCN in household ⫺0.40 (⫺4.23 to 3.58)
Probability of OOP costs, coefficient estimate (95% CI) Medical home components
Has usual doctor and/or source of care ⫺0.040 (⫺0.322 to⫺0.242)
Care is family-centered ⫺0.103 (⫺0.192 to 0.013)d
Receives care coordination services ⫺0.240 (⫺0.333 to⫺0.148)c
Has no problem getting referrals ⫺0.310 (⫺0.476 to 0.145)c
Household income in previous year
ⱕ100% of poverty ⫺0.376 (⫺0.467 to⫺0.285)c
101%–200% of poverty (reference)
201%–400% of poverty 0.100 (⫺0.029 to 0.230)
⬎400% of poverty 0.217 (⫺0.046 to 0.481)
Predicted OOP costs per $1000 of household income for full sample, $e
16.66
Predicted probability of incurring OOP costs, % 46.0
Predicted OOP costs per $1000 of household income for sample with positive OOP costs, $e
36.54
OOP indicates out-of-pocket; CI, confidence interval.
aAlthough all independent variables were included in the estimation of each model, only the independent variables of
interest are shown. Variables not shown include diagnosis, severity of medical condition, race, ethnicity, family structure,
education level of primary caregiver, immigrant status, and urban location. Full results are available on request from Dr Porterfield.
bAdjusted coefficients to account for variables in both estimation and selection equations. cSignificant at the 99% confidence level.
dSignificant at the 95% confidence level.
their CSHCN, amounts that were above generally accepted affordabil-ity standards.28
Clearly, there were financial benefits to families when CSHCN were treated in medical home settings, particularly when care-coordination services were received. A medical home was particu-larly important for children with public insurance, for whom 2 of the 4 compo-nents led to significantly lower out-of-pocket costs.
Although there is no accepted national model of care coordination, many of the elements considered part of this component of the medical home occur in larger pediatric practices that take
a team approach to health care.29,30
Care is coordinated across most, if not all, needed service areas, generally by a nurse or medical social worker.28–32
Nearly one-third of care-coordination encounters were found to reduce health service use, which suggests that the financial benefits of the medi-cal home might accrue to health care providers and insurers as well as
fam-ilies.30 If out-of-pocket costs were
lower with the medical home model, then it is likely that overall costs of medical care also would be reduced.
Professional care coordination is not currently an expense for which
physi-cians’ offices typically can bill insur-ers; therefore, providing care coordi-nation makes sense only if the savings outweigh the additional costs. There is some suggestion in the literature that these savings come not only through the avoidance of high-cost interven-tions for CSHCN30but also through
re-ductions in family social stressors.31
Although Medicare demonstration projects on the medical home currently are testing the cost-effectiveness of this model for older adults, our research suggests that the medical home model for CSHCN also warrants additional study.29 Policy interventions to
sup-port more-widespread adoption of the medical home model might eventually help control the unsustainable upward trend in US health care costs.
Although it might be expected that chil-dren with unmet medical needs or de-lays in receipt of needed medical care would have lower out-of-pocket costs, results in Table 2 suggest a more-complex relationship. Cost of care was the reason cited most often for both unmet needs and delayed care. Insur-ance plan problems, lack of service availability or transportation prob-lems, and lack of school resources were other commonly cited reasons for unmet needs or delayed care.
CONCLUSIONS
Parents might not be the best reporters with respect to the medical home, be-cause survey questions are based more on perceptions than on objective mea-sures.33,34The perspectives of other key
players, especially health care provid-ers, in measuring the extent to which CSHCN receive care in a medical home would be helpful, but such data are not available with the NS-CSHCN.18 It also
would be helpful to know whether imple-mentation of a medical home model would reduce costs for all children or just CSHCN. Unfortunately, most of the research on the costs and savings asso-ciated with care coordination and other aspects of the medical home for children has been conducted with small nonrep-resentative samples. A standard set of questions defining the medical home in national health surveys sponsored by the US government clearly would benefit this area of research and would allow
for more-generalizable results and
more-accurate comparisons of results across studies and across national data sets for different populations.
ACKNOWLEDGMENT
The authors would like to thank Ste-phen J. Blumberg, PhD for his assis-tance in compiling the National Center for Health Statistics data.
REFERENCES
1. Lino M, Carlson A.Expenditures on Children by Families, 2008. Washington, DC: US Department of Agriculture; 2009. Miscellaneous Publication No. 1528-2008. Available at: http://www.cnpp. usda.gov/Publications/CRC/crc2008.pdf
2. Newacheck P, Kim SE. A national profile of health care utilization and expenditures for children with special health care needs.
Arch Pediatr Adolesc Med. 2005;159(1): 10 –17
3. Kuhlthau KA, Hill KS, Yucel R, Perrin J. Finan-cial burden for families of children with special health care needs.Matern Child Health J. 2005;9(2):207–218
4. Bumbalo J, Ustinich L, Ramcharran D, Schwal-berg R. Economic impact on families caring for children with special health care needs in New Hampshire: the effect of socioeconomic
and health-related factors.Matern Child Health J. 2005;9(2 suppl):S3–S11
5. van Dyck P, Kogan M, McPherson M,
Weiss-man G, Newacheck P. Prevalence and char-acteristics of children with special health
care needs.Arch Pediatr Adolesc Med. 2004;158(9):884 – 890
6. Centers for Disease Control and Prevention. National Survey of Children With Special Health Care Needs 2005–2006. Available at:
www.cdc.gov/nchs/slaits/cshcn.htm# 2005CSHCN. Accessed April 21, 2008
7. McPherson M, Arango P, Fox H, et al. A new definition of children with special health care needs. Pediatrics. 1998;102(1): 137–140
8. Looman W, O’Connor-Von S, Ferski G,
Hilden-brand D. Financial and employment prob-lems in families of children with special health care needs: implications for re-search and practice.J Pediatr Health Care. 2009;23(2):117–125
9. Liptak G, Stuart T, Auinger P. Health care utili-zation and expenditures for children with autism: data from U.S. national samples.J Au-tism Dev Disord. 2006;36(7):871– 879 10. Croen LA, Najjar DV, Ray GT, Lotspeich L,
Ber-nal P. A comparison of health care utiliza-tion and costs of children with and without autism spectrum disorders in a large group-model health plan.Pediatrics. 2006; 118(4). Available at: www.pediatrics.org/ cgi/content/full/118/4/e1203
asthma and selected comorbidities. J Asthma. 2001;38(4):363–373
12. Lozano P, Fishman P. VonKorff M, Hecht J. Health care utilization and cost among chil-dren with asthma who were enrolled in a health maintenance organization. Pediat-rics. 1997;99(6):757–764
13. Shimabukuro T, Grosse S, Rice C. Medical expenditures for children with an autism spectrum disorder in a privately insured population.J Autism Dev Disord. 2008;38(3): 546 –552
14. Shattuck PT, Parish S. Financial burden in families of children with special health care needs: variability among states.Pediatrics. 2008;122(1):13–18
15. Kogan MD, Strickland BB, Blumberg SJ, Singh GK, Perrin JM, van Dyck PC. A national profile of the health care experiences and family impact of autism spectrum disorder among children in the United States, 2005–2006.Pediatrics. 2008;122(6). Avail-able at: www.pediatrics.org/cgi/content/ full/122/6/e1149
16. Newacheck P, Inkelas M, Kim S. Health ser-vice use and health care expenditures for children with disabilities.Pediatrics. 2004; 114(1):79 – 85
17. Backer L. The medical home: an idea whose time has come again.Fam Pract Manag. 2007;14(8):38 – 41. Available at: www.aafp. org/fpm/2007/0900/p38.html. Accessed January 10, 2010
18. Nageswaran S, Farel A. Access to a medical home for infants and young children with special healthcare needs. Infant Young Child. 2007;20(3):222–228
19. Strickland B, McPherson M, Weissman G, Van Dyck P, Huang Z, Newacheck P. Access to the medical home: results of the National Survey of Children With Special Health Care
Needs. Pediatrics. 2004;113(5 suppl): 1485–1492
20. Mulvihill BA, Altarac M, Swaminathan S, Kirby RS, Kulczycki A, Ellis DE. Does access to a medical home differ according to child and family characteristics, including special-health-care-needs status, among children in Alabama? Pediatrics. 2007; 119(suppl 1):S107–S113
21. Kogan MD, Strickland BB, Newacheck PW. Building systems of care: findings from the National Survey of Children With Special Health Care Needs. Pediatrics. 2009; 124(suppl 4):S333–S336
22. Evans C, Crawford B. Patient self-reports in pharmacoeconomic studies: their use and impact on study validity. Pharmacoeconom-ics. 1999;15(3):241–256
23. van den Brink M, van den Hout WB, Stiggel-bout AM, van de Velde CJH, Kievit J. Cost measurement in economic evaluations of health care: whom to ask?Med Care. 2004; 42(8):740 –746
24. Bethell C, Read D, Brockwood K. Using exist-ing population-based datasets to measure the American Academy of Pediatrics defini-tion of medical home for all children and children with special health care needs. Pe-diatrics. 2004;113(suppl 4):1529 –1537 25. Andersen R, Newman J. Societal and
individ-ual determinants of medical care utilization in the United States.Milbank Mem Fund Q. 1973;51(1):95–124
26. Cameron AC, Trivedi PK.Microeconometrics Using Stata.Rev ed. College Station, TX: Stata; 2010:564 –565
27. Cunningham PJ, Miller C, Cassil A.Living on the Edge: Health Care Expenses Strain Fam-ily Budgets. Washington, DC: Center for Studying Health System Change; 2008. Re-search Brief No. 10. Available at: www.
hschange.com/CONTENT/1034/1034.pdf. Ac-cessed February 2, 2010
28. Feder J. Statement before the Energy and Commerce Committee, Subcommittee on
Health. Available at: http://republicans. energycommerce.house.gov/Media/file/ Hearings/Health/031709_Health_Affordable_ Coverage_Hearing/031709_Feder_Health_
Affordable_Coverage.pdf. Accessed October 3, 2011. Hearing date was March 17, 2009
29. Backer LA. Building the case for the patient-centered medical home.Fam Pract Manag. 2009;16(1):14 –18. Available at: www.aafp. org/fpm/2009/0100/p14.html. Accessed January 10, 2010
30. Cooley WC, McAllister JW, Sherrieb K, Kuhlthau K. Improved outcomes associated with medical
home implementation in pediatric primary care.
Pediatrics. 2009;124(1):358 –364
31. Antonelli RC, Stille CJ, Antonelli DM. Care co-ordination for children and youth with
spe-cial health care needs: a descriptive, multi-site study of activities, personnel costs, and outcomes.Pediatrics. 2008;122(1). Avail-able at: www.pediatrics.org/cgi/content/ full/122/1/e209
32. McAllister JW, Presler E, Cooley WC. Practice-based care coordination: a medi-cal home essential.Pediatrics. 2007;120(3). Available at: www.pediatrics.org/cgi/
content/full/120/3/e723
33. Mayer ML, Skinner AC, Slifkin RR. Unmet need for routine and specialty care: data from the National Survey of Children With
Special Health Care Needs.Pediatrics. 2004; 113(2). Available at: www.pediatrics.org/ cgi/content/full/113/2/e109
34. Newacheck P, Hughes D, Hung YY, Wong S, Stod-dard J. The unmet health needs of America’s
DOI: 10.1542/peds.2010-1307 originally published online October 17, 2011;
2011;128;892
Pediatrics
Shirley L. Porterfield and LeaAnne DeRigne
Services
Updated Information &
http://pediatrics.aappublications.org/content/128/5/892
including high resolution figures, can be found at:
References
http://pediatrics.aappublications.org/content/128/5/892#BIBL
This article cites 24 articles, 10 of which you can access for free at:
Subspecialty Collections
_sub
http://www.aappublications.org/cgi/collection/child_health_financing
Child Health Financing
http://www.aappublications.org/cgi/collection/advocacy_sub
Advocacy
http://www.aappublications.org/cgi/collection/medical_home_sub
Medical Home
_sub
http://www.aappublications.org/cgi/collection/community_pediatrics
Community Pediatrics
following collection(s):
This article, along with others on similar topics, appears in the
Permissions & Licensing
http://www.aappublications.org/site/misc/Permissions.xhtml
in its entirety can be found online at:
Information about reproducing this article in parts (figures, tables) or
Reprints
http://www.aappublications.org/site/misc/reprints.xhtml
DOI: 10.1542/peds.2010-1307 originally published online October 17, 2011;
2011;128;892
Pediatrics
Shirley L. Porterfield and LeaAnne DeRigne
Health Care Needs
Medical Home and Out-of-Pocket Medical Costs for Children With Special
http://pediatrics.aappublications.org/content/128/5/892
located on the World Wide Web at:
The online version of this article, along with updated information and services, is
by the American Academy of Pediatrics. All rights reserved. Print ISSN: 1073-0397.