A web-oriented framework for graph
simplification and interactive visualization
Guoyong Mao
a,b, Ning Zhang
c,Jiang Xie
da Department of Electronic Information and Electric Engineering, Changzhou Institute of Technology, Changzhou
213002, China Email: [email protected]
b German Research School for Simulation Science, Aachen, 52062,Germany
Email: [email protected]
c Business School, University of Shanghai For Science and Technology, Shanghai 200093,China
Email: [email protected]
d School of Computer Engineering and Science, Shanghai University, Shanghai 200072,China
Email: [email protected]
Abstract— The web-based visualization of large graph data is attracting much attention and brings new challenges to researchers, especially in visualization speed and data scale. Based on the idea of connected dominating set, we introduce the representative dominating sub graph (RDSG) to quickly simplify large graph, while still keeping the rep-resentative structure and features of the original graph for overview purpose. An interactive visualization architecture is implemented using AJAX,DWR and other web-related technologies. Only the simplified data is displayed in the client. Interaction with this data is implemented using the rich functionalities of plug-in, and remote interaction is realized using asynchronous graph data transfer between client and remote server. User can repeatedly expand the simplified graph directly from the web browser to find de-tails of selected nodes from original graph. Our experiments show that this method is suitable for interactive visualization of popular networks, like bioinformatic network, social communication network and the internet, with up to tens of thousands of nodes, and even more nodes when multilevel simplification is used.
Index Terms— web, representative dominating sub graph, large graph data, graph simplification, interactive visualiza-tion
I. INTRODUCTION
O
VER the past few years, the fast development in bandwidth and functions of web browser has made rich internet applications (RIAs) a new trend, which is capable of providing interactive and responsive interfaces through a web browser. Many web-based versions of soft-ware emerge along with their desktop counterparts. This shift has a potential benefit for resource-intensive graph visualization, and applications which take advantage of the rich-internet paradigm are beginning to emerge for visualization of graph and network data.This work is partially supported by Natural Science Fund of China (Grant No:70971089), Jiangsu overseas Research & Training Programs for University Prominent Young & Middle-Aged Teachers and Pres-idents, and Ph.D. Programs Foundation of Ministry of Education of China (Grant No:20113108120022)
Many tools for visualizing graphs have previously been developed. Some of these tools run in a web-browser [1]–[4], while others are scalable for up to hundreds of thousands of nodes [5]–[8]. However, based on our anal-ysis of existing interactive web-based graph visualization systems, we find that their main scalability limitation is due to the fact that most of them implement some form of a thick client solution and subsequently need to load the entire graph onto the client machine. In addition to large startup costs, this limits the maximum size of visualized graphs due to memory limitations of the browser or the client computer.
This paper presents a web-oriented framework for interaction with large graphs in a web browser with the help of the very popular flash plug-in (here ‘large’ means the scale is beyond the visualization limit of the browser). Our framework follows the common visual information browsing principle: “Overview first, zoom and filter, then details on demand” [9] for exploration of large information spaces. This framework supports information discovery in two phases. Firstly, by enabling users to visualize and interact with the entire graph, our framework provides a “representative dominating sub graph” for simplification purpose. Secondly, interaction is used to mold entire data into the user’s own mental model, which serves as a useful starting point for finding relations between nodes for more fine-grained analysis.
II. RELATEDWORKS
Graphs are commonly used to model relational infor-mation that arises in numerous areas, including web anal-ysis, relational databases, biochemical networks, telecom-munication networks, financial analysis, software engi-neering and geographical studies.
In a graph, elements are the nodes and relations or links are the edges. The visualization of graph data should effectively convey the relational information to the users. However, if we want to use web browser to visualize graph data, we cannot download the full large graph to the client browser due to browser limitations, we must simplify the graph first. It is a preprocessing step to reduce the amount of data for visualization purposes. Many research work has been done in this field.
There are two kinds of filtering methods to simplify the graph. Stochastic filtering approaches statistically sample the graph, scaling well and preserving the expectation of various graph characteristics [10]. For example, in [11], the stochastic and focus-based filtering schemes are used to simplify large graphs, in order that the scale of data can meet the requirements of visualization environment. Using random node/edge selection and random walks, the scale of data is reduced to 15% of the original graph [12]. The limitation of this method is: if most nodes are of least degree, stochastic filtering can destroy connectivity and other features. Deterministic filtering methods remove edges based on a metric defined on graph elements. One commonly used metric is “betweenness centrality (BC)” [13], which indicates how often a node lies on the shortest communication path between other nodes. Girvan and Newman [14] compute BC for edges instead of nodes, and remove the highest BC edges from a graph to isolate and cluster its subnetworks. Examples of using BC to simplify the graph include [15]–[17]. However, there are several limitations of BC method. First, only edges are filtered using this method, the nodes number remains the same as the original graph. Second, this method relies on an all-pairs shortest path computation, which means this method can only be applied to connected graph. Third, the computation of all-pairs shortest path is very time-consuming, it takes O (n3) time with Floyd-Warshall algorithm, and O (nm) time with Brandes’ algorithm [18] on unweighted graphs (n is the number of nodes and m the number of edges). It is not suitable for web system, as we cannot expect the user to wait 15 minutes or more before the browser. Jia et al. [19] introduces a BC approximation method by selecting only some of the highest degree hub nodes, thus reducing the running time to O(( m + n) log n) for unweighted graphs, and O(( m + n) log2 n ) for weighted graphs. However, this approximation method is only applicable to social and other scale-free networks. Some clustering algorithms can also be used as deterministic methods to simplify graph [20]–[22], but these methods are also very time-consuming and hence not suitable for implementation in web-oriented system.
Based on our observation, the above mentioned meth-ods either do not scale well to various kinds of graphs,
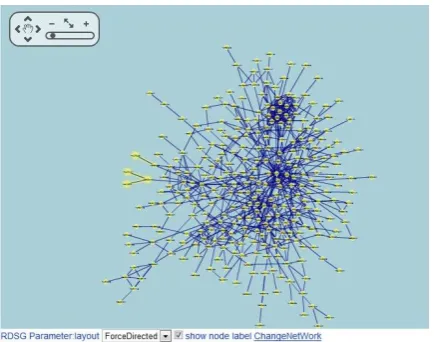
Figure 1. less zoomed bitmap image of a part of a graph in force-directed layout
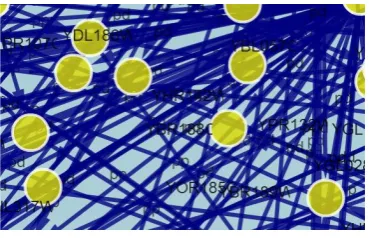
Figure 2. much zoomed bitmap image of part of the graph in force-directed layout
or are very time-consuming.
There is another web-based visualization method in which simplification is not necessary, for example, WiGis [7] and Google Maps [23]. WiGis is a framework for interactive visualization of large graphs over the web. It provides user interaction with hundreds of thousands of nodes through the use of bitmap graph representations streamed from a remote server. The graph data is stored and processed on a powerful remote server. The server continuously produces bitmap images and asynchronously sends them to the client’s browser, just the way as Google Map. However, there are several limitations for this image-based framework. Firstly, it needs a very powerful server; Secondly, the graph is displayed natively in the browser, so this implementation cannot make use of rich functionality provided by plug-ins, especially Flash. Thirdly, and maybe most importantly, for some large graphs, the bitmap of some part of the graph can not clearly illustrate the relations of nodes, as we can not extract useful information from the bitmap. If we zoom in too much, we can not see the neighbors of nodes; if we zoom out less, there are too many nodes and edges mixed up there. In both cases, it is almost impossible to find relations between nodes, as shown in Figure 1 and Figure 2.
Figure 3. dominating set (yellow nodes) and the connected dominating set (yellow nodes and red edges)
visualization, in which the key points in a map are in fixed location. While in graph visualization, the nodes can be randomly placed according to different layouts, and users can manually move the nodes or edges, or even temporarily remove some nodes or edges for better presentation.All these functions can not be implemented in this image-based method.
Many RIA implementations provide functionality na-tively in the browser through a combination of DHTML and AJAX. Examples of native RIA’s include Google Maps, the JSP and ASP.net implementations of Tom Sawyer Visualization [3]. Other RIAs are implemented using some form of browser plug-in, for example Java Ap-plets, Adobe Flash or Microsoft Silverlight. The majority of graph visualization tools available on the web are plug-in based, e.g. [1]- [2], because they can provide rich func-tionality such as object support and dynamic components. We use Flash plug-in in our visualization framework, because we use browser to display the sub graph instead of the image. Hence,our visualization framework would still need the rich functionalities of the plug-in.
III. THESIMPLIFICATIONMODEL
In this section, we propose a new filtering model based on the representative dominating sub graph.
A. The Dominating Set
In graph theory, a dominating set DS for a graph G = (V, E) is a subset D of V such that every vertex not in D is joined to at least one member of D by some edges [24]. The connected dominating set problem is defined as follows: find a minimum size subset S of vertices, such that the sub graph induced by S is connected and S forms a dominating set [25]. Examples of dominating set and connected dominating set are shown in Figure 3.
Connected dominating set are useful in the computation of routing for mobile ad-hoc networks. In this application, it is used as a backbone for communications, which means the structure and important nodes in the communication network are kept.
From Figure 3 we see that the connected dominating set is a sub graph of G. However, this sub graph can hardly be considered as a good overview of the original
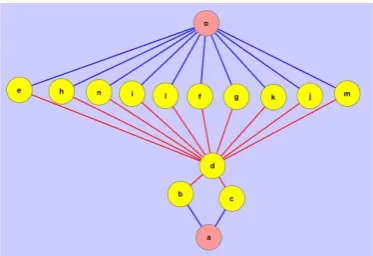
Figure 4. RDSG of Figure 3
graph, as too many key nodes that lie in the skeleton of G are excluded (for example, node c and the 9 nodes parallel to nodef). Now we bring forward the concept of the representative dominating sub graph for visualization purpose.
B. The Representative Dominating Sub Graph
Definition 1: representative dominating sub graph for a graph G = (V, E) is a subset D of V such that every vertex not in D is joined to at least one member of D by some edges, and a subset L of E that lie between nodes in D.
Reference 1: the representative dominating sub graph is not unique for a given graph G.
Reference 2: G is a representative dominating sub graph of itself.
Definition 2: a representative dominating sub graph is constructed as follows: add the node with the biggest degree to set D, and add its neighboring nodes that have neighbors not in neighbors of D, until every node not in D is joined to at least one member of D, connect nodes that has edges between them.
The node with the largest degree is selected as the starting node, because the degree of nodes can in some way show the importance of nodes in centralized graph. In other words, the node with larger degree is considered as more representative. If there are more than one node with the largest degree, then the node with smaller sum of degree of neighboring nodes is selected as the starting node (say node A), because being connected to others that are not well connected makes node A more powerful, as others are dependent on node A – whereas well connected nodes are not.
Based on the idea mentioned above, we can generate RDSG of graph. Some examples are shown in Figure 4 and Figure 5.
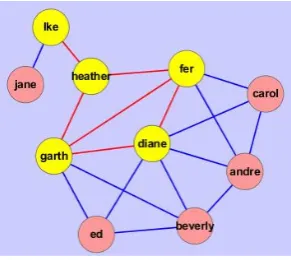
Figure 5. example of RDSG
From Figure 4 and Figure 5 we can get three results: first, all leaf nodes are excluded from G. Second, if one node and its neighboring nodes constitute a complete graph, then this node and the edges connected to this node can be excluded. (For example, nodeedand nodecarolin Figure 5). Third, if one node and all its neighbors can be reached from one of its neighbors, then this node and the edges connect to this node can be excluded. (For example, node andre and nodebeverly in Figure 5). These results can be easily explained from definition 2, as neighbors of these removable nodes can all be found in neighbors of node that connect them. In this way, many nodes and edges can be removed to simplify the graph. For example, 2 among 15 nodes and 12 among 24 edges are removed in Figure 4, and 5 among 10 nodes and 12 among 18 edges are deleted in Figure 5. We will discuss how to find RDSG in next subsection.
C. The RDSG algorithm
Following Definition 2, the RDSG algorithm can be described using the following steps.
1) Remove the repeated edges between 2 nodes and keep only one edge;
2) Remove the self-looped edges of each node (if exist);
3) Sort the nodes by degree in descent order, if more than one node has the largest degree, select the one with small sum of degrees of neighboring nodes; 4) Setup list1 and list2, list1 is used to determine if
all nodes are processed, list2 is used to put the final nodes;
5) Select the root node as node s1;
6) If the size of list1 is smaller than the number of nodes, do the following steps;
7) Traverse (s1);
8) Add s1 and links of s1 to list1; 9) Add s1 to list2;
10) For all nodes k exclude s1 in list1 (k=1, 2,. . . , list1.size-1), do step 11;
11) If node k is in list1, but its link is not in list1, add it to list2;
12) For all nodes i exclude s1 in list2, do step 13; 13) Traverse (node i) (i=1, 2, . . . ,list2.size-1); 14) Go to step 6;
Figure 6. original graph
Figure 7. middle graph
With these steps, we can get the dominating nodes of a graph that are added into list2. By connecting these nodes with edges that already exist in the original graph; we can get the final sub graph.
We use Figure 6, Figure 7 and Figure 8 to illustrate the algorithm. Notice that in RDSG, the name of edges and direction of edges are all omitted, as this sub graph is only for simplification purpose, it just provides an overview of the original graph.
Figure 6 is the original graph, Figure 7 is the middle graph with duplicated edges and self-loops deleted in accordance with step 1 to step 3, and Figure 8 is the final sub graph. From Figure 7 we know that node 1 and node 2 have the largest degree of 4, the sum of degrees of neighbors of node 2 is 9, smaller than 10 of node 1. Hence, node 2 is treated as the start node. The variation of content in list1 and list2 are shown in table I. The loop will not finish until the size of list1 reaches the number of nodes, that is, all nodes are put into list1. The dominating nodes are in list2 now, and we can get
TABLE I.
VARIATION IN LIST1AND LIST2
List1 List2
2 2
2,1,4,11,14 2,1,4
2,1, 3,6,7,4,5,12,11,14 2,1,3,6,4,5 2,1, 3,9,10,6,8,7,4,5,13,12,11,14 2,1,3,6,4,5 2,1, 3,9,10,6,8,7,4,5,13,12,11,14,15 2,1,3,6,4,5,15 2,1, 3,9,10,6,8,7,4,5,13,12,11,14,15,16 2,1,3,6,4,5,15
TABLE II.
BCAND SIMPLIFICATION INFORMATION
ID BC Kept
heather 0.39 Y garth 0.23 Y
fer 0.23 Y
lke 0.22 Y
diane 0.1 Y
andre 0.02 N beverly 0.02 N
jane 0 N
carol 0 N
ed 0 N
Figure 8 by connecting edges that exist between those connectors.
D. Analysis of algorithm
The RDSG algorithm is similar to a Breadth-First-Search that starts from the root node with the largest degree, the time complexity of this algorithm is O (m+n), where n is the number of nodes and m the number of edges. This algorithm can be applied to both connected graph and unconnected graph, as in connected graph, all nodes can be covered from root node. While in unconnected graph, there are at least 2 root nodes, each corresponding to a connected graph, and each root node will be selected as the start node until all nodes are processed in RDSG algorithm.
As mentioned in section II, BC is usually used to judge the importance of nodes. We also use it to judge if important nodes are kept after graph simplification. The detailed BC and simplification information corresponding to Figure 5 are illustrated in table II, where dianeis the node with the lowest BC that are kept after simplification. So we can see that nodes with top 5 high BC values are all kept . We also use this algorithm in several kinds of large graphs, for example, sample data of Cytoscape software, and data generated using BRITE software [27]. The results indicate that more than 93% of the important nodes with high BC values are kept after simplification.
E. Higher level RDSG
Through the above mentioned algorithm, users can use the nodes to find their direct neighbors so as to get relations of each node. However, if the graph has too many nodes and edges, the simplified graph may still have lots of nodes and edges. It is necessary to simplify it again. Hence, we introduce the notion of high level RDSG, that is, the second level, the third level, and so on. If we use the simplified graph as the input we will get
Figure 9. Architecture of the visualization framework
the second level RDSG, or RDSG-2; if we use RDSG-2 as the input, we get the third level RDSG, or RDSG-3.
IV. ARCHITECTURE OFVISUALIZATIONFRAMEWORK
We should notice that this visualization framework is not specially designed to use browser to take the place of desktop tools to visualize large graphs, as generally the latter can do the job better than a web browser. We care more about visualizing data that are not locally existed, for example, a network query via the web browser will return some data, these data are dynamic, we care about how to quickly visualize them and interact with them when the scale of these data is beyond the requirements of visualization environments.
The architecture of the visualization framework is shown in Figure 9. In the left side of GUI client, a network query is made to the server. In the left side of server, a network query can be made to a remote database through different clients, for example, SOAP client, REST client, or pure Java Client. The Server then use the returned message to build the original graph. If this graph is large, RDSG algorithm will be used to simplify this graph, and return the resulted graph to client browser in JSON object format [28]. Users can use layout algorithm to rearrange the graph, and use interaction algorithm to interact with the database of the original graph to get the relation graph. This relation graph is also transferred to the client in JSON object format.
them is: we care about relations between nodes, not the position of nodes, as the nodes can be randomly placed. While in a map, we care about the geography position of places.
The client is implemented using Cytoscapeweb, a web-based network visualization tool modeled after Cytoscape. It uses flash as the browser plug-in. As JavaScript is well supported in flash plug-in, many popular JavaScript related technologies, such as AJAX and JQuery, can be implemented in our framework to facilitate the extraction of visualization information from returned data, and to make the layout and interaction algorithms easier to implement.
The Server is implemented using Java. We use DWR [29], an RPC library to call Java functions in the Server from JavaScript in the Client. To facilitate extraction of relation graph, we use database to save the large original graph, the extraction operation from the client is actually implemented using the SQL language.
A. Interaction
Once the simplified graph is drawn from the returned data, we can use the JavaScript API to interact with it. It is done through the ready callback function, which is called when Cytoscapeweb has finished drawing the graph. There are two types of interaction, the first is about interaction with the current drawing, or in other words, it interacts with data already in the client side. For example, using mouse to zoom in and zoom out of graph, to change the attributes of nodes and edges, the layout of graph, the color of background, and so on. The second is about interaction with the server again, in this way, we send the information of nodes to the server, and get relation graph of these nodes. This kind of interaction is done by adding listeners to nodes and edges in the graph. For example, when we select a node or nodes, the JavaScript event named “handle select” will be triggered, and a corresponding java function in the server side will be invoked for users to find relation graph of these nodes and send the relation graph back to the client.
V. EVALUATION
Now that we have described our technique for enabling interactions with large graphs on the web, we focus on an evaluation of the technique in terms of feasibility. That is, whether it is possible to view large graphs that can not be directly viewed via the web browser.
A. Test environment
All experiments are performed on a 64-bit Lenevo S20 workstation with an Intel Xeon 2.63GHz quad core processor, 8GB of RAM, an Nvidia Quadro FX5800 video card and a serial ATA hard drive with 7200 rpm. The operating system is Windows 7 ultimate SP1. The JDK version is 6u24 64bit, the web server is Apache tomcat 6.0.26 64bit, the version of flash is 11.1 and the database is MySql 5.5.15 64bit. The experiment is done on all
Figure 10. A RDSG with 371 nodes and 657 edges extracted from graph with 3025 nodes and 6888 edges
popular browsers, including Internet Explorer 8.0, Internet Explorer 9.0 32bit, Internet Explorer 9.0 64bit, Mozilla Firefox 5.0 and Google Chrome.
B. Test result
The test data is dynamically generated from PSE-Bio [30]- [31], a problem solving environment using only the web browser for query of public bioinformatic databases and for interactive visualization of the returned data. There are three layers in PSE-Bio, as shown in Figure 6. In the server layer, NCBI and Intact web service clients are integrated into PSE-Bio to query NCBI and Intact database [32]- [33]. Network query can sometimes return very large data. Hence, it is not applicable to transfer all the data to the client and visualize them using the browser. From the experiments we know that if the graph contains more than 4000 edges or nodes, the browser will become very slow to respond if we use mouse to interact with the graph. Similarly, the flash plug-in will crash when the graph has edges or nodes more than 5000. For graph with 3025 nodes and 6888 edges that can not be directly visualized in the browser as shown in Figure 1, the corresponding RDSG that only contains 371 nodes and 657 edges is illustrated in Figure 10. The relation of selected nodes can be viewed through the relation graph in Figure 11. Compared with the image-based method as shown in Figure 2, this one is more suitable in analyzing the relations of large graph data.
We also apply RDSG on other graphs, the result is listed in table III. We can see that this RDSG-based framework can be used in visualizing of graphs with more than 20000 edges or nodes, and even larger if higher level RDSG is used.
Figure 11. the relation graph of selected nodes in Figure 10
TABLE III.
RESULT OFRDSGON DIFFERENT GRAPHS
graph Number 1 2 3 4 5
Nodes of original graph 10000 19906 7403 23540 430 Edges of original graph 10000 38715 19999 71307 2090
Average link 1 1.94 2.70 3.03 4.86
Nodes of RDSG 4583 2865 907 1675 16
Edges of RDSG 4274 3866 1432 4569 12 Node reduction rate (%) 54.2 85.7 87.7 92.9 96.3 Edge reduction rate (%) 57.3 90.1 92.8 93.6 99.4
1.9. We also find that bigger average link generally results in better simplification effect.This is because bigger av-erage link generally means more nodes and edges can be removed in RDSG algorithm. Hence, this framework is more suitable for visualizing of graphs with big average link, for example, the graphs from bioinformatic network, social communication network and the Internet.
VI. CONCLUSIONS
The main contribution of this paper is a web-based technique to visualize large graphs that can not be directly displayed in a user’s web-browser. We have presented an argument for our choice of a flash plug-in based implementation over a pure html approach and our choice of returning simplified graph over image-based graph. We have presented a novel algorithm to simplify the large graph and an interactive visualization framework to use the simplified graph as an overview of large graph, so as to find detailed information of nodes in the server with mouse interactions.
The approach used in our framework has three limita-tions. Firstly, as flash plug-in is used in the client browser and even the latest version of it can not accommodate very large data, while the simplified graph may still be large, the scale of this framework is limited compared with other visualization framework like WiGis. Secondly, this frame-work is not very suitable for all kinds of large graphs. The RDSG algorithm is not very effective for large graphs with small average link. Thirdly, a more effective and smooth interaction approach between client and server should be developed in finding relations in original graph,
while it is still under development now; For the first issue, we can expect the browser and the plug-in to be more powerful, and it is the trend now; For the second issue, a possible improvement over the current algorithm should be considered. For the last issue, we can speed up the extraction algorithm through parallelization, and reduce the data being transferred through compression.
ACKNOWLEDGMENT
The authors wish to thank the bioinformatics research group led by Prof Wu.Zhang in Shanghai University, The authors are also grateful to the anonymous referees for their valuable comments and suggestions to improve the presentation of this paper.
REFERENCES
[1] C.T.Lopes, M.Franz, F.Kazi, S.L.Donaldson, Q.Morris, and G.D.Bader, “Cytoscape web: an interactive web-based network browser,” Bioinformatics, vol. 26, no. 18, pp. 2347–2348, 2010.
[2] C.M.Danis, F.B.Viegas, M.Wattenberg, and J.Kriss, “Your place or mine?: visualization as a community compo-nent,” in CHI 2008: Proceeding of the twenty-sixth an-nual SIGCHI conference on Human factors in computing systems, 2008, pp. 275–284.
[3] http://www.tomsawyer.com/, “Tom sawyer visualization,” 2009.
[4] http://www.touchgraph.com/navigator/, “Touchgraph navi-gator,proprietary online application.”
[5] D. Auber, “Tulip : A huge graph visualisation framework,” in Graph Drawing Softwares, 2003, pp. 105–126. [6] P.Shannon, A.Markie, O.Ozier, N.Baliga, J.Wang,
D.Ramage, N.Amin, B.Schwikowski, and T.Ideker, “Cytoscape: a software environment for integrated models of biomolecular interaction networks,” Genome Res, vol. 13, no. 11, pp. 2498–2504, 2003.
[7] B.Gretarsson, S.Bostandjiev, J.Donovan, and T.Hollerer, “Wigis: A framework for scalable web-based interactive graph visualizations,” in 17th International Symposium, Graph Drawing 2009, 2009, pp. 22–25.
[8] A.S.Ali, A.S.Hussein, M.F.Tolba, and A.H.Yousef, “Large-scale vector data visualization using high performance computing,” Journal of Software, vol. 6, no. 2, pp. 298– 305, 2012.
[9] B.Shneiderman, “The eyes have it: A task by data type taxonomy for information visualizations,” in the 1996 IEEE Symposium on Visual Languages, 1996, p. 336. [10] P.Wu and S.Li, “Social network analysis layout algorithm
under ontology model,”Journal of Software, vol. 6, no. 7, pp. 1321–1328, 2011.
[11] D.Rafiei and S.Curial, “Effectively visualizing large net-works through sampling,” in IEEE Visualization, 2005, p. 48.
[12] J. Leskovec and C. Faloutsos, “Sampling from large graphs,” in the 12th ACM SIGKDD international confer-ence on Knowledge discovery and data mining, 2006, pp. 631–636.
[13] L. C. Freeman, “A set of measures of centrality based upon betweenness,”Sociometry, vol. 40, no. 1, pp. 35–41, 1977. [14] M.Girvan and M.E.J.Newman, “Community structure in social and biological networks,” vol. 99, 2001, pp. 8271– 8276.
[16] D.Auber, Y.Chiricota, F.Jourdan, and G.Melan, “Multiscale visualization of small world networks,” inIEEE Symposi-tion on InformaSymposi-tionVisualisaSymposi-tion, 2003.
[17] B.Lee, C. Parr, C.Plaisant, B. Bederson, V. Veksler, W. Gray, and C.Kotfila, “Treeplus: Interactive exploration of networks with enhanced tree layouts,” IEEE Transac-tions on Visualization and Computer Graphics, vol. 12, no. 6, pp. 1414–1426, 2006.
[18] U.Brandes, “A faster algorithm for betweenness centrality,”
Journal of Mathematical Sociology, vol. 25, pp. 163–177, 2001.
[19] Y.Jia, J.Hoberock, M.Garland, and J.Hart, “On the visu-alization of social and other scale-free networks,” IEEE Transactions on Visualization and Computer Graphics, vol. 14, no. 6, pp. 1285–1292, 2008.
[20] J.Chen, A.Song, and W.Zhang, “Hybrid clustering meth-ods based on adaptive k-harmonic means,” International Journal of Advancements in Computing Technology, vol. 4, no. 6, pp. 10–23, 2012.
[21] C.Shao and Y.Yang, “Distance-preserving som: A new data visualization algorithm,”Journal of Software, vol. 7, no. 1, pp. 196–203, 2012.
[22] J.Chen, A.Song, and W.Zhang, “Improving the perfor-mance of clustering methods via two-step feature selec-tion,”International Journal of Information Processing and Management, vol. 3, no. 3, pp. 1–11, 2012.
[23] http://maps.google.com, “Google maps.”
[24] R.B.Allan and R.laskar, “On domination and independent domination numbers of a graph,” Discrete Mathematics, vol. 23, no. 2, pp. 73–76, 1978.
[25] E.Sampathkumar and H.B.Walikar, “Assessing the vulner-ability of dtn data relaying schemes to node selfishness,”
The connected domination number of a graph, vol. 13, no. 6, pp. 607–613, 1979.
[26] S.Guha and S.Khuller, “Approximation algorithms for con-nected dominating sets,”Algorithmica, vol. 20, no. 4, pp. 374–387, 1998.
[27] A.Medina, A.Lakhina, I.Matta, and J.Byers, “Brite: An ap-proach to universal topology generation,” inIn Proceedings of the International Workshop on Modeling, Analysis and Simulation of Computer and Telecommunications Systems-MASCOTS’01, 2001, pp. 346–353.
[28] http://www.json.org, “Javascript object notation.” [29] http://directwebremoting.org, “Direct web remoting.” [30] J.Xie, G.Mao, S.Zhang, and W.Zhang, “An integrated
com-puting environment for bio-molecular networks,”Journal of Convergence Information Technology, vol. 5, no. 4, 2010.
[31] G.Mao and J.Xie, “Svg-based interactive visualization of pse-bio,” inLecture Notes in Computer Science, vol. 5938, 2010, pp. 288–294.
[32] http://www.ncbi.nlm.nih.gov, “National center for biotech-nology information.”
[33] http://www.ebi.ac.uk/intact/, “Official website for intact.”
Guoyong Mao received his M.S. degree in System analysis and Integration from University of Shanghai for Science and Technology, China in June 2001 and his Ph.D. degree in computer science from Shanghai University, China in May 2006. He is an associated professor working in Changzhou Institute of Technology. Now he is a visiting researcher at German Research School for Simulation Science.His current research interest includes data visualization, complex network and parallel computing.
Ning Zhang is a professor working in business school, Uni-versity of Shanghai for Science and Technology, her current research interest includes social communication network.