Abstract—Focusing on the impact of business model (BM) on
supply chain management (SCM), the paper takes a case study approach with six global apparel value networks to quantify the complexity created by the BM of a value network and to assess how SCM orientations differ among value networks owing to internal and external BM complexities. Results reveal a clear distinction among value networks in terms of BM complexities. Further, there are significant differences in areas of focus in SCM between high complex and less complex group proving that BM complexity matters significantly to SCM.
Index Terms—Business model complexity, supply chain,
apparel case study, value networks.
I. INTRODUCTION
“A good business model answers Peter Drucker's age-told questions: Who is the customer? And what does the customer value? It also answers the fundamental questions every manager must ask: How do we make money in this business? What is the underlying economic logic that explains how we can deliver value to customers at an appropriate cost?” [1]. Further, literature on BM reveals that it is a system of interdependent activities that transcends the focal firm and spans its boundaries [2]. Thus, the business model (BM) is the logic of a firm that reveals why the firm is in its business, and how it delivers and appropriates value. Majority of firms no longer do business solely, rather they perform as networks, with the expansion of outsourcing. Consequently, the BM has become a property of a value network rather than a property of a firm.
BM and the strategy of a firm are not mutually exclusive but they are interconnected [3]. Although there are diverse arguments about how they relate to each other [3], SCM relates with both concepts. In real terms, supply chain (value network as it is much appropriate to the current context [4]) is the unit that operationalizes the BM and the strategy for a particular market segment. Whether the BM is the outcome of the strategy or vice versa [5], value networks execute the strategic choices made by both these concepts. Thus, there should be a considerable impact from the BM to SCM of a value network.
Complexity is an attribute that exists in any system. BM also inherits a systemic view since it is the architecture of strategic choices of a firm or a value network [6], [7]. Thus, BM of a value network should create complexity as a result of the choices made in order to deliver and appropriate value.
Manuscript received August 26, 2013; revised November 7, 2013. M. Nayanapriya Gunawardhana is with the Department of Industrial Engineering & Management, Tokyo Institute of Technology, 2-12-1-W9-61, Ookayama, Meguro-ku, Tokyo, 152-8552 (e-mail: gunawardhana.n.aa@m.titech.ac.jp).
Literature on complexity states that complexity is a result of multiplicity and diversity of elements in a system, and connectivity between the elements of that system. When BM is viewed as a system or architecture, it should inherit a certain level of complexity due to the multiplicity, diversity, and connectivity of strategic choices made in creating the particular BM.
Managing complexity of any system is quite important so that a great level of focus has been given in management literature to complexity management. This is prominent in marketing, SCM, and operations management [8], but the level of importance given to the complexity of a BM is quite low. So, we aim to answer the question, „how a value network can utilize SCM to manage the complexity created by the BM of that particular value network?‟ Going deeper, the paper recognizes BM complexity (BMC) as internal and external.
Contributions from the paper are two folds. First, the paper outlines a methodology to map a BM in a way that enables quantifying the complexity associated with the BM. To our knowledge this is novel for the BM concept, although product, portfolio, and supply chain complexities have been assessed through graphical representations using structure diagrams. Literature recommends complexity assessment using graphical assessment methods since graphical methods take qualitative data to quantify complexity [8]. Second, the paper links the concept of BM with SCM which is another novel approach offering valuable managerial implications
The next section outlines the conceptual framework with reference to literature and makes three propositions. Section three outlines the methodology. Section four offers results (findings) and related discussions while section five concludes the paper.
II. CONCEPTUAL FRAMEWORK
A. BM Definition and Components
Since BM concept is novel and still emerging, conscience and concreteness of its definition and components are not yet stabilized [2], [3], [7]. Heterogeneous definitions in BM literature prove this unanimously. Some definitions found in literature are given in Table I. This ambiguity is the same when it comes to BM components. Reference [9] finds 42 BM components in literature and proposes that they can be combined to form 20 distinguished components in an attempt to find BM components. A later attempt extending the research of reference [9] finds 26 diverse BM components in 48 related definitions and claims that only 5 components occurs in more than 50% of definitions [10]. Table II provides frequencies that those 26 components occur (frequencies were calculated based on Reference [10] and only the components showing a frequency more than 30% are
M. Nayanapriya Gunawardhana, Sadami Suzuki, and Takao Enkawa
included in the table ).
TABLEI:SOME DEFINITIONS FOR BUSINESS MODEL
Literature
source Definition
Osterwald er et al., 2005 [37]
a conceptual tool that contains a set of elements and their relationships and allows expressing the business logic of a specific firm. It is a description of the value a company offers to one or several segments of customers and of the architecture of the firm and its network of partners for creating, marketing, and delivering this value and relationship capital, to generate profitable and sustainable revenue streams
Timmers, 1998 [35]
an architecture for the product, service and information flows, including a description of the
various business actors and their roles; and a description of the potential benefits for the various business actors; and a description of the sources of revenues
Amit & Zott, 2001 [36]
The BM depicts “the content, structure, and governance of transactions designed so as to create value through the exploitation of business opportunities”
In order to be comprehensive and concrete, we searched for a well-established BM components framework with the below selection criteria; 1) a framework that comprehensively define components with constituent elements, 2) a framework that has evolved with time but
maintaining the consistency on definitions and specifications, 3) a framework that has been published and well cited. The BM ontology proposed in (reference [11]) met these criteria well as it has a concrete framework with definitions and elements, it has been published in journals, and books [12]. The validity of the components proposed (in reference [11]) enhances since almost all of the components appear well in BM literature (with reference to the occurrence % in Table II).
TABLEII:OCCURRENCES OF BMCOMPONENTS IN LITERATURE
BM component Frequency
(Occurrence %) Partners/ actors/ suppliers/ value network/ alliances 66.7 % Customers/ customer relationship/ interface 58.3 % Value proposition/ offering (products and services) 54.2 % Processes/ Activities/ value chain 52.1 %
Revenue 50.0 %
Differentiation/ cost leadership/ target market/
pricing 39.6 %
Resources/ assets 33.3 %
The adopted BM framework consists of four pillars and nine building blocks (components) and constituent elements as illustrated in Table III.
TABLEIII:BUSINESS MODEL PILLARS,COMPONENTS AND ELEMENTS (ATTRIBUTES)
BM Pillar BM Component Description Attributes
Product
Value proposition Gives an overall view of a company‟s bundle of products and services Value (level) Price level Reasoning
Customer interface
Target customer Describes the segments of customers a company wants to offer value to Criteria for segmentation Distribution channel Describes the various means of the company to get in touch with its customers Channel (link) Relationship Explains the kind of links a company establishes between itself and its different
customer segments Mechanism
Infrastructure management
Value configuration Describes the arrangement of activities and resources Activity Actors/ resources Core competency Outlines the competencies necessary to execute the company‟s business model Capabilities Partner network Portrays the network of cooperative agreements with other companies necessary
to efficiently offer and commercialize value
Actors
Level of integration
Financial Aspects
Revenue model Describes the way a company makes money through a variety of revenue flows Cost structure Sums up the monetary consequences of the means employed in the business
model
TABLEIV:BUSINESS MODEL COMPONENTS,ELEMENTS, AND ATTRIBUTES USED IN THE RESEARCH
BM Pillar BM component Attribute Attribute description Elements
Product Value proposition
1st tier: Value (level)
What are the values that customers get from the firm compared to its competitors?
Newness, performance, customization, design/ features, 2nd tier:
Price level
At what price customers get values from the firm
compared to competitors? Free, economy, market, High-end 3rd tier:
Reasoning
Why the offering (value and price level) could be valuable for the customer?
Use, risk reduction, effort reduction
Customer interface
Target customer 1st tier: Criteria 1
What are the bases for customer segmentation? What
are the segments under each criteria? Gender 2nd tier:
Criteria
What are the bases for customer segmentation? What are the segments under each criteria? Age Distribution
channel
3rd tier: Channel
What are the distribution channels that the firm uses to offer value propositions for each segment?
Sales force, internet/ mobile, own stores, partner stores, wholesaler Relationship 4th tier:
Mechanism
What are the unique customer segments that needs different CRM approaches?
Differentiated geographical/ cultural markets
Infrastructure management
Value configuration
1st tier: Activity
What are the value adding activities performed by the
firm and its partners? Value adding activities Partner network 2nd tier:
Actors/ level of integration
Who are the actors performing each value chain
activity? Actors (partners) engaged in each
activity
In utilizing the framework, we did some modifications to the component list as well as for elements. We eliminated
low frequency of occurrence (20.8% occurrence in component literature ranking as the 13th component out of 26 components in reference [10]). Further, we eliminated both components under financial aspects based on the argument
that financial aspects are consequences of all other BM pillars. This argument is well supported by literature [10] and the proposer of the framework too illustrates it as a consequential factor in his BM canvas [12].
TABLEV:CHARACTERISTICS OF FOCAL VALUE NETWORKS
Value network Retailer 1 Retailer 2 Retailer 3 Retailer 4 Retailer 5 Retailer 6
No. of markets 3 3 3 38 High 3
Distribution channels Specialty stores, internet
Specialty stores, internet
Specialty stores, internet
Specialty stores, department stores,
internet
Internet, phone, catalogue, Sears stores
Internet, Catalogue
Target market College girls Young women Young men
& women
All ages men & women
All ages men & women
Young women
Volume & batch size High Low-Medium High High Low Low
No. of product types Intimate and
outerwear
Intimate and outerwear
A wider range
A wider range A wider range Intimate & outerwear
Complexity of routings High High Low Low Medium Medium
Make-to-stock % High High High High Low Low
Lead time Medium Medium High Low Low Low
Order-winners Cost, flexibility,
responsiveness
Flexibility, Responsiveness
Cost Cost, fast delivery Fast delivery Fast delivery
In terms of elements, we did several modifications to elements of the attribute „mechanism‟ of the component „relationship‟. Instead of attributes personal assistance, self-service, automated services, communities, and co-creation suggested by the proposer [12], we utilized different geographical markets where the retailer is present. The reason behind was, to capture the complexity of the model, we believed that the diversity of geographical presence will be more meaningful since the relationship mechanism is highly dependent on geographical (rather cultural) factors [13]. For the element „value‟ in the component „value proposition‟ we changed the elements referring to literature. Originally proposed attributes are newness, performance, customization, getting the job done, design, brand/ status, and price [11]. We kept newness, performance, customization, and design (making it design / features). We removed the element „getting the job done‟ since it is a must-be value in every product/ service. We eliminated brand/ status since it is not a controllable factor for a firm as brand equity builds up as a consequence of acceptance by consumers. Further, we eliminated price, since we take it as another element (price level). Table I illustrates the final framework of BM components with constituent elements we utilized after modifications.
B. Measuring Complexity
Complexity measurement gains a significant attention in every business management discipline namely; marketing, SCM, technology and innovation management (TIM), and strategic management.
Marketing literature tends to measure complexity with reference to differentiation focusing on product portfolios [8], [14]. SCM literature measures complexity under different dimensions. Static/ structural (complexity) (driven by number and variety of elements) and dynamic/ operational (complexity) (driven by uncertainty and variability) are two prominent dimensions focusing on the nature of complexity [15], [16]. Internal (complexity) and external (complexity) are the other prominent dimensions in SCM literature which consider the origin of complexity [15]. Number of variables/ elements and the ties between them are the consideration of TIM literature on complexity [8]. Strategic management
discipline with a relation to the BM concept identifies the simultaneous strategic paradox (which implies diversity) as the driver of complexity [17].
All these disciplines converge in to a commonality in complexity drivers stressing that diversity/ variety, interdependency/ interconnectedness, and the size (number of contextual elements) are bases that generate complexity. Therefore it is logical to define complexity utilizing multiplicity (size), diversity, and connectivity. One such definition is that “complexity is a state manifested by the multiplicity, diversity, and functional interrelatedness of elements [18]. The phrase „elements‟ can be tailored to contextual specifications to interpret system complexity, portfolio complexity, network complexity, as well as model complexity.
A well cited methodology for measuring complexity is the complexity index which takes the number of components in the system (multiplicity), number of different components in the system (diversity), and the number of connections (connectivity) [19]. The complexity index takes the cube root of the multiplier of these three figures in a system [19].
Generalized complexity index is a complexity measurement methodology created considering all the above aspects [8]. Though the methodology is based on product structure diagram [20] and the commonality index [21] focusing towards products and portfolios, it can be utilized in different contexts [8]. The author provides a great logical argument about diversity providing a measure with reference to the commonality index so that it measures the proportion of different elements in the system which is an absolute measure of the utilization efficiency;
Diversity 1 (Unique elements / Total elements)
So we adopt the formula taking both above insights as;
Unique elements (U)
CI = # of variants (V) 1- # of connections Total elements (T)
C. Business Model Complexity
sources/ locus of BMC?”
Majority of definitions for BM identifies BM as architecture or a structure composing of actors or partners that work on creating and capturing value. This implies that BM has systemic characteristics [2] and further BM evolves with time proving that BM has characteristics of a system [3], [22]. Complexity in the management stream considers about the structural complexity that inherits due to system architecture. This alone hints that BM is a complexity generator.
Defining BM complexity is necessary before proceeding to propose that BM creates complexity. A well cited definition for the BM states that BM is “a representation of a firm‟s underlying core logic and strategic choices for creating and capturing value within a value network” [9]. We adopt this definition since it captures the essence of the BM concept while proposing the functional unit of a BM as the value network. Making BM a property of the value network is quite insightful with the globalization of value chains which currently perform as value networks targeting particular chosen market segments [4]. Considering this definition of BM and the definition for complexity, we propose a definition for BMC as “the complexity generated by multiplicity, diversity, and interconnectedness of strategic choices made by a value network for each BM component (rather BM pillar) in order to create and capture value”.
We made an effort to come up with a two dimensional (similar as pillars in the BM framework) scale for BMC. Objective was to be simpler in propositions as well as to provide meaningful analyses, discussions, and implications. BM pillars product and customer interface are factors that have more direct impact from customers than the infrastructure pillar. Although value networks offer value propositions, customers (consumers) perform the value appropriation [11], [22]. The feedback from the customers after value appropriation results in modifying and tailoring the value proposition offered. Since there is such a strong relationship between value proposition and the components in the BM pillar „customer interface‟, it is logical to merge these in to one dimension. Due to the higher impact by external stakeholders (customers) in moderating the complexity generated by these components, it is reasonable to merge the components of value proposition, target customer, distribution channel, and relationship. So, we refer the complexity generated by these components‟ multiplicity, diversity, and connectivity as „external BMC‟.
Value configuration and partner network have a significantly low impact from customers since the major control of these components lies within the leading firm in the value network. Partners in the value network also impact on strategic choices related to these matters, but in the referred context of value network they are internal stakeholders. Thus, the complexity generated by the components „value configuration‟ and „partner network‟ (through components‟ multiplicity, diversity, and connectivity) is characterized as „internal BMC‟.
With reference to the ability of each component in generating (and moderating) structural/ architectural complexity, and the component classification as internal/ external BMC drivers, we propose;
Proposition 1:
BM pillars „product‟, and „customer interface‟ create external BMC through multiplicity, diversity, and interconnectedness of strategic choices the value network makes for each component, so that the level of external complexity differ between different BMs.
Proposition 2:
BM pillar „infrastructure management‟ comprising of components „value configuration‟, and „partner network‟ creates internal BMC through multiplicity, diversity, and interconnectedness of strategic choices the value network makes for each component, so that the level of internal complexity differ between different BMs.
D.BMC and SCM Orientation
SCM literature refers to several complexity drivers. A review of SCM literature reveals that value proposition (number and variety of products/ services [11], [23], differences in price levels [11]) drives SCM complexity. Effort reduction (making products easily available for search) as well as use and risk reduction through functionality improvement and provision of warranties adds complexity to SCM. Variety of target customers and their different demands [15], [24] and differentiation in distribution channels [25] are obvious complexity drivers for SCM. Geographical market segments necessitate a variety of relationship management strategies adding complexity to SCM [13]. Value configuration (value adding activities) of a value network causes complexity due to the variety, diversity as well as connectivity of partners within the configuration [26]. Number, variety as well as the level of integration in the partner network drives SCM complexity [27]. As discussed in the previous subsections, these factors composite a BM of a value network. These are direct evidence for a relationship between BMC and SCM.
Strategic management stream puts great emphasis on relating BM and strategy concepts. One proponent for the relationship between BM and strategy is that BM is the way that operationalizes the strategy [3], [28]. Further, literature proposes that a firm‟s tactics are tailored to the BM [28]. Operationalization of a BM and related tactics are executed through a supply chain. In this manner, it is reasonable to propose that a strategy is operationalized through a BM that is executed through a supply chain. Thus BM and SCM have a direct relationship.
In general terms, SCM orientation can be identified as the focus given for different strategic areas related to managing a supply chain. A formal definition says that SCM orientation is “the recognition of systemic, strategic implications of the tactical activities involved in managing the various flows in a supply chain” [29]. Theories, propositions related to complexity management (especially in SCM) stress that addressing each type of complexity based on its origin and level of impact through different tailored approaches is mandatory [15]. Thus, to manage the complexity created by a value network‟s BM, it is necessary to give different levels of focus (priorities) to different areas of SCM.
of management/ operational orientation, and performance/ performance driver orientation since existing scorecards have been found as biased to one paradigm [30]. LSC comprises of four areas to assess SCM performance with 22 measurement items (Fig. 1). To reduce the response biases while enabling proper rating with no ambiguity on the current performance level, each measurement item is given 5 descriptive performance levels instead of using the Likert scale alone. The LSC which is a self-evaluating tool has been utilized in research on different SCM aspects such as cross-country
SCM performance [31], impact of institutional environments on SCM performance [30], impact of ownership to SCM performance [32], and differences between high-tech and low-tech companies in SCM [33]. LSC facilitates the evaluation of the level of performance of that particular firm or the value network. It takes four areas of SCM; 1) Corporate strategy and inter-organizational alignment (referred to as corporate strategy), 2) Planning and execution, 3) Logistics performance, and 4) IT methods and implementation.
Area 1: Corporate strategy
1) Corporate strategy regarding logistics & its importance. 2) Definition of supplier contract terms & degree of info. sharing.
3) Definition of customer contract terms & degree of info. sharing.
4) System for measurement & improvement of customer satisfaction.
5) System for employee training & evaluation.
Area 2: Planning & execution
1) Strategies for optimizing logistics system resources based on design for logistics.
2) Understanding market trends & accuracy of demand planning. 3) Accuracy & adaptability of SCM planning.
4) Control & tracking of inventory: accuracy & visibility. 5) Process standardization & visibility
Area 4: IT methods & implementation 1) Electronic Data Interchange (EDI) coverage 2) Usage of bar coding/ automatic identification and data
capture
3) Effective usage of computers in operations and decision making
4) Open standards and unique identification codes 5) Decision-making systems and support to supply chain
partners
Area 3: Logistics performance 1) Just-In-Time.
2) Inventory turnover & cash-to-cash cycle time. 3) Customer lead time.
4) Delivery performance & quality.
5) Supply chain inventory visibility & opportunity costs. 6) Environmental activities.
7) Total logistics cost SCM Logistics
Scorecard
Fig. 1. SCM Logistics Scorecard (LSC) - areas and measurement items
Based on the propositions made with reference to the BMC and the relationships between BM components and supply chain complexity we hypothesize;
Proposition 3:
Differences in internal and external complexity caused by BMs, force value networks to adopt different SCM orientations.
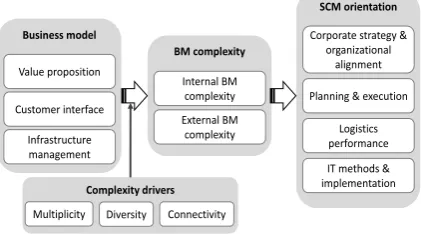
Fig. 2 illustrates the conceptual framework of the paper.
BM complexity
Internal BM complexity
External BM complexity Business model
Value proposition
Customer interface
Infrastructure management
SCM orientation
Corporate strategy & organizational
alignment
Logistics performance Planning & execution
IT methods & implementation Complexity drivers
Multiplicity Diversity Connectivity
Fig. 2. Conceptual framework of the paper
III. METHODOLOGY
A. Case Study Approach
Case study research is much appropriate to reveal hidden insights and to explore theories and phenomenon that are ambiguous or not concrete [34]. We utilized a case study approach using a structured questionnaire and the LSC for the research since both BM and supply chain complexity concepts are still not established.
Focal company was an apparel manufacturer located in Sri Lanka. The company caters to six global retailers. Differences featured by retailers‟ BMs in our initial screening was supporting our choice of a case study approach. Table V provides details of the retailers which prove the differences
among them. The company operates with three strategic business units (SBUs) comprising of two retailer units for each SBU. This formation of SBUs is an attempt to deal with the diversity in retailers that the company is serving for. Earlier, the company has operated with centralized functional departments serving for all retailers. Later, as the strategic management felt a need of customer segmentation, they have formed three SBUs as described.
We collected qualitative data using a structured questionnaire with strategic managers of each retailer business unit. Following guidelines for case study research, we did follow up interviews as well as interviews with direct employees of business units for saturation. We utilized LSC to collect quantitative data related to the six BMs. Employees (120 respondents) of different levels of employment (4 from strategic, 74 from operational, and 42 from tactical) responded to the LSC. Groups as well as single employees participated at the survey with the LSC depending on their availability. One member of the team visited the facility and explained each LSC element and performance levels. Data collection was done starting from the year 2011 to 2012.
B. Assessment of BM Complexity
[19].
Fig. 3 illustrates BM structure diagrams for all three BM pillars for Retailer 1. Last tier attributes for BM pillars
customer interface, and infrastructure management were taken in numbers and treated accordingly for clarity and ease of mapping BMs with the structure diagram concept.
Choices of the value network for attribute 4
(4thtier) – Number of geographic markets Choices of the value network for attribute 3 (3rdtier) – Distribution
channels Choices of the value network for attribute 2 (2ndtier) – Target market
(Age) Choices of the value network for attribute 1 (1sttier) – Target market
(gender)
BM Pillar Customer interface
Female
Teenagers
Internet
3
Own stores
3
Partner stores
3
Choices of the value network for attribute 2 (2ndtier) – Number of
partners/ actors Choices of the value network for attribute 1 (1sttier) – Value adding
activities
BM Pillar Infrastructure
RM supply
7
Manufacturing
4
Embellishment
4
Garment finishing
3
Choices of the value network for attribute 3 (3rdtier) –
Reasoning Choices of the value network for attribute 2 (2ndtier) – Price
level Choices of the value network for attribute 1 (1sttier) – Value
level
BM Pillar proposition Value
(product)
Design/ features
Market
Risk
reduction reductionEffort
Newness
Market
Risk
reduction reductionEffort
Fig. 3. BM structure diagrams adopting the product structure diagram logic (for Retailer 1).
C. Assessment of SCM Orientation
As described above, the four areas of the LSC depict the SCM orientation of a value network (a supply chain). So, we utilized average score of each area to assess the focus given in SCM by the value network.
IV. RESULTS AND DISCUSSION
A. BM Complexity of Value Networks
Table VI illustrates the complexity indices calculated for each BM pillar and the resultant internal BMC and external BMC values for each value network (noted as Retailer 1, 6). Results show a clear difference in both internal and external complexities between value networks. Retailer 1 and Retailer 2 show high internal complexities and low external complexities. Retailers 4 and 5 show low complexity levels in both internal and external measures. Retailer 5 and 6 show higher external complexities and lower internal complexities. Fig. 4 illustrates the placements for retailers within the BMC matrix.
TABLEVI:QUANTIFIED COMPLEXITY FOR VALUE NETWORKS (RETAILERS)
Retailer
Complexity of BM pillar (Multiplicity*Diversity*
Connectivity)(1/3)
External BMC Average of
(VP + CI)
Internal BMC (= IM)
VP CI IM
Retailer 1 2.27 3.83 5.36 3.23 5.36 Retailer 2 2.55 4.25 5.97 3.40 5.97 Retailer 3 2.83 4.25 2.71 3.54 2.71 Retailer 4 1.82 5.19 2.38 3.50 2.38 Retailer 5 3.20 31.29 2.38 17.24 2.38 Retailer 6 3.57 18.93 3.57 10.37 3.57
With reference to the said placements in the complexity matrix, we grouped six value networks to 3 groups as illustrated in Fig. 4 itself. We then analyzed SCM orientations of these three groups in order to obtain insights from the research while testing proposition 3.
B. SCM Orientation of Groups with Different BMC We analyzed the three groups with one way ANOVA using three levels accompanying Scheffe‟s test (Post-hoc test) to see the significance of difference between each group. Fig. 5 shows results of the analysis. (Vertical arrows illustrates groups showing significant differences for each area of SCM)
Results reveal several insights providing valuable managerial implications. SCM area „logistics performance‟ shows no significant difference between the three groups. Focal value networks center around one particular garment vendor so that factors for logistics optimization (transportation routes, efficiencies, regional infrastructure, etc.) become immaterial. Further, this insignificance also hints that all value networks put the same level of effort on logistics performance.
Retailer 1
Retailer 2 Retailer 3
Retailer 4 Retailer 5
Retailer 6
0.00 10.00 20.00
2.00 5.00 8.00
Ext
ern
al
BMC
Internal BMC
Group 1 (Low internal BMC, Low external BMC)
Group 2 High internal BMC, Low external BMC) Group 3 (Low internal BMC,
High external BMC)
Fig. 4. Placements of value networks in the BMC matrix.
BMC) and Group 2 (high internal and low external BMC) as well as difference among Group 2 and Group 3 (low internal and high external BMC) are significant. This implies that IT utilization acts as a great lever to manage internal complexity. Even though Group 3 exhibits high external BMC, it shows a significantly lower score compared to Group 2 which has high internal BMC while there is no significant difference between the groups having a low internal complexity (Group 1, and Group 3) although they are different in terms of external BMC. This implies that value networks with high internal BMC tend to utilize IT than value networks that inherit low internal BMC although they have high external BMC signing that IT utilization is important in order to cope with the complexity through making the internal partner network more efficient.
d.f. = 1 : 119 F-value p-value
Corporate strategy & inter-org. alignment 3.119 0.048
Planning & Execution 6.639 0.002
Logistics Performance 0.199 0.888
IT methods & implementation 6.443 0.002
Fig. 5. Results for BMC groups - ANOVA and intergroup significance.
„Planning and execution‟ also shows a significant difference among the three groups implying that BMC highly influences this area of SCM. The area score comparison for planning and execution reveals that Group 2 (high internal, low external BMC) obtains the highest score (as it was in IT utilization). Group 3, with high external BMC and low internal BMC scores second in this area while Group 1 (which has low values for both complexities) taking the least score within three groups. This observation indicates that either internal or external BMC forces value networks to focus more on planning and execution and improving performance in this area. Comparatively high score in group 2 indicates that internal BMC‟s influence is high on planning and execution. Significance of difference within these three group scores (Scheffe‟s test) was observed only between group 1 and group 2. Managerial implication from this insight is the fact that, in order to cope with complexity created by the BMC, value networks need to improve on planning and execution. Further, if a value network inherits a higher internal BMC, the focus has to be increased. This implication is important for portfolio management within a firm since the BMC of the portfolios might differ from each other so that management has to improve performance in planning and execution area accordingly.
Finally, when it comes to area 1, corporate strategy, again it shows a significant difference among the groups implying that BMC has a significant impact in shaping up the corporate strategy of a firm (ultimately influencing the value network‟s strategy). When we consider inter-group significance of differences (Scheffe‟s test) we could observe that only the difference between group 1 and group 3 is significant. Neither group 1 and group 2 nor group 2 and group 3 are significantly different. This implies that external BMC has a comparatively higher effect in shaping up the strategic focus of a value network. Group 3 (having higher external BMC) obtaining the highest score in the corporate strategy element further proves the implication. The managerial implication on this area is that if a value network has a higher complexity in terms of diversity and multiplicity of customers, the value network tends to improve and focus more on corporate strategy. Further, this evidences the effect of customers to a value network to influence highly on strategic focus of a value network.
In terms of performance, we observe that having low levels of complexity in both complexity measures forces value networks to go with low performance levels in all areas of SCM. Internal BMC affects more on SCM having an impact to improve two areas of SCM to the highest level of performance (group 2). External complexity alone forces value networks to give importance to strategic issues. Within the focal company, value networks belonging to group 2 were the best performers in terms of financial performances (having higher shares of the customer, higher operational margins, and highest revenues). This implies that their effort to improve the areas of planning and execution and the utilization of IT as a leveraging tool to manage BMC has given fruitful results. Among the other two groups, value networks in group 2 (having lower levels of both complexities) performed better than group 1 in financial terms (based on qualitative data) indicating that corporate strategy alone won‟t guarantee financial performance. Tailored corporate strategies need to be executed well utilizing necessary improvement efforts and tools as group 1 has done.
V. CONCLUSION
The objective of the paper was to see the influence of BM and related BMC on SCM. During the research carried out to accomplish this objective, we came up with several research and managerial implications.
Implications for research are, the novel methodology to map and measure BMC, relating BM and SCM concepts which literature develops in parallel focusing only in one particular stream. The research propositions and the framework are novel so that this can be applied to different industries and different scenarios to strengthen up the relations between BM and SCM concepts.
As for managerial implications, the research reveals that portfolio management with a micro-organizational perspective is necessary in SCM too. Mostly portfolio management is concerned with streams such as marketing, strategy, and operations research. SCM also needs a segmentation of strategies and BMC is one important criteria for tailoring SCM strategies. Influence of external BMC on strategic elements of SCM advices the importance of strategic orientation towards the customer while signing a place to start SCM with. Internal BMC clearly influences the execution of SCM necessitating a higher focus on planning and execution to cope with internal complexity created by strategic choices on value adding activities and partners for value addition. The results also identified IT utilization as a leveraging tool to manage internal BMC while indicating that proper use of IT accompanied with improved planning and execution is key for managing the complexity within value networks.
Limiting to one particular industry is an obvious limitation of the research. Since this is a first attempt to clear a future path, this framework has to be applied for more value networks, companies, and more industries in the future. Longitudinal research with time would also be interesting since BMs can evolve with time so that the related BMC changes for value networks. It would be interesting to do a thorough analysis with financial data for more value networks to see the combinational impact of BMC and SCM for financial performances.
REFERENCES
[1] J. Margretta, “Why business models matter,” Harvard Business Review, pp. 3-8, May 2002.
[2] C. Zott and R. Amit, “Business model design: An activity system perspective,” Long range planning, vol. 43, no. 2, pp. 216-226, 2010. [3] T. Burkhart, J. Krumeich, D. Werth, and P. Loos, “Analyzing the
business model concept-a comprehensive classification of literature,” in Proc. Thirty Second International Conference on Information Systems, Shanghai, 2011.
[4] M. Christopher, Logistics and Supply Chain Management: Creating Value-Adding Networks, Pearson Education, 2005.
[5] P. B. Seddon, G. P. Lewis, P. Freeman, and G. Shanks, “The case for viewing business models as abstractions of strategy,” Communications of the Association for Information Systems, vol. 13, no. 1, pp. 427-442, 2004.
[6] C. Zott, R. Amit, and L. Massa, “The business model: Theoretical roots, recent developments, and future research,” Working paper, IESE Business School, 2010.
[7] C. Zott and R. Amit, “The fit between product market strategy and business model: Implications for firm performance,” Strategic Management Journal, vol. 29, pp. 1-26, 2008.
[8] M. A. Jacobs, “Complexity: Toward an empirical measure,”
Technovation, vol. 33, pp. 111-118, 2013.
[9] S. M. Shafer, H. J. Smith, and J. C. Linder, “The power of business
models,” Business Horizons, vol. 48, pp. 199-207, 2005.
[10] A. Onetti, A. Zucchella, M. V. Jones, and P. P. McDougall-Covin, “Internationalization, innovation and entrepreneurship: Business models for new technology-based firms,” Journal of Management and Governance, vol. 16, no. 3, pp. 337-368, 2012.
[11] A. Osterwalder, The Business Model Ontology: A Proposition in a Design Science Approach, Published Thesis, Lausanne, Switzerland, 2004.
[12] A. Osterwalder and Y. Pigneur, Business Model Generation: A Handbook for Visionaries, Game Changers, and Challengers, Wiley. com, 2010.
[13] A. R. Zablah, D. N. Bellenger, and W. J. Johnston, “An evaluation of divergent perspectives on customer relationship management: Towards a common understanding of an emerging phenomenon,” Industrial Marketing Management, vol. 33, no. 6, pp. 475-489, 2004.
[14] M. Draganska and D. C. Jain, “Product-line length as a competitive tool,” Journal of Economics & Management Strategy, vol. 14, no. 1, pp. 1-28, 2005.
[15] S. Serdarasan, “A review of supply chain complexity drivers,”
Computers & Industrial Engineering, 2013.
[16] T. Blecker, W. Kersten, and C. M. Meyer, “Development of an approach for analyzing supply chain complexity,” in Proc. International Mass Customization Meeting, 2005.
[17] W. K. Smith, A. Binns, and M. L. Tushman, “Complex business models: Managing strategic paradoxes simultaneously,” Long Range Planning, vol. 43, no. 2, pp. 448-461, 2010.
[18] M. A. Jacobs and M. Swink, “Product portfolio architectural complexity and operational performance: Incorporating the roles of learning and fixed assets,” Journal of Operations Management, vol. 29, no. 7, pp. 677-691, 2011.
[19] M. H. Meyer , The Power of Product Platforms: Building Value and Cost Leadership, New York: SimonandSchuster.com, 1997. [20] J. Gershenson, G. Prasad, and S. Allamneni, “Modular product design:
A life-cycle view,” Journal of Integrated Design and Process Science,
vol. 3, no. 4, pp. 13-26, 1999.
[21] M. V. Martin and K. Ishii, “Design for variety: Development of complexity indices and design charts,” in Proc. 1997 ASME Design Engineering Technical Conferences, 1997.
[22] K. Mason and M. Spring, “The sites and practices of business models,”
Industrial Marketing Management, vol. 40, no. 6, pp. 1032-1041, 2011. [23] W. C. Kim and R. Mauborgne, “Charting your company's future,”
Harvard Business Review, vol. 80, no. 6, pp. 76-85, 2002.
[24] G. N. Stock, N. P. Greis, and J. D. Kasarda, “Logistics, strategy and structure: a conceptual framework,” International Journal of Physical Distribution & Logistics Management, vol. 29, no. 4, pp. 224-239, 1999.
[25] J. Blackhurst, T. Wu, and P. O‟Grady, “PCDM: A decision support modeling methodology for supply chain, product and process design decisions,” Journal of Operations Management, vol. 23, no. 3, pp. 325-343, 2005.
[26] I. Manuj and F. Sahin, “A model of supply chain and supply chain decision-making complexity,” International Journal of Physical Distribution & Logistics Management, vol. 41, no. 5, pp. 511-549, 2011.
[27] T. Y. Choi and D. R. Krause, “The supply base and its complexity: Implications for transaction costs, risks, responsiveness, and innovation,” Journal of Operations Management, vol. 24, no. 5, pp. 637-652, 2006.
[28] R. Casadesus-Masanell and J. E. Ricart, “From strategy to business models and onto tactics,” Long Range Planning, vol. 43, no. 2, pp. 195-215, 2010.
[29] J. T. Mentzer, W. D. Witt, J. S. Keebler, S. Min, N. W. Nix, C. D. Smith, and Z. G. Zacharia, “Defining supply chain management,”
Journal of Business Logistics, vol. 22, no. 2, 2001.
[30] K. Yaibuathet, T. Enkawa, and S. Suzuki, “Influences of institutional environment toward the development of supply chain management,”
International Journal of Production Economics, vol. 115,pp. 262-271, 2008.
[31] K. Yaibuathet, T. Enkawa, and S. Suzuki, “Supply chain performance and its influential factors: Cross national analysis,” Japan Industrial Management Association, vol. 57,pp. 473-482, 2007.
[32] K. Yaibuathet, T. Enkawa, and S. Suzuki, “Supply chain operational performance analysis: Thai manufacturing sector,” in Proceedings 7th Asia Pacific Industrial Engineering and Management Systems Conference, Bankok, Thailand, 2006.
“Factors affecting efficient supply chain operational performance of high and low technology companies in thailand,” Management Sicence and Engineering, vol. 4, no. 3, pp. 24-33, 2010.
[34] K. M. Eisenhardt and M. E. Graebner, “Theory building from cases: Opportunities and challenges,” Academy of Management Journal, vol. 50, no. 1, pp. 25-32, 2007.
[35] P. Timmers, “Business models for electronic markets,” Electronic markets, vol. 8, no. 2, pp. 3-8, 1998.
[36] R. Amit and C. Zott, “Value creation in E-Business,” Strategic Management Journal, vol. 22, pp. 493-520, 2001.
[37] A. Osterwalder, Y. Pigneur, and C. L. Tucci, “Clarifying business models: Origins, present, and future of the concept,” Communications of the Association for Information Systems, vol. 15, pp. 1-39, May 2005.
M. Nayanapriya Gunawardhana was born in Sri Lanka in 1982. Currently he is reading for his Ph.D in industrial engineering and management in Tokyo Institute of Technology, Tokyo, Japan since 2012. He earned his M.Eng. Degree in industrial engineering & management from Tokyo Institute of Technology, Tokyo, Japan in 2012. He obtained his B.Sc. (Engineering) degree in process engineering from University of Moratuwa, Sri Lanka, in 2006. He has worked for an apparel vendor in Sri Lanka for 3 ½ years prior to pursuing his higher studies in Japan working as a Senior Textile/ Sourcing Technologist. Prior internships was also in an apparel manufacturing company in Sri Lanka which was 6 months in duration. As a PhD candidate, his paper submitted to the Journal of Japan Industrial Management Association has been accepted in August, 2013. The title of the paper was “Supply Chain Management with Leanness and Agility: A Value Network Perspective with a B2B Apparel Case Study”. Further, he has made presentations in two international conferences in his tenure as a PhD candidate, out of which one paper is under consideration to be published in a journal. His current research interest is on supply chain management (SCM) having a focus on influential factors for SCM and supply chain optimization.
Sadami Suzuki was born in Japan in 1973. He is an associate professor in Industrial Engineering and Management, Graduate school of Decision Science and Technology, Tokyo Institute of Technology, Japan. He received his B. Eng., M. Eng. and Dr. Eng. from Tokyo Institute of Technology in 1998, 2000, and 2007 respectively. His research areas focus on production and operations management, customer satisfaction and loyalty, and supply chain management. Assoc. Prof. Suzuki is a member of Japan Industrial Management Association (JIMA), Japanese Operation Management and Strategy Association (JOMSA) and Japanese Society for Quality Control (JSQC). He received research award of JIMA in 2006 by the paper entitled “Quantifying the Bullwhip Effect in a Supply Chain with a Periodic Review System”, Journal of Japan Industrial Management Association, 56 (3), pp.147-154 (2005).