RP-HPLC Method Development and Validation for Simultaneous Estimation of Linezolid and Cefixime in API and Pharmaceutical Dosage Form
5
0
0
Full text
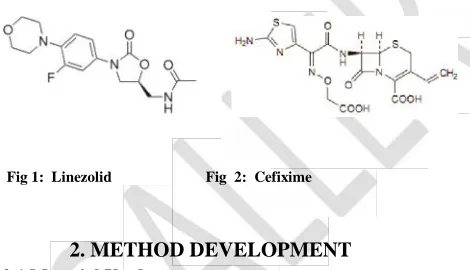
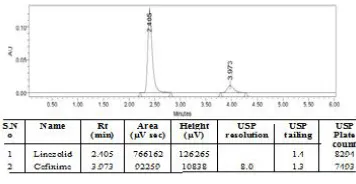
(2) Int J Pharma Res Health Sci. 2017; 5 (4): 1731-35 multifaceted, which is an essential section of the bacterial translation process. The results of time-kill studies have shown linezolid to be bacteriostatic against enterococci and staphylococci. For streptococci, linezolid was found to be bactericidal for the majority of strains. Linezolid is also a reversible, nonselective inhibitor of monoamine oxidase 1-2. Therefore, linezolid has the potential for interaction with adrenergic and serotonergic agents Fig1. Cefixime, chemically it consists of a dihydrothiazine ring fused to a beta-lactam ring containing a suitable side sequence at 7 positions and as the trihydratean antibiotic. The antibacterial consequence possesses a mechanism of action comparable to penicillins i.e. inhibition of transpeptidation course resulting in the arrangement of inadequate cell wall; osmotic impel from the outside isotonic environment of the host cell to the inside of the hypertonic bacterial cytoplasm and finally activation of the autolysin enzyme leading to the lysis of bacteria 3. Cefixime is used to treat positive infection caused by bacteria such as bronchitis (infection of the airway tubes leading to the lungs); gonorrhea (a sexually transmitted disease); and infections of the ears, throat, tonsils, and urinary tract Fig 2. There are few analytical procedures are established for the simultaneous estimation of cefixime and linezolid in spectroscopic and chromatographic methods 4-8. Hence a new analytical method developed for the simultaneous estimation of cefixime and linezolid in API and pharmaceutical dosage form and the method was validated as per ICH guidelines (Q2R(1)) 9-10.. Fig 1: Linezolid. Fig 2: Cefixime. 2. METHOD DEVELOPMENT 2.1 Material Used: Methanol and water (HPLC grade) obtained from SD fine chemicals, linezolid and cefixime (in house), LINCEF marketed Alkem Laboratories Ltd formulation. 2.2 Chromatographic condition: Method development was optimized with the following chromatographic circumstances mobile phase consist of methanol: water (47:53%v/v), follow rate of 0.9ml/min, C18 (4.6×150mm, 5µ) Phenomenex Luna was used for the chromatographic separation of analyte, detection wavelength was at 260nm and injection volume was 10µl. Instrument used was WATERS Alliance 2695: Empower 2, 996 PDA Detector.. 2.3 Preparation of standard solution: Accurately weigh and transfer 10 mg of linezolid and cefixime working standard into a 10ml of clean dry volumetric flasks individually add about 7ml of Methanol and sonicate to dissolve and removal of air completely and make volume up to the mark with methanol. Further pipette 0.15ml of cefixime and 0.6ml the above linezolid stock solutions into a 10ml volumetric flask and dilute up to the mark with methanol. 2.4 Preparation of mobile phase: Accurately measured 470ml (47%) of methanol and 530ml of Water (53%) were mixed and degassed in digital ultrasonicater for 10 minutes and then filtered through 0.45 µ filter under vacuum filtration. The mobile phase was used as the diluent. 2.5 Preparation of Sample Solution: Take average weight of 10 tablets and crush to make powder in a mortar by using pestle and weight 10 mg equivalent weight of linezolid and cefixime sample into a 10mL clean dry volumetric flask and add about 7mL of Diluent and sonicate to dissolve it completely and make volume up to the mark with the same solvent. Further the solution was diluted to get a concentration of 10 µg/ml with the diluent and the resulting solution was filtered through 0.45 µ filter under vacuum filtration. 3 Method validation parameters: 3.1 Method validation9-11 The method validation was done as per the ICH guidelines Q2R(1), and accordingly the parameters evaluated were Specificity, precision, accuracy, linearity, ruggedness, robustness and system suitability studies. 3.2 Specificity: Specificity of an analytical method is its ability to measure accurately and specifically the concentration of analyte without interference from other API, diluents, mobile phase. Solutions of mobile phase, sample solution, standard solution were injected into liquid chromatography. Retention times of sample and standard were compared. 3.3 Linearity and Range: The linearity of an analytical procedure is its ability to elicit test results that are directly proportional to the concentration of analyte in samples within given range, was studied by analyzing five analyte concentrations of drug ranging from 20-100μg/ml for linezolid and 5 to 25μg/ml cefixime. 3.4 Accuracy: Accuracy refers to the closeness of a measured value to a standard or known value. The percentage recovery was studied for 50%, 100% and 150%, each level was injected three times. 3.5 Precision: The precision of an analytical procedure expresses the closeness of agreement between a series of measurement obtained from multiple sampling of same homogenous sample under prescribed conditions. This experiment was conducted to prove the repeatability of the assay results obtained by quantification methodology. 1732. IIIIIIIII© International Journal of Pharma Research and Health Sciences. All rights reserved.
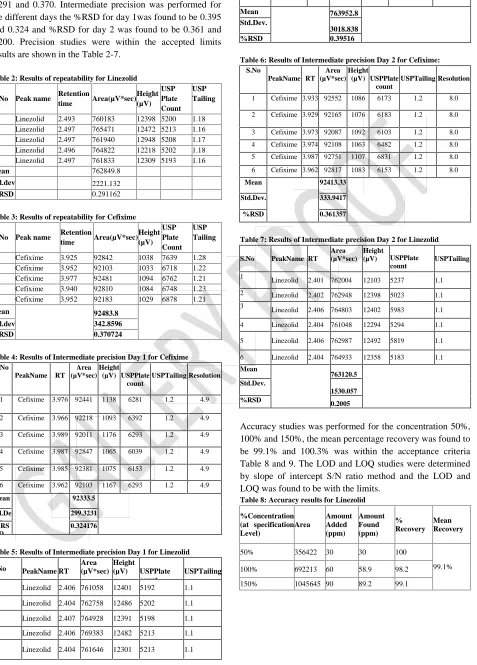
(3) Int J Pharma Res Health Sci. 2017; 5 (4): 1731-35 System precision, method precision and intermediate precision was performed. Repeatability: 20μl of standard solution was injected for six times and measured the peak area for all six injections in HPLC and % RSD for the area of six replicate injections was calculated. Intermediate precision: The ruggedness of an analytical method is the degree of reproducibility of test results obtained by same samples under different conditions. The freshly prepared standard solutions was injected on inter and intraday. 3.6 LOD and LOQ: The Detection and quantification limits for the linezolid and cefixime were performed and calculated using S/N ratio method. 3.7 Robustness of an analytical method is measure of its capacity to remain unaffected small but deliberate variations in method parameters and provides an indication of its reliability during normal usage. Robustness measures the lack of internal influences on the test results. As part of the robustness, deliberate change in the flow rate and mobile phase composition was made to evaluate the impact on the method. Change in flow rate: The flow rate was varied at 0.8 ml/min to 1.0ml/min. Standard solution of linezolid and cefixime was used for analysing the varied flow rates along with method flow rate. Change in Organic composition: The Organic composition was varied up to ±5%, was prepared and analysed using the varied Mobile phase composition along with the actual mobile phase composition for the standard API solutions.. Fig 4: Optimized Chromatogram (Sample). The developed method was validated as per the ICH guidelines (Q2R(1)) manual, Specificity studies showed that there was no interferences of impurity peaks on the developed method and the analyte peaks were well resolved. Linearity studies were performed for the concentration 20100μg/ml for linezolid and 5 to 25μg/ml cefixime and the correlation coefficient was found to be 0.999 and 0.9998. The table is tabulated in the Table 1 and linearity graph is shown in Fig 5 and 6. Table 1: Linearity results for Linezolid and Cefixime SI.NO. 1 2 3. Concentration Average Concentration Peak Area g/ml g/ml 20 40 60. 241842 483922 696853. 5 10 15. Average Peak area 26755 49833 72257. 4. 80. 918474. 20. 96655. 5. 100. 1184829. 25. 116854. Correlation Coefficient. 0.999. 0.9998. 3. RESULT AND DISCUSSION The developed method clearly symptomatic that the linezolid and cefixime were evidently separated by using the mobile phase consist of methanol: water (47:53%v/v) on an Phenomenex Luna C18 (4.6×150mm, 5µ), detection wavelength at 260nm, method was found to be system suitable with a retention time 2.403 and 3.954 min, resolution of the both the compound was 8.1, tailing factors was 1.4 and 1.3, theoretical plates 8807 and 5066 for linezolid and cefixime. The assay of market formulation was found to be 100.3% w/v. The chromatogram is shown in Fig 3-4.. Fig 5: Linearity plot for cefixime. Fig 6: Linearity plot for Linezolid Fig 3: Optimized Chromatogram (Standard). 1733 IIIIIIIII© International Journal of Pharma Research and Health Sciences. All rights reserved.
(4) Int J Pharma Res Health Sci. 2017; 5 (4): 1731-35 The repeatability for linezolid and cefixime the % RSD was 0.291 and 0.370. Intermediate precision was performed for the different days the %RSD for day 1was found to be 0.395 and 0.324 and %RSD for day 2 was found to be 0.361 and 0.200. Precision studies were within the accepted limits results are shown in the Table 2-7.. 6. Linezolid 2.404 763944. Mean Std.Dev.. 1 2 3 4 5 Mean. Linezolid Linezolid Linezolid Linezolid Linezolid. Std.dev. USP Tailing 1.18 1.16 1.17 1.18 1.16. 2221.132 0.291162. %RSD. Table 3: Results of repeatability for Cefixime S. No Peak name 1 2 3 4 5. Cefixime Cefixime Cefixime Cefixime Cefixime. USP Retention Height Area(µV*sec) Plate time (µV) Count 3.925 92842 1038 7639 3.952 92103 1033 6718 3.977 92481 1094 6762 3.940 92810 1084 6748 3.952 92183 1029 6878. USP Tailing 1.28 1.22 1.21 1.23 1.21. 92483.8 342.8596 0.370724. Std.dev %RSD. Table 4: Results of Intermediate precision Day 1 for Cefixime S.No PeakName. Area Height RT (µV*sec) (µV) USPPlate USPTailing Resolution count. 3018.838 0.39516. Area Height PeakName RT (µV*sec) (µV) USPPlate USPTailing Resolution count. 1. Cefixime 3.933 92552. 1086. 6173. 1.2. 8.0. 2. Cefixime 3.929 92165. 1076. 6183. 1.2. 8.0. 3. Cefixime 3.973 92087. 1092. 6103. 1.2. 8.0. 4. Cefixime 3.974 92108. 1063. 6482. 1.2. 8.0. 5. Cefixime 3.987 92751. 1107. 6831. 1.2. 8.0. 6. Cefixime 3.962 92817. 1083. 6153. 1.2. 8.0. Mean. 92413.33. Std.Dev.. 333.9417. %RSD. 0.361357. Table 7: Results of Intermediate precision Day 2 for Linezolid S.No 1. PeakName RT. Area Height USPPlate (µV*sec) (µV) count. USPTailing. Linezolid. 2.401 762004. 12103. 5237. 1.1. Linezolid. 2.402 762948. 12398. 5023. 1.1. Linezolid. 2.406 764803. 12402. 5983. 1.1. 4. Linezolid. 2.404 761048. 12294. 5294. 1.1. 5. Linezolid. 2.406 762987. 12492. 5819. 1.1. 6. Linezolid. 2.404 764933. 12358. 5183. 1.1. 2 3. Mean. 1.1. Table 6: Results of Intermediate precision Day 2 for Cefixime: S.No. USP Retention Height Area(µV*sec) Plate time (µV) Count 2.493 760183 12398 5200 2.497 765471 12472 5213 2.497 761940 12948 5208 2.496 764822 12218 5202 2.497 761833 12309 5193 762849.8. 5217. 763952.8. %RSD. Table 2: Results of repeatability for Linezolid S. No Peak name. 12484. Mean. 763120.5. Std.Dev. 1530.057. 1. Cefixime. 3.976 92441. 1138. 6281. 1.2. 4.9. 2. Cefixime. 3.966 92218. 1093. 6392. 1.2. 4.9. 3. Cefixime. 3.989 92011. 1176. 6293. 1.2. 4.9. 4. Cefixime. 3.987 92847. 1065. 6039. 1.2. 4.9. 5. Cefixime. 3.985 92381. 1075. 6153. 1.2. 4.9. 6. Cefixime. 3.962 92103. 1167. 6293. 1.2. 4.9. %RSD. 0.2005. Accuracy studies was performed for the concentration 50%, 100% and 150%, the mean percentage recovery was found to be 99.1% and 100.3% was within the acceptance criteria Table 8 and 9. The LOD and LOQ studies were determined by slope of intercept S/N ratio method and the LOD and LOQ was found to be with the limits.. Mean. 92333.5. Table 8: Accuracy results for Linezolid. Std.De v. %RS D. 299.3231. %Concentration (at specification Area Level). Amount Amount Added Found (ppm) (ppm). % Recovery. 50%. 356422. 30. 30. 100. 100%. 692213. 60. 58.9. 98.2. 150%. 1045645 90. 89.2. 99.1. 0.324176. Table 5: Results of Intermediate precision Day 1 for Linezolid Area Height S.No PeakName RT (µV*sec) (µV) USPPlate USPTailing count 1 Linezolid 2.406 761058 12401 5192 1.1 2. Linezolid 2.404 762758. 12486. 5202. 1.1. 3. Linezolid 2.407 764928. 12391. 5198. 1.1. 4. Linezolid 2.406 769383. 12482. 5213. 1.1. 5. Linezolid 2.404 761646. 12301. 5213. 1.1. Mean Recovery. 99.1%. 1734 IIIIIIIII© International Journal of Pharma Research and Health Sciences. All rights reserved.
(5) Int J Pharma Res Health Sci. 2017; 5 (4): 1731-35 Table 9: Accuracy results for Cefixime %Concentration Amount Amount (at specification Area Added Found Level) (ppm) (ppm). 5. ACKNOWLEDGEMENT % Recovery. 50%. 37165. 7.5. 7.5. 100. 100%. 72393. 15. 15.0. 100. 150%. 108416. 22.5. 22.6. 101.1. Mean Recovery. 100.3%. We thank the Sura Lab Hyderabad to allow us to carry out the HPLC studies and TRRCP management for supporting us to complete our project work.. 6. REFERENCES. 1. Marino PL, Sutin KM. Antimicrobial therap, Lippincott Williams & Wilkins. 2007, 817.. Robustness studies were performed for the change in Organic phase ratio and change in the flow rate and method was found to be robust Table 10 and 11. Hence the developed method was found to be adequately resolving the separation of linezolid and cefixime and method was validated as per ICH Q2R (1) manual was found to be within the acceptance criteria. Table 10: Results for Robustness studies of Linezolid Parameter used for Peak Area sample analysis. Retention Time. Theoretical Tailing plates factor. 2.403. 4242. 2.984. 5405. 780183. 2.011. 5365. Less organic phase. 782932. 2.429. 4393. 1.2. More Organic phase. 783192. 2.384. 4358. 1.1. Actual Flow rate of 781541 0.9mL/min Less Flow rate of 781047 0.8mL/min More Flow 1.0mL/min. rate. of. 1.1 1.1 1.2. Table 11: Results for Robustness studies of cefixime Parameter used for Peak Area sample analysis Actual Flow rate of 93779 0.9mL/min Less Flow rate of 91374 0.8mL/min. 2. Linezolid, the American Society of Health-System Pharmacists.2016.. 3. Mechanism of Therapeutic Effectiveness of Cefixime against Typhoid Fever. Antimicrobial Agents and Chemotherapy, 2016.. 4. Patel Satish A, Patel Jinalben V. Spectrophotometric method for simultaneous estimation of Cefixime trihydrate and Linezolid in tablet dosage form, International Research Journal of Pharmacy, 4(1), 2013, 161-164. Satyanarayana Battu, Vasudev Pottbathini. Int. J. Pharmacy. 2014; 4(1): 321-329.. 5. Nidhi. S Patel, Falguni B Tandel, Yogita D Patel, Kartavya B Thakkar. Development and validation of stability-indicating HPLC method for simultaneous estimation of cefixime and linezolid. Indian Journal of Pharmaceutical Science. 2014; 76(6): 535-540.. 6. Bhaskarrav Makwana.. A simple, selective, linear, precise and accurate RP-HPLC method was developed and validated for rapid assay of linezolid.International Journal of Science and Research.2014;3(2):249-253.. 7. Sutar. 1.1. SV, Warjurkar RP, Pishwikar SA. Spectrophotometric method for degradation study of cefixime trihydrate. Asian J Biomed Pharm Sci. 2012; 2(1): 50–4.. 1.1. 8. Kapil SK, Santosh VG, Padmanbh BD, Nilesh VG. A. Retention Time. Theoretical Tailing plates factor. 3.954. 6515. 4.945. 4698. More Flow rate of 92846 1.0mL/min. 3.260. 7934. 1.2. simple and sensitive RP-HPLC method for simultaneous estimation of cefixime and ofloxacin in combined tablet dosage form. Int J Pharm Pharm Sci. 2011; 3(1):46–8.. Less organic phase. 91388. 4.803. 4368. 1.3. 9. ICH Validation of analytical procedures: Text and. More Organic phase 92472. 3.431. 5371. 1.1. methodology Q2 (R1), International Conference on Harmonization, 2005.. 10. ICH Stability Testing of New Drug Substances and 4. CONCLUSION A new method was developed for the simultaneous determination of linezolid and cefixime in API and pharmaceutical dosage by RP HPLC. This method was found to be narrative, effortless, precise, accurate and diminutive run time of analysis. The developed method was validated as per the ICH Q2R (1) guidelines and the results obtained were well within the limits. Hence this method can be adopted for the routine analysis of linezolid and cefixime in API and pharmaceutical dosage.. Products Q1A (R2), International Conference on Harmonization, 2003.. 11. Proceedings of the International Convention on Quality for the Pharmaceutical Industry. Toronto, Canada, and: 2002. Sep, ICH Guidance on Analytical Method Validation.. Conflict of Interest: None Source of Funding: Nil. 1735 IIIIIIIII© International Journal of Pharma Research and Health Sciences. All rights reserved.
(6)
Figure

Related documents
A substitution is a mapping from term variables to terms, from sequence variables to sequences, from function vari- ables to functors and from context variables to contexts,
Higher concentrations of both caspase-cleaved CK18 and total CK18 were measured in bile samples compared to serum samples, suggesting that cell death is prominent in the
In our study, we showed that at 2 weeks after ACLT surgery, rats in the model group had significantly higher serum levels of COMP when compared to rats in the control group
The study ’ s primary objective was to demonstrate the ability of the harmonic scalpel (H) to reduce intra- operative conversion rates compared to the conventional monopolar
At a time when research is promoted as a core activity within national health care systems, it is ironic that the bureaucratic complexity of research governance in the United
• The cattle that showed clinical signs before day 16 (early cases) stayed for a long time in the herd, and were culled only after a few days, while cattle that became sick later
In this study, a deterministic SIR model (Susceptible-Infected- Recovered/Removed) was used to compare transmission parameters between a non-vaccinated population and
