ISSN (Online): 2320-9364, ISSN (Print): 2320-9356
www.ijres.org Volume 4 Issue 7
ǁ
July. 2016
ǁ
PP. 23-33
Simulation andPerformance Analysis of IP Backbone Network
forNext Generation Networks
Nathaniel S. Tarkaa
1, Cosmas I. Ani
21Department ofElectrical andElectronics Engineering, University of Agriculture, Makurdi, Nigeria 2
Department ofElectronic Engineering, University of Nigeria, Nsukka, Nigeria
Abstract:
For communication networks, developing a simulation model requires modeling random user demands for network resources; characterizing network resources needed for processing these demands; and estimating system performance based on the result of the simulation. The application of this theory in connection with the design of new systems can help in comparing different solutions and thus eliminate bad solutions at an early stage without having to build up prototypes.In this paper, a simulation model is developed specifically for performance analysis of the softswitchIP backbone network topology designed for Benue State, Nigeriawithin the frameworkof a doctoral thesis.For the purpose of the performance analysis, the modelled traffic at each of the 23 network nodeswasused to create an aggregate traffic table for the 6 core transmission links. By scaling the traffic each time by 20%, ten simulations were performed for each core transmission link using Riverbed Modeler and the results collated for average bandwidth utilization, packet queuing delay and packet loss ratio as the key performance indicators. The performances of the core transmission links were then verified by the plots of the traffic intensities versus thecollected values of the performance metrics. The results of the performance analysis clearly showed that the design of the Benue State IP backbone network satisfied the primary goals of high reliability, scalability and cost-effectiveness.The study demonstrates the effective way the Riverbed Modeler could be used for active performance analysis of IP backbone network designs for Next Generation Networks.Keywords: Next Generation Networks,Performance Analysis, Probabilistic Traffic Model,Riverbed Modeler,Simulation Model
I.
INTRODUCTION
Even the most carefully designed and operated IP network is subject to any number of performance problems ranging from overloaded links and mis-configured routers to server failures.Simulation is a key technology for the investigation of communication networks [1]. Not only is it useful for preliminary study of protocols and network applications, it can reveal unexpected system dynamics.Unlike analytical models, which often require many assumptions and are too restrictive for most real-world systems, simulation modelling places few restrictions on the classes of systems under study [1]. The generation of user demands and their satisfaction are encapsulated in simulation events, which are ordered by their time of occurrence [1]. The success of a simulation study hinges on identifying appropriate performance metrics and then devising a strategy for exploring the ensuing performance response surface [1]. For communication networks, developing a simulation model requires modeling random user demands for network resources; characterizing network resources needed for processing those demands; and estimating system performance based on output data generated by the simulation [1].
There are two basic approaches to the task of network performance evaluation; one is to collect management information from the active elements of the network using a management protocol, and from this information make some inferences about network performance [2]. This can be termed a passive approach to performance measurement in that the approach attempts to measure the performance of the network without disturbing its operation. The second approach is to use an active approach and inject test traffic into the network and measure its performance in some fashion, and relate the performance of the test traffic to the performance of the network in carrying the normal payload [2].
The rest of the paper is organized as follows: Section 2 describes the development of the simulation model. This is followed by a discussion in section 3 of the simulation results and performance analysis. In section 4, the summary of the results are presented.Lastly in section 5 is the conclusion.
II.
DEVELOPMENT OF SIMULATION MODEL
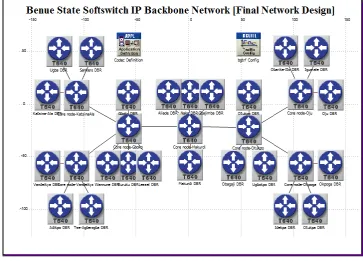
To develop the simulation model used for the performance analysis of the IP backbone network, it was necessary to make use of the same values of the modelled traffic parameters estimated in the previous work [4] and the topology designed within the frame work of the doctoral thesis [3]. The Juniper Networks‟ universal T640 IP router was configured for both the core nodes and edge nodes constituting the IP Layer of the backbone network. The duplex transmission links model and capacities selected and configured in the Modeler in accordance with specified standards [7] is PPP SONET as follows: Gboko – Makurdi = OC-92 (10Gbps); KatsinaAla – Gboko = OC-48 (2.5 Gbps); Otukpo – Makurdi = OC-92 (10Gbps); Oju – Otukpo = OC-48 (2.5 Gbps); Okpoga – Otukpo = OC-48 (2.5 Gbps); and Vandeikya – Gboko = OC-48 (2.5 Gbps). It represents the optical layer of the IP backbone network.Fig. 1 shows the IP backbone network as configured and simulated in Riverbed Modeler environment.
Figure 1: topology of the final design for Benue State softswitch IP backbone network
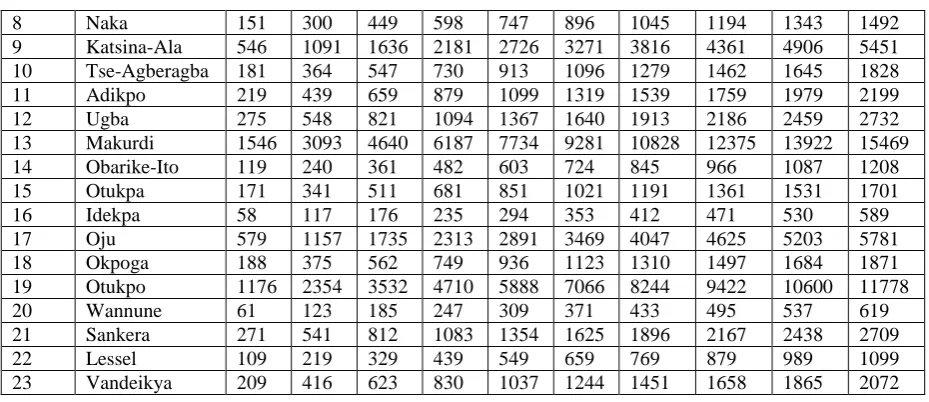
Normally, in the design of telecommunication networks, the quality of service is determined by use of the network‟s key performance metrics. This is usually achieved by making sure that the benchmarks set for these performance metrics are not exceeded with the offered traffic intensity. At the same time, since it is not economically viable to design for 100% network capacity, it is usually necessary to select the amount of traffic that will result in the cost-effective provision of bandwidth. For this reason, a traffic table was createdfor development of the simulation model by varyingthe values of the modelled traffic intensity estimated for 100% of the population starting from 20%.In this way, 10 set of values of the traffic were produced for each network node as presented in Table 1.
Table I: Traffic Table for Simulation of Benue State IP Backbone Network
S/No. Network Nodes Traffic Intensity in Erlangs
1 Igumale 211 423 635 847 1059 1271 1483 1695 1907 2119
2 Obagaji 154 307 460 613 766 919 1072 1225 1378 1531
3 Ugbokpo 144 289 434 579 724 869 1014 1159 1304 1449
4 Buruku 304 610 916 1222 1528 1834 2140 2446 2752 3058
5 Gboko 1504 3007 4510 6013 7516 9019 10522 12025 13528 15031
6 Gbajimba 259 516 773 1030 1287 1544 1801 2058 2315 2572
8 Naka 151 300 449 598 747 896 1045 1194 1343 1492 9 Katsina-Ala 546 1091 1636 2181 2726 3271 3816 4361 4906 5451
10 Tse-Agberagba 181 364 547 730 913 1096 1279 1462 1645 1828
11 Adikpo 219 439 659 879 1099 1319 1539 1759 1979 2199
12 Ugba 275 548 821 1094 1367 1640 1913 2186 2459 2732
13 Makurdi 1546 3093 4640 6187 7734 9281 10828 12375 13922 15469
14 Obarike-Ito 119 240 361 482 603 724 845 966 1087 1208
15 Otukpa 171 341 511 681 851 1021 1191 1361 1531 1701
16 Idekpa 58 117 176 235 294 353 412 471 530 589
17 Oju 579 1157 1735 2313 2891 3469 4047 4625 5203 5781
18 Okpoga 188 375 562 749 936 1123 1310 1497 1684 1871
19 Otukpo 1176 2354 3532 4710 5888 7066 8244 9422 10600 11778
20 Wannune 61 123 185 247 309 371 433 495 537 619
21 Sankera 271 541 812 1083 1354 1625 1896 2167 2438 2709
22 Lessel 109 219 329 439 549 659 769 879 989 1099
23 Vandeikya 209 416 623 830 1037 1244 1451 1658 1865 2072
Using the customized ideal traffic flows designed for the Benue State IP Network topology as reported in the PhD thesis [3], aggregate trafficswere estimated on the core transmission links as presented in Tables 2 – 7.
Table II: Aggregate Traffic for Gboko-Makurdi Core Transmission Link
Edge Nodes Traffic Intensity in Erlangs
Buruku 304 610 916 1222 1528 1834 2140 2446 2752 3058
Gboko 1504 3007 4510 6013 7516 9019 10522 12025 13528 15031
Katsina-Ala 546 1091 1636 2181 2726 3271 3816 4361 4906 5451
Tse-Agberagba 181 364 547 730 913 1096 1279 1462 1645 1828
Adikpo 219 439 659 879 1099 1319 1539 1759 1979 2199
Ugba 275 548 821 1094 1367 1640 1913 2186 2459 2732
Wannune 61 123 185 247 309 371 433 495 537 619
Sankera 271 541 812 1083 1354 1625 1896 2167 2438 2709
Lessel 109 219 329 439 549 659 769 879 989 1099
Vandeikya 209 416 623 830 1037 1244 1451 1658 1865 2072
Total 3,679 7358 11038 14718 18398 22078 25758 29438 33098 36798
Table III: AggregateTraffic for KatsinaAla-Gboko Core Transmission Link
Edge Nodes Traffic Intensity in Erlangs
Katsina-Ala 546 1091 1636 2181 2726 3271 3816 4361 4906 5451
Ugba 275 548 821 1094 1367 1640 1913 2186 2459 2732
Sankera 271 541 812 1083 1354 1625 1896 2167 2438 2709
Total 1092 2180 3269 4358 5447 6536 7625 8714 9803 10892
Table IV: Aggregate Traffic for Otukpo-Makurdi Core Transmission Link
Edge Nodes Traffic Intensities in Erlangs
Igumale 211 423 635 847 1059 1271 1483 1695 1907 2119
Obagaji 154 307 460 613 766 919 1072 1225 1378 1531
Ugbokpo 144 289 434 579 724 869 1014 1159 1304 1449
Obarike-Ito 119 240 361 482 603 724 845 966 1087 1208
Otukpa 171 341 511 681 851 1021 1191 1361 1531 1701
Idekpa 58 117 176 235 294 353 412 471 530 589
Oju 579 1157 1735 2313 2891 3469 4047 4625 5203 5781
Okpoga 188 375 562 749 936 1123 1310 1497 1684 1871
Otukpo 1176 2354 3532 4710 5888 7066 8244 9422 10600 11778
Total 2800 5603 8406 11209 14012 16815 19618 22421 25224 28027
Table V: Aggregate Traffic for Oju-Otukpo Core Transmission Link
Edge Nodes Traffic Intensities in Erlangs
Obarike-Ito 119 240 361 482 603 724 845 966 1087 1208
Oju 579 1157 1735 2313 2891 3469 4047 4625 5203 5781
Total 909 1820 2731 3642 4553 5464 6375 7286 8197 9108
Table VI: Aggregate Traffic for Okpoga-Otukpo Core Transmission Link
Edge Nodes Traffic Intensities in Erlangs
Otukpa 171 341 511 681 851 1021 1191 1361 1531 1701
Idekpa 58 117 176 235 294 353 412 471 530 589
Okpoga 188 375 562 749 936 1123 1310 1497 1684 1871
Total 417 833 1249 1665 2081 2497 2913 3329 3745 4161
Table VII: Aggregate Traffic for Vandeikya-Gboko Core Transmission Link
Edge Nodes Traffic Intensities in Erlangs
Tse-Agberagba 181 364 547 730 913 1096 1279 1462 1645 1828
Adikpo 219 439 659 879 1099 1319 1539 1759 1979 2199
Vandeikya 209 416 623 830 1037 1244 1451 1658 1865 2072
Total 609 1219 1829 2439 3049 3659 4269 4879 5489 6099
Table 8 represents the summary of the aggregate traffic.It is used for simulation of the Benue State IP Backbone network for the purpose of the performance analysis. The simulation was conducted by starting with the values from the first column and proceeding to the last column while the traffics were scaled each time by 20% to obtain the values in the next columns.
Table VIII:Summary of Aggregate Traffic for the Core Transmission Links
Core Transmission
Links
Capa city
Traffic Intensities in Erlangs
Gboko – Makurdi
10 Gbps
3,679 7358 11038 14718 18398 22078 25758 29438 33098 36798
KatsinaAla – Gboko
2.5 Gbps
1092 2180 3269 4358 5447 6536 7625 8714 9803 10892
Otukpo – Makurdi
10 Gbps
2800 5603 8406 11209 14012 16815 19618 22421 25224 28027
Oju – Otukpo 10 Gbps
909 1820 2731 3642 4553 5464 6375 7286 8197 9108
Okpoga – Otukpo
2.5 Gbps
417 833 1249 1665 2081 2497 2913 3329 3745 4161
Vandeikya – Gboko
2.5 Gbps
609 1219 1829 2439 3049 3659 4269 4879 5489 6099
III.
SIMULATION RESULTS AND PERFORMANCE ANALYSIS
Fig. 2 (a) and (b) shows the variation of queuing delay and bandwidth utilization respectively with the traffic intensity for the Gboko-Makurdi core transmission link. In Fig. 2 (a), it can be seen that the queuing delay increases with traffic intensity, which implies that the network is performing normally. The values of the queuing delay fall within acceptable limits for an efficient performance of the network for all values of traffic intensity. It is noteworthy that the queuing delay is low and fairly constant up to a traffic load just above 25000 Erlangs and then begins to climb more rapidly for further increases in traffic intensity.
(a) queuing delay versus traffic intensity
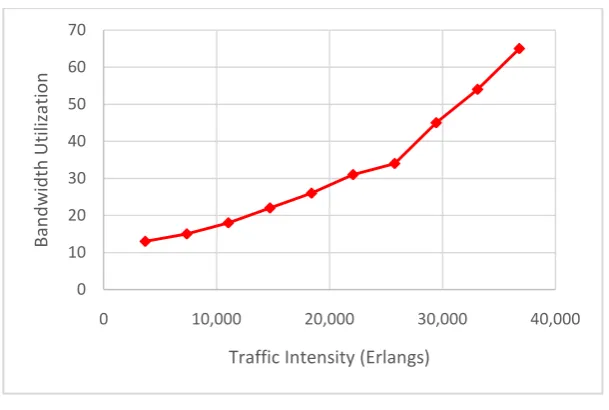
(b) Bandwidth utilization versus traffic intensity
Figure 2: performance analysis for Gboko – Makurdi core transmission link
Fig. 2 (b) shows how bandwidth utilization varies with increases in traffic intensity. It can be seen that bandwidth utilization also increases with traffic intensity, which is also natural for the performance of the network. It can be seen that for the whole period of simulation for all values of traffic, the bandwidth utilization lies below the benchmark with the highest value being 65%. A relatively steeper rise in bandwidth utilization can be noticed above values of traffic exceeding 25,000 Erlangs.
Fig. 3 (a) and (b) shows the variation of queuing delay and bandwidth utilization respectively with the traffic intensity for theKatsina Ala – Gboko core transmission Link. It can be seen in Fig. 3 (a) that the queuing delay has acceptably low and fairly constant values. However, this lasts only for values of traffic intensity below 7000 Erlangs. Beyond this value, the queuing delay increases rapidly to an abysmal value of 280ms and apparently remains so for further increases in traffic. In Fig. 3 (b), it can be seen that bandwidth utilization is
0 0.00002 0.00004 0.00006 0.00008 0.0001 0.00012 0.00014 0.00016 0.00018 0.0002
0 10,000 20,000 30,000 40,000
Qu
eu
in
g
De
lay
(ms
)
Traffic Intensity (Erlangs)
0 10 20 30 40 50 60 70
0 10,000 20,000 30,000 40,000
Ban
d
w
id
th
U
tiliza
tio
n
also increasing with traffic intensity, which implies that the network is functioning normally. The rise in bandwidth utilization is quite rapid with every increase in traffic intensity. At a point just above 7000 Erlangs, the bandwidth utilization reaches 100 % and apparently remains at this level for any further increases in traffic intensity. It is important to take note of this region of the graph to avoid overloading of the transmission link.
(a) queuing delay versus traffic intensity
(b) bandwidth utilization versus traffic intensity
Figure 3: performance analysis for KatsinaAla – Gboko core transmission link
Fig. 4 (a) and (b) shows the variation of queuing delay and bandwidth utilization respectively with the traffic intensity for the Otukpo – Makurdi core transmission link. It can be seen in Fig. 4 (a) that the values of
0 50 100 150 200 250 300
0 2000 4000 6000 8000 10000 12000
Qu
eu
in
g
De
lay
(ms
)
Traffic Intensity (Erlangs)
0 20 40 60 80 100 120
0 2000 4000 6000 8000 10000 12000
Ban
d
w
id
th
U
tiliza
tio
n
queuing delay are satisfactorily low almost coinciding with the traffic intensity axis. This happens only as far as the traffic does not exceed 25000 Erlangs. It can be seen that beyond this value, the link suffers severe degradation as the queuing delay increases exponentially to an unacceptable level of 150ms. The graph of bandwidth utilization which is shown in Fig. 4 (b) further accentuates the performance of the Benue State IP backbone network with respect to the Otukpo – Makurdi core transmission link. The bandwidth utilization increases normally with traffic intensity and can be seen becoming steeper around 22500 Erlangs. Beyond this value it quickly peaks at 100% and apparently stays there for any more increases in traffic intensity.
(a) queuing delay versus traffic intensity
(b) bandwidth utilization versus traffic intensity
Figure 4: performance analysis for Otukpo – Makurdi core transmission link 0
20 40 60 80 100 120 140 160
0 5000 10000 15000 20000 25000 30000
Qu
eu
in
g
De
lay
(ms
)
Traffic Intensity (Erlangs)
0 20 40 60 80 100 120
0 5000 10000 15000 20000 25000 30000
Ban
d
w
id
th
U
tiliza
tio
n
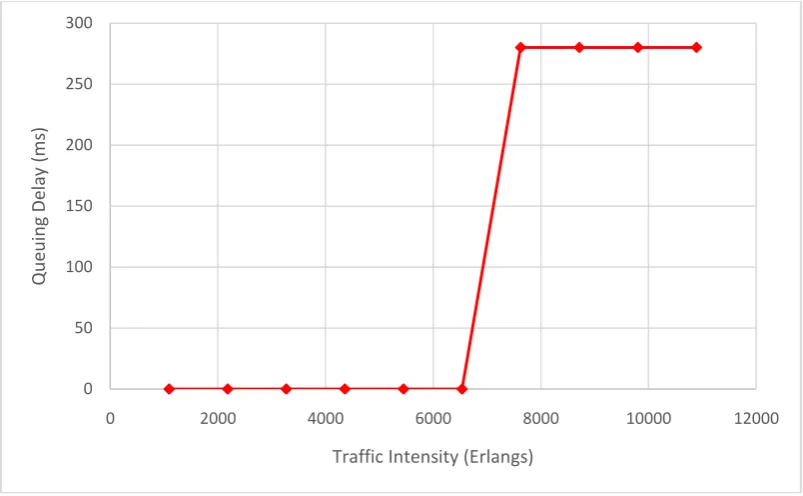
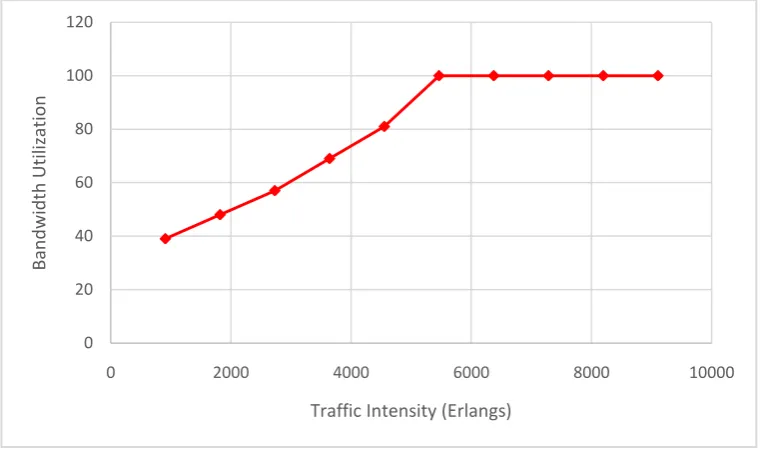
Fig. 5 (a) and (b) shows the variation of queuing delay and bandwidth utilization respectively with the traffic intensityfor theOju – Otukpo core transmission Link. From Fig. 5 (a), it is obvious that the Oju – Otukpo core transmission link cannot take traffic more than 4,500 Erlangs for it not to perform abnormally. It can be seen that beyond this traffic, the queuing delay changes sharply to the abnormal level of 280 ms and apparently remains at this saturation point thereby congesting the network along this link for all further increases in traffic. The situation along the Oju – Otukpo link is further described by the graph of bandwidth utilization versus traffic intensity presented in Fig. 5 (b). The graph shows clearly that the performance of the link is poor for all values of traffic intensity above 5000 Erlangs as the bandwidth utilization is at its peak at 100% for these values.
(a) queuing delay versus traffic intensity
(b) bandwidth utilization versus traffic intensity
Figure 5: performance analysis for Oju – Otukpo core transmission link 0
50 100 150 200 250 300
0 2000 4000 6000 8000 10000
Qu
eu
in
g
De
lay
(ms
)
Traffic Intensity (Erlangs)
0 20 40 60 80 100 120
0 2000 4000 6000 8000 10000
Ban
d
w
id
th
U
tiliza
tio
n
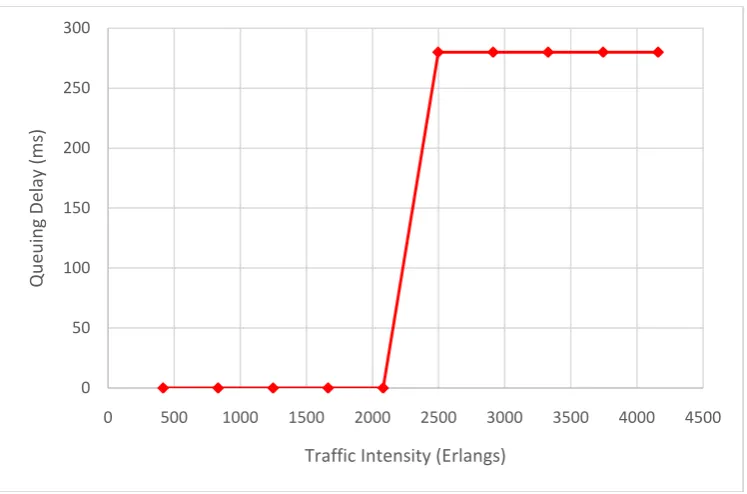
Fig. 6 (a) and (b) shows the variation of queuing delay and bandwidth utilization respectively with the traffic intensityfor the Okpoga – Otukpo core transmission Link. It is obvious from Fig. 6 (a) that as far as the Okpoga – Otutkpo transmission link is concerned, the performance of the network will be abnormal for traffics more than 2000 Erlangs. It can be seen that above this figure, the network switches to a state of congestion along this link as the queuing delay changes drastically to an extremely high point at 280 ms and apparently remains at this level for all higher traffics. In terms of bandwidth utilization, it can be seen that the congestion of the link sets in with the traffic equal to 2500 Erlangs and persists for all higher traffics as can be seen in Fig. 6 (b).
(a) queuing delay versus traffic intensity
(b) Bandwidth utilization versus traffic intensity
Figure 6: performance analysis for Okpoga – Otukpo core transmission link 0
50 100 150 200 250 300
0 500 1000 1500 2000 2500 3000 3500 4000 4500
Qu
eu
in
g
De
lay
(ms
)
Traffic Intensity (Erlangs)
0 20 40 60 80 100 120
0 500 1000 1500 2000 2500 3000 3500 4000 4500
Ban
d
w
id
th
U
tiliza
tio
n
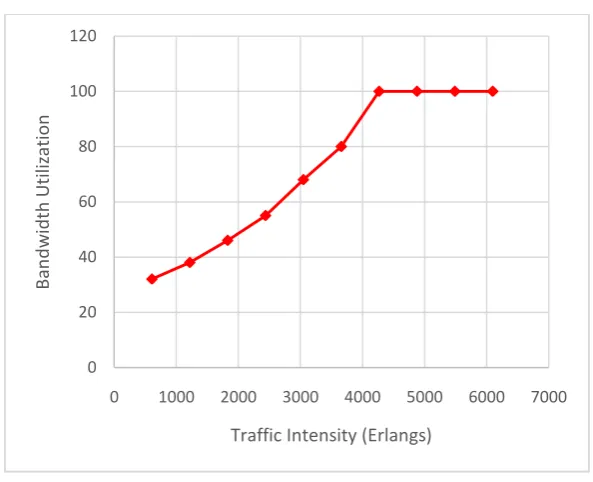
Fig. 7 (a) and (b) shows the variation of queuing delay and bandwidth utilization respectively with the traffic intensity for the Vandeikya – Gboko core transmission Link.Considering the graph of queuing delay against traffic intensity presented in Fig. 7 (a), it is clear that at points above the traffic of about 3500 Erlangs, the queuing delay has switched from a near-zero level to an abysmal value of 280 ms which apparently remains unchanged for all higher values of traffic intensity. In terms of bandwidth utilization, Fig.7 (b) confirms that the performance of the network may only be acceptable if the traffic offered to the transmission link is about 3000 Erlangs and less.
(a) queuing delay versus traffic intensity
(b) Bandwidth utilization versus traffic intensity
Figure 7: performance analysis for Vandeikya – Gboko core transmission link
IV.
SUMMARY OF RESULTS
The Gboko – Makurdi core transmission link has the best performance. It is the only transmission link that did not show any sign of overloading with all the ten values of the traffic intensities. The next best performing transmission link is Otukpo – Makurdi. The link showed overloading only when it was simulated with the last two traffic intensities respectively. Two transmission links, namely Katsina Ala – Gboko and Vandeikya – Gboko exhibited similar patterns of behaviour. Both links performed normally with six values of
0 50 100 150 200 250 300
0 1000 2000 3000 4000 5000 6000 7000
Qu
eu
in
g
De
lay
(ms
)
Traffic Intensity (Erlangs)
0 20 40 60 80 100 120
0 1000 2000 3000 4000 5000 6000 7000
Ban
d
w
id
th
U
tiliza
tio
n
the traffic intensities and showed overloading for the remaining four simulations. Another pair of transmission links, namely, Oju – Otukpo and Okpoga – Otukpo also exhibited similar patterns of behaviour. In this case, both links performed normally for five values of the traffic intensities and showed overloading for the last five simulations. However, all the transmission links performed well up to the values corresponding to 100 % of the modelled traffic. The corresponding values of bandwidth utilization at these traffic points are given as: Gboko – Makurdi = 26%; Otukpo – Makurdi = 42%; Katsina Ala – Gboko = 69%; Vandeikya – Gboko = 68%; Oju – Otukpo = 81; and Okpoga – Otukpo = 81. This is a clear indication the design of the Benue State IP backbone network satisfies the primary goals of high reliability, scalability and cost-effectiveness. It is noteworthy that the best performing transmission links, namely Gboko – Makurdi and Oukpo – Makurdi constitute the inner core of the backbone network and naturally require to be designed to be more resilient than the outer core made up of Katsina Ala – Gboko, Vandeikya – Gboko, Oju – Otukpo, and Okpoga – Otukpo and this is accordingly demonstrated by the above-stated results.
V.
CONCLUSION
The main problem addressed in this paper is simulation and performance testing of IP backbone network.The results of the analysis showed that all the 6 core transmission links performed well up to the values corresponding to 100 % of the modelled traffic. It is noteworthy that the best performing transmission links, namely Gboko – Makurdi and Oukpo – Makurdi constitute the inner core of the backbone network and naturally require to be designed to be more resilient than the outer core made up of Katsina Ala – Gboko, Vandeikya – Gboko, Oju – Otukpo, and Okpoga – Otukpo and this is accordingly demonstrated by the results of the performance analysis. The measured queuing delay and packet loss ratio also showed appreciable optimal levels for all normal performance conditions. On the whole, the results showed that the design of the Benue State IP backbone network satisfies the primary requirements of high reliability, scalability and cost-effectiveness.The study demonstrates the effective way the Riverbed Modeler could be used for active performance analysis of IP backbone network designs for Next Generation Networks.
REFERENCES
[1]. Victor S. Frost, Benjamin Melamed, „Traffic Modeling for Telecommunications Networks”, IEEE Communications Magazine, March, 1994.
[2]. Geoff Huston, Telstra, “Measuring IP Network Performance”, The Internet Protocol Journal, volume 6, Number 1, March, 2003.
[3]. TarkaaSaaku Nathaniel, Modelling and Characterization of Softswitch IP Based Backbone Network in a Developing Economy – Benue State, Nigeria, Department of Electronic Engineering, University of Nigeria, Nsukka, Thesis to obtain the Degree of Doctor of Philosophy in Electronic Engineering, 2016.
[4]. Nathaniel S. Tarkaa and Cosmas I. Ani, “Modeling and Characterization of Next Generation Network: From Data Collection to Estimation of Traffic Parameters”, American Journal of Engineering Research (AJER) Volume-4, Issue-10, 2015, pp-167-177.
[5]. Oscar González Soto, ITU Consultant Expert, Spain, “Multimedia Traffic Modeling and QoS in NGN”, Regional Workshop on Assistance to the Arab Region for the implementation of Next Generation Networks (NGN), Cairo (Egypt), 15-16 December 2009.
[6]. “Quality of Service Issues in IP/NGN Networks”, users.jyu.fi/~/timoh/kurssit/verkot/lectures 3_4.pdf.
[7]. RajendranParthiban, “Modeling and Analysis of Optical Backbone Networks”, PhD Thesis, Department of Electrical and Electronic Engineering, The University of Melbourne, Australia, April, 2004.
[8]. “Introduction to Riverbed Modeler Academic Edition: Common procedures when using Riverbed Modeler Academic Edition”, splash.riverbed.com/docs/Doc-4833.
[9]. Byrav Ramamurthy, K.K. Ramakrshnan, Rakesh K. Sinha, “Cost and Reliability Considerations in Designing the Next-Generation IP over WDM Backbone Networks”, Published in Computer Communications and Networks (ICCCN) ISSN1095-2055, 2011 Proceedings of 20th International Conference, PP 1-6.
[10]. Khalid Raza, Mark Turner, “CISCO Network Topology and Design”, 2002. ciscopress.com/articles/article.asp?p=25188seqN=5
[11]. “Introducing Network Design Concepts“OSPF Design Guide”, Technology White Paper
[12]. “The Best Practice Backbone Design (Data Communications and Networking)”, what-when-how.com“Backbone Networks”,
[13]. “Backbone in The Network Encyclopedia”,
[14]. DocWiki, “Internetwork Design Guide – Designing Large-Scale IP Internetworks”, docwiki.cisco.com/internetwork_Design_Guide_- _Designing – Large – Scale – IP_Int.
[15]. “Backbone in The Network Encyclopedia”, http://www.thenetworkencyclopedia.com/entry/backbone/. DocWiki, “Internetwork Design Guide – Designing Large-Scale IP Internetworks”,