Separation of Acetic Acid from
Aqueous Solution
using Various Organic Solvents
Sumona Haque1,M. Z. H. Khan2, Bhupesh Chandra Roy1, Md. Helal Uddin1,*
1
Dept. of Applied Chemistry and Chemical Technology, Islamic University, Kushtia, Bangladesh
2
Dept. of Chemical Engineering, Jessore Science and Technology University, Jessore, Bangladesh
*Corresponding email: zaved.khan@yahoo.com
Abstract
In the study a model has been developed to separate the acetic acid from aqueous solution by liquid-liquid extraction and find out the proper solvent for this separation. Various solvents such as n-butanol, iso butanol, amyl alcohol and ethyl acetate are used for separation of acetic acid from water. The binodal curves (mutual solubility curves) for acetic acid distributed between water and an organic solvent were obtained by titrating known mixtures of two components (water and solvents) with the third component acetic acid to the point of first appearance of permanent turbidity. In order to determine the tie-lines, the absorbance of the coexisting phases, obtained by the separation of ternary mixtures within the binodal curve are needed to be determined. The absorbance of each point had been determined by a UV spectrophotometer. Distribution diagrams are obtained by plotting weight percent of acetic acid in solvent phase against the weight percent of acetic acid in water phase. Selectivity diagrams are also obtained by plotting (wt. % of acetic acid) / (percent of acetic acid + percent of water) in solvent phase against the same quantity in the diluent phase. The separation factor is determined numerically from the tie-line data.
1. INTRODUCTION
Acetic acid is one of the most widely used carboxylic acids. It is used in many reactions, for example in synthesis of acetic esters, or it can be used as a solvent, for example in the manufacture of cellulose acetate or pharmaceutical products. Acetic acid biosynthesis produces important quantities of aqueous solutions from which acetic acid should be economically recovered [1-3].
The separation of acetic acid from aqueous solutions by simple rectification is difficult, requiring a column with many stages and a high reflux ratio, the whole process being very expensive [4]. Other processes may be used, depending of the acetic acid concentration in the solution. For example, extractive distillation [5] is used for acid concentrations between 50 and 70 % w/w. By adding a third component water volatility is increased and the process may be carried out with low energy consumption. For acetic acid concentrations lower than 40 % w/w the liquid- liquid extraction can be an appropriate process [6-10]. This process is also useful when other components interfere with direct distillation. In this paper an experimental study of acetic acid liquid - liquid extraction with back extraction and solvent recycling is presented. Ethyl acetate and ethyl ether were used as extraction solvents because of the good solubility of acetic acid into them; the rapid separation of the acid from the extract is another criterion that sustains these solvents’ selection. The influence of process parameters on the separation efficiency was studied by experimental analysis and mathematical modeling.
2. MATERIALS AND METHOD
All the materials used were of laboratory reagent grade. The method that was used for the determination of mutual solubility data of the present work is the “titration method” of [11]. All the measurements were carried out at 24 – 25°C.The mutual solubility curves for each system were obtained by titrating known mixture of two components with the third one to the point of first appearance of permanent turbidity and the absorbance of the mixture at this point is measured by U-V spectrophotometer using wave length range 190nm-250nm.To add tie line data, various mixtures of known compositions within the heterogeneous region were prepared, brought to equilibrium and the compositions of conjugate phases were determined by measurement of absorbance, in conjugation with the calibration curves prepared with the system of known composition on the solubility curves [12].
3. RESULTS AND DISCUSSION
3.1 Determination of Mutual Solubility Curves
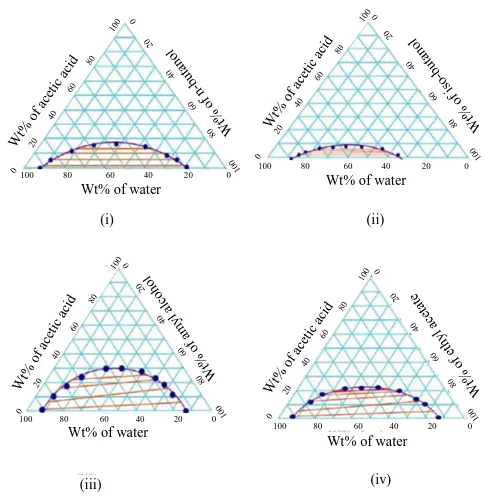
Ten to twenty milliliter of water (diluent) was measured into a 125 mL Erlenmeyer flask and solvent n-butanol was added from a burette and agitated until the solution became just turbid. The amounts are recorded as the maximum solubility of solvent in diluents, since the turbidity indicated the formation of second phase, the solvent layer. The compositions of the mixture at the maximum solubility were expressed in weight percent. Two drops of the water was added to this mixture and because of its consolute effect, a clear solution was resulted. Then an arbitrarily chosen amount of solute acetic acid was added so that the composition of resulting mixture moved outside the solubility curve and the solvent was again added until turbidity results and second point on the binodal curve was obtained.
Similarly, mutual solubility curve for acetic acid-water-iso-butanol system, acetic acid-water-amyl alcohol system, acetic acid-water-ethyl acetate system were also obtained. Mutual solubility curves for each of these systems are shown in Figure 1.
Wt% of water
100 80 60 40 20 0
(i)
Wt% of water
100 80 60 40 20 0
(ii)
Wt% of water
100 80 60 40 20 0
(iii)
Wt% of water
100 80 60 40 20 0
(iv)
Figure 1: Mutual solubility curve and tie lines for the system acetic acid -water- solvent systems, n-butanol (i), iso-butanol (ii), amyl alcohol (iii), ethyl acetate (iv).
3.2 Determination of Calibration Curve
3.3 Determination of Tie Line Data
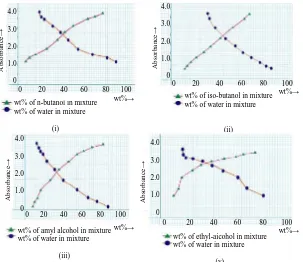
Tie line data of each of these systems were obtained by taking about 20 milliliter of solvent and an equal amount of diluents (water) in a flask and 2 to 5 cubic milliliter of acetic acid (solute) was added to give ternary mixture of known composition within the heterogeneous region of the mutual solubility curve, brought to equilibrium and the absorbance of these two co-existing phases were measured. Comparing with this absorbance, the composition of the two co-existing phases in the ternary mixtures was read off from the previously determined calibration curve. By the successive addition of solute in this ternary mixture, the other tie line data for these systems are obtained until a single phase existed shown in Figure 2.
0 20 40 60 80 100
4.0
3.0 2.0
1.0
0
wt% of n-butanol in mixture wt% of water in mixture
(i) wt%→ Ab so rb an ce →
0 20 40 60 80 100 4.0
3.0 2.0 1.0 0
wt% of iso-butanol in mixture wt% of water in mixture
(ii) wt%→ A bso rb an ce → 4.0 3.0 2.0 1.0 0
0 20 40 60 80 100 wt% of amyl alcohol in mixture wt% of water in mixture
(iii) wt%→ A bso rb an ce →
0 20 40 60 80 100
4.0 3.0 2.0 1.0 0
wt% of ethyl-aicohol in mixture wt% of water in mixture
(v) wt%→ A bso rb an ce →
Figure 2: Correlation between absorbance and composition of equilibrium mixtures, acetic acid -water-n-butanol (i), acetic acid–water-iso butanol (ii), acetic
3.4 Determination of Separation Factor and Selectivity Diagram
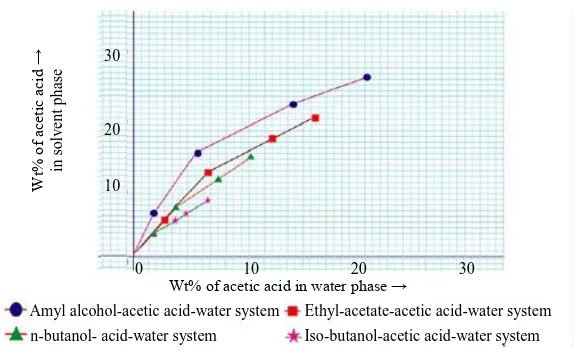
The separation factor and distribution coefficient of acetic acid between diluent and solvent were determined numerically [12] from the tie line data. Distribution coefficient of acetic acid are obtained by the ratio of weight percent of acetic acid in solvent phase to the weight percent of acetic acid in water phase, which is larger than 1 for all the system but acetic acid-water-amyl alcohol system shows the highest value (3.0). This indicates that acetic acid has preferential solubility between water and alcohol which is the key factor in the extraction process. Distribution diagram is shown in Figure 3. Separation factor is a measure of the solubility of solvents to separate acetic acid from aqueous solution. Separation factor is the ratio of distribution coefficient of solute (acetic acid) to the distribution coefficient of diluent (water). It is denoted by S. Distribution coefficient of water is the ratio of weight fraction of diluents in solvent phase to that in diluents phase. It is shown that the separation factor for the system acetic acid-water-amyl alcohol is the highest.
Figure 3: Equilibrium diagram for acetic acid –water-solvents system.
The selectivity of solvent is its ability to separate the components of a given mixture. Selectivity diagram is obtained directly from the data determined for the distribution or (tie-line data) and binodal curves. This is plot of (percent solute) / (percent solute + percent diluents) in the solvent phase against the same quantity in the diluents phase. It indicates directly in each layer the concentration of the soltute in diluent without reference to the amount of solvent present and is found by picking the numerical values from the extremities of the tie-lines. Figure 4 reveals that amyl alcohol shows the highest selectivity than other solvents. The plots obtained following the
0 10 20 30 30
20
10
W
t%
of
a
ce
tic
a
ci
d
→
in
so
lv
en
t
p
h
ase
Wt% of acetic acid in water phase → Amyl alcohol-acetic acid-water system
n-butanol- acid-water system
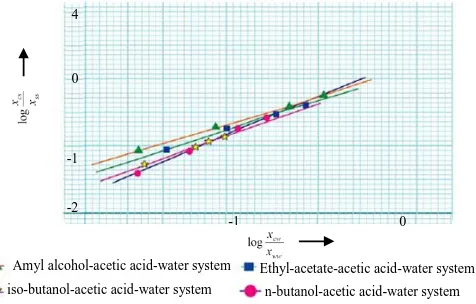
Hand’s method are also shown in Figure 5.This figure shows that the tie line data of systems are correlated by straight line.
0 10 20 60
40
20
0
Wt% of acetic acid in water phase on solvent free basis →
W
t%
o
f
ac
et
ic
a
ci
d
in
s
o
lv
en
t
→
o
n
so
lv
en
t fr
ee
b
as
is
Amyl alcohol-acetic acid-water system n-butanol- acid-water system
Ethyl-acetate-acetic acid-water system Iso-butanol-acetic acid-water system
Figure 4: Selectivity diagram for acetic acid –water-solvents system.
4
0
-1
-2
-1 0
Ethyl-acetate-acetic acid-water system n-butanol-acetic acid-water system Amyl alcohol-acetic acid-water system
iso-butanol-acetic acid-water system
Figure 5: Hand’s plot of tie line correlation. Where, Wt fraction of acetic acid in solvent phase = Xcs, Wt fraction of solvent in solvent phase =Xs, Wt fraction of acetic acid in
4. CONCLUSIONS
Experimental studies concerning the separation of acetic acid from its aqueous solution, using different solvents were performed in an experimental plant having two columns as major components. The experimental results illustrate the possibility to use n-butanol, iso-butanol, amyl alcohol, ethyl acetate as specific solvents for this separation technique. Mutual solubility data, distribution coefficient, separation factor data and selectivity diagrams have been studied and it was observed that among these four solvents amyl alcohol is the most selective for the separation of acetic acid from its aqueous solution.
REFERENCES
[1] Park, Y.S., Toda, K., Fukaya, M., Okumura, H., Kawamura. Y. (1991). Appl. Microbiol. Biotechnol., Vol. 35 pp. 149-153.
[2] Tesfaye, W., Morales, L., Garcia-Parella, C., Trocaso, M.A. (2002). Trends in Food Science and Technology, Vol. 13 pp. 12-21.
[3] Macias, M., Ildefonso, C., Cantero, D. (2001) Chemical Engineering Journal, Vol. 65. pp. 201-207.
[4] Sebastiani, E., Lacquaniti, L. (1967). Chemical Engineering Science, Vol. 22. pp. 1155-1162.
[5] Further, F.W., Cook, A.R. (1967). Journal of Heat and Mass Transfer, Vol. 10. pp. 23-37.
[6] Cerna, M., Bizek, V., Stastova, V., Rodd, V. (1993). Chemical Engineering Science, Vol. 48. pp. 99-103.
[7] Dobre, T., Dinculescu, D., Anicuta, G., Floarea, O. (1998), SICHEM, Vol. 98. pp. 56-63.
[8] Patnaik, R.P. (1995). Biothechnology Advances, Vol. 13. Pp. 175-208.
[10] Pokorn, N., Ichiro, I., Shiro, N. (1987). Journal of Fermentation Technology, Vol. 65. pp. 699-702.
[11] Othmer, D.F, White, R.E., Trueger, D.E. (1941). J. Ind. Eng.chem., Vol. 33. pp.240-1245.