Open Access
Research article
Quality gap of educational services in viewpoints of students in
Hormozgan University of medical sciences
Teamur Aghamolaei*
1and Shahram Zare
2Address: 1Department of Health Services, School of Public Health, Hormozgan University of Medical Sciences, Bandar Abbas, Iran and 2Department of Social Medicine, School of Medicine, Hormozgan University of Medical Sciences, Bandar Abbas, Iran
Email: Teamur Aghamolaei* - teamurp@yahoo.com; Shahram Zare - shzare@hums.ac.ir * Corresponding author
Abstract
Background: Higher education is growing fast and every day it becomes more and more exposed to globalization processes. The aim of this study was to determine the quality gap of educational services by using a modified SERVQUAL instrument among students in Hormozgan University of Medical Sciences.
Methods: A cross-sectional study was carried out at Hormozgan University of Medical Sciences in 2007. In this study, a total of 300 students were selected randomly and asked to complete a questionnaire that was designed according to SERVQUAL methods. This questionnaire measured students' perceptions and expectations in five dimensions of service that consists of assurance, responsiveness, empathy, reliability and tangibles. The quality gap of educational services was determined based on differences between students' perceptions and expectations.
Results: The results demonstrated that in each of the five SERVQUAL dimensions, there was a negative quality gap. The least and the most negative quality gap means were in the reliability (-0.71) and responsiveness (-1.14) dimensions respectively. Also, there were significant differences between perceptions and expectations of students in all of the five SERVQUAL dimensions (p < 0.001).
Conclusion: Negative quality gaps mean students' expectations exceed their perceptions. Thus, improvements are needed across all five dimensions.
Background
Education is a service directly impacted on by the pro-vider. Higher education institutions are placing greater emphasis on meeting students' expectations and needs. As universities continue to become more student oriented, student perceptions of higher educational facilities and services are becoming more important [1]. Educational services quality, emphasizing student satisfaction, is a
newly emerging field of concern in the medical sciences universities of Iran.
The contradictory meanings of quality education have led to the adoption of different methods for measuring qual-ity in higher education [2]. Most of the studies focused on either measuring teaching quality or evaluating students' learning experiences [3-5].
Published: 18 June 2008
BMC Medical Education 2008, 8:34 doi:10.1186/1472-6920-8-34
Received: 1 February 2008 Accepted: 18 June 2008
This article is available from: http://www.biomedcentral.com/1472-6920/8/34
© 2008 Aghamolaei and Zare; licensee BioMed Central Ltd.
Interest in the measurement of service quality is high, however, as highlighted by several researchers, service quality is an elusive and abstract concept that is difficult to define and measure [6-8]. For several years, academic researchers measured service quality by employing uni-dimensional scales; uni-uni-dimensional scales, however, are inappropriate to measure a multi-dimensional concept like quality [9]. Parasuraman, Zeithmal and Berry con-structed a multi-item scale measuring perceived service quality. This scale is SERVQUAL. The SERVQUAL instru-ment represents a multi-item scale that can be used for measuring perceptions and expectations of service quality as perceived by consumers [10]. This scale assesses cus-tomers' perceptions and expectations of service quality along five dimensions: tangibles (the appearance of the school physical facilities, equipment, personal, and com-munication materials), reliability (the school's ability to perform the promised services dependably and accu-rately), responsiveness (the school's willingness to help students and provide prompt service), assurance (the knowledge and courtesy of school office staff/faculty and their ability to convey trust and confidence), and empathy (the school office staff's and faculty's ability to provide a caring and individualized attention to students) [9].
Berry (1995) suggests that service plays an important role in enhancing value, and can positively influence a firm's success. Understanding and measuring customer expecta-tions and performance are an essential component that can be used to enhance a company's service provision [11]. The aim of this study was to determine the quality gap of educational services by using a modified SERV-QUAL instrument among students in Hormozgan Univer-sity of Medical Sciences. This study helps to locate areas of performance where improvements are needed, or areas where resources could be better utilized.
Parasuraman et al., (1988) defined service quality as the gap between consumers' expectations and perceptions [10]. Gap analysis is not new in a higher educational con-text, and a number of studies have been influenced by the work of Parasurman et al [10]. For example, Long et al (1999) used "gap analysis" to develop a number of ques-tions in order to compare what students "look for" (expect) and what they "experience" on a course [12]. Sander et al. (2000) meanwhile examined undergradu-ates' expectations and preferences in teaching, learning, and assessment [13]. LaBay and Comm (2003) also devel-oped a number of measures to evaluate student expecta-tions and percepexpecta-tions, concerning their tutor, on a sample of undergraduate and distance learning students [14].
Methods
The study population consisted of students in Hormozgan University of Medical Sciences in 2007. This university has
three schools including a medical school, health school, and nursing and midwifery school and is located in Hor-mozgan province in the south of Iran. The subjects were students in general medicine, family health, disease con-trol, environmental health, medical entomology, radiol-ogy, operation room, anesthesia, medical records, laboratory sciences, nursing and midwifery fields. A total of 300 students were selected by multi-stage sampling. Proportional to the number of students in each school, the number of students in each course and educational level, the number of subjects was determined in each group. Then in each group the subjects were selected ran-domly. Only the students who had studied at least one term were included in the study.
The instrument was an adaptation of the SERVQUAL sur-vey. The original SERVQUAL survey was specifically designed to assess organizations and businesses in the service sector [10]. Some changes were made to adapt this study's survey to an academic setting. This adaptation of the SERVQUAL survey was made up of twenty-seven par-allel likert scale items measuring five postulated dimen-sions of service quality, which consist of tangibles (4 items), reliability (7 items), responsiveness (5 items), assurance (5 items), and empathy (6 items). This ques-tionnaire was tested in a sample of students at Zahedan University of Medical Sciences (Iran) by Kebriaei and Roudbari [15]. Its content validity and reliability was determined by them. Alpha coefficients of assurance, responsiveness, empathy, reliability and tangibles dimen-sions were 0.79, 0.78, 0.79, 0.89 and 0.85 respectively.
Descriptive statistics, paired t-test, Wilcoxon, Friedman and ANOVA were utilized to evaluate and analyze the data by SPSS13 software. The means were used to compare the students' perceptions and expectations of educational service quality and the gap between them.
This study was approved by the Medical Ethics Committee of Hormozgan University of Medical Sciences. The proce-dures of the study were explained to all subjects, and all provided informed consent.
Results
The mean age of students was 21.5 ± 1.9 years.115 (38.3%) of them were male and 185 (61.7%) were female. In this university female students outnumber their male peers. 147 (49%) were in Associate degree level, 82 (27.3%) in Bachelor of Science (BS) level, and 71 (23.7%) in general medicine level. 71 (23.7%) were in medical school, 152 (50.6%) were in nursing and midwifery school and 77 (25.7%) were in health school.71 (23.7%) were students in medicine, 22 (7.3%) in family health, 17 (5.7%) in disease control, 20 (6.7%) in environmental health, 19 (6.3%) in medical entomology, 18 (6%) in radiology, 13 (4.3%) in operation room, 17 (5.7%) in anesthesia, 19 (6.3%) in medical documents, 16 (5.3%) in laboratory sciences, 34 (11.3%) in nursing, and 34 (11.3%) in midwifery fields.
The results indicated that in all five SERVQUAL dimen-sions, there were negative quality gaps. The least and the most negative quality gap means were in the reliability and responsiveness dimensions respectively (Table 1). There were significant differences between perceptions and expectations of students in all five SERVQUAL dimen-sions (p < 0.001). Also statistically there were significant differences between negative quality gaps in all five SERV-QUAL dimensions (Friedman test: X2 = 86.4, p < 0.001).
The differences between negative quality gaps in each of the five SERVQUAL dimensions, except between assur-ance dimension and empathy and tangibles dimensions, were significant (p < 0.001). These dimensions, with regard to negative quality gaps, can be classified into three groups, so that the responsiveness dimension is placed in one group, the assurance, empathy and tangibles
dimen-sions are placed in another group, and the reliability dimension is placed in a third group.
Also the results showed that in all of the items there were negative quality gaps (Table 2), and there were significant differences between perceptions and expectations of stu-dents in all of them (p < 0.001).
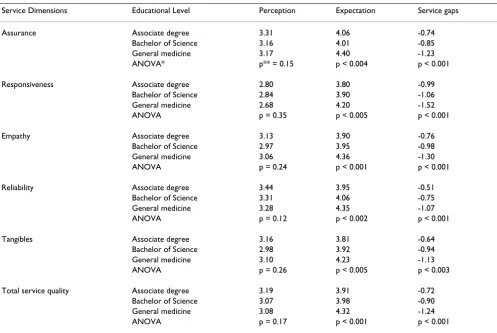
There was no significant difference between perceptions of the students in the Associated degree level, Bachelor of Science (BS) level, and general medicine level, but there were significant differences in expectations among them (Table 3).
Discussion
The aim of this study was to determine the quality gap of educational services using a modified SERVQUAL instru-ment among students in Hormozgan University of Medi-cal Sciences. As the results show in all of the five SERVQUAL dimensions, there is a negative quality gap. This confirms the results of the Kebriaei and Roudbari [15], Braddley [16], and Clare Chua [17] studies. Negative quality gaps mean students' expectations are greater than their perceptions, and it indicates dissatisfaction. Thus, improvements are needed across all five SERVQUAL dimensions.
In this study, the least and the greatest negative quality gap are in the reliability and responsiveness dimensions respectively. The findings support the results of the Kebri-aei and Roudbari study in Zahedan University of Medical Sciences. In a similar study conducted by Ruby, there were negative quality gaps in the reliability, assurance, respon-siveness and empathy dimensions, but there was a posi-tive quality gap in the tangibles dimension; in this dimension, students' perceptions of the educational serv-ices quality was greater than their expectations [18]. The result of Ruby's study in the tangibles dimension doesn't support the result of this study in this dimension. In the Ruby study, the most negative quality gap was in the reli-ability dimension, followed by the responsiveness and empathy dimensions, and the least negative quality gap was in the assurance dimension [18]. In the Clare Chua study concerning the educational services quality at
Ryer-Table 1: Mean level of the students perceptions, expectations and service gaps in five SERVQUAL dimensions
Service Dimensions Perceptions Expectations Service gaps Paired T-Test
t P
Assurance 3.23 ± 0.64 4.13 ± 0.78 -0.89 ± 0.91 -16.8 <0.001
Responsiveness 2.78 ± 0.70 3.92 ± 0.86 -1.14 ± 1.03 -18.9 <0.001
Empathy 3.07 ± 0.69 4.03 ± 0.87 -0.95 ± 0.91 -17.9 <0.001
Reliability 3.37 ± .061 4.07 ± 0.77 -0.71 ± 0.81 -15.1 <0.001
Tangibles 3.10 ± 0.79 3.94 ± 0.91 -0.84 ± 1.05 -13.9 <0.001
son University in Toronto, the greatest negative quality gap was in the assurance dimension, followed by the responsiveness, tangibles and empathy dimensions, and the least negative quality gap was in the reliability dimen-sion [17].
The negative quality gaps in all of the five SERVQUAL dimensions and their items indicate that in order to improve educational services quality, some measures need to be taken. The greatest negative quality gap was in the responsiveness dimension. This dimension indicates the school's willingness to help students and provide prompt services; it also reflects the sensibility and cau-tions to students' demands, quescau-tions and complaints [17,19]. The greatest negative quality gap in this dimen-sion and its items indicates that supervisors are not acces-sible when students need them, students don't have easy
access to the administrator to express their viewpoints and suggestions regarding the curriculum, students' view-points and suggestions are not considered in curriculum, little attention is paid to introducing suitable references to students for reading, and the supervisor's counseling hours are not aptly and properly specified.
Negative quality gaps in other dimensions indicate that responsibilities have not been fulfilled well to meet dents' expectations. Given the viewpoints of most stu-dents and the negative quality gap in each of the five SERVQUAL dimensions, the following educational work-shops are suggested in order to reduce these gaps: "how to communicate with students", "increasing staff skills", and "effective communication of faculty members and stu-dents". On the other hand, supervisors should have a schedule for counseling the students and students should
Table 2: Mean level of the students perceptions, expectations and service gaps in all of SERVQUAL items
Items P* E** Service Gaps Paired T-Test
t P
Assurance
1. Facilitating discussion and interaction about lessons in class 3.36 4.08 -0.72 -10.4 <0.001 2. Qualifying students for future job 2.98 4.24 -1.26 -16.4 <0.001 3. Accessibility of faculty members outside of class to Answer students' questions 3.07 3.80 -0.73 -9.40 <0.001 4. Accessibility of adequate references to increase students' professional knowledge 3.38 4.20 -0.81 -11.1 <0.001 5. Faculty members professional knowledge adequacy 3.39 4.32 -0.93 -13.5 <0.001
Responsiveness
6. Supervisors accessibility when students need them 3.00 4.03 -1.03 -11.7 <0.001 7. Easy accessibility of administrators for students to express views about the curriculum 2.45 3.86 -1.41 -16.5 <0.001 8. Considering students' views and suggestions in curriculum 2.40 3.92 -1.51 -17.6 <0.001 9. Introducing suitable references to students for reading 3.38 4.08 -0.70 -9.80 <0.001 10. Declaring hours that students can refer to faculties to talk about educational problems 2.70 3.73 -1.03 -12.6 <0.001
Empathy
11. Assigning suitable and relevant homework 3.10 3.64 -0.54 -7.10 <0.001 12. Faculty members flexibility when exposing to specific conditions of each student 2.77 4.04 -1.27 -15.1 <0.001
13 Convenience of class hours 2.99 4.06 -1.07 -12.8 <0.001
14. Existence of silent and convenient place in school for reading 2.98 4.03 -1.05 -12.7 <0.001 15. Respectful treatment of school staff with students 3.03 4.04 -1.00 -11.7 <0.001 16. Respectful treatment of faculty members with students 3.56 4.35 -0.79 -12.3 <0.001
Reliability
17. Presenting educational content regularly and relevant 3.43 4.16 -0.72 -10.6 <0.001 18. Informing students concerning the result of examinations 3.07 3.79 -0.72 -9.60 <0.001 19. Presenting materials and content understandably 3.26 4.28 -1.01 -15.2 <0.001 20. Gaining higher scores if students attempt more 3.43 4.05 -0.61 -7.90 <0.001 21. Recording students' educational documents without mistake 3.54 3.98 -0.43 -6.10 <0.001 22. Easy accessibility of available references in university 3.45 4.23 -0.78 -11.1 <0.001 23. Fulfilling responsibilities by faculty members and staff in the promised time 3.39 4.05 -0.66 -9.60 <0.001
Tangibles
24. Neat ant professional appearance of faculty members and staff 3.51 3.86 -0.35 -4.70 <0.001 25. Visual appealing and comfort of physical facilities 2.40 3.93 -1.53 -17.8 <0.001 26. Material and educational equipment being up to date 3.33 4.10 -0.77 -10.5 <0.001 27. Visual appealing of teaching tools 3.15 3.86 -0.71 -9.40 <0.001
be informed of it. Also the administrators should plan working hours of faculty members so that they have enough time for counseling, faculty members should be accessible outside of class to answer students' questions, students should have easy access to the administrator to express their viewpoints and suggestions concerning the curriculum and educational problems, and finally stu-dents' viewpoints and suggestions should be considered in curriculum.
In this study there was no significant difference between students' perceptions in Associated degree level, Bachelor of Science (BS) level, and general medicine level, but there was a significant difference between expectations of them. In general, medical students have greater expectations from educational services quality. Also, the negative qual-ity gap in the general medicine level is greater than other educational levels. Thus, in order to reduce the negative quality gap in this level, more attention should be paid to the students' expectations.
Conclusion
The negative quality gap in service dimensions can be used as a guideline for planning and allocation of
resources [20]. Thus, the five SERVQUAL dimensions can be classified to three priority groups for allocation of resources and organizational attempts to eliminate or reduce negative quality gaps, so that the responsiveness dimension is placed in the first priority, the assurance, empathy and tangibles dimensions are placed in the sec-ond priority, and the reliability dimension is placed in the third priority. If the afore mentioned priorities are taken into account and the quality gap is attended to, the result-ant improved will benefit other dimensions as well; the negative quality gap (or quality improvements) in one dimension, in the customers' viewpoint, can affect the negative quality gaps (or quality improvements) in other dimensions [21].
Due to the diversity of courses and educational levels in other universities and having different facilities, equip-ment, staff and faculty members, the results of this study are not generalizable to all. Hence it is recommended that every university carry out a similar study so that a model with more conformity will be produced for planning to improve educational services quality.
Table 3: Comparison of the students' perceptions, expectations and service gaps in different educational levels
Service Dimensions Educational Level Perception Expectation Service gaps
Assurance Associate degree 3.31 4.06 -0.74
Bachelor of Science 3.16 4.01 -0.85
General medicine 3.17 4.40 -1.23
ANOVA* p** = 0.15 p < 0.004 p < 0.001
Responsiveness Associate degree 2.80 3.80 -0.99
Bachelor of Science 2.84 3.90 -1.06
General medicine 2.68 4.20 -1.52
ANOVA p = 0.35 p < 0.005 p < 0.001
Empathy Associate degree 3.13 3.90 -0.76
Bachelor of Science 2.97 3.95 -0.98
General medicine 3.06 4.36 -1.30
ANOVA p = 0.24 p < 0.001 p < 0.001
Reliability Associate degree 3.44 3.95 -0.51
Bachelor of Science 3.31 4.06 -0.75
General medicine 3.28 4.35 -1.07
ANOVA p = 0.12 p < 0.002 p < 0.001
Tangibles Associate degree 3.16 3.81 -0.64
Bachelor of Science 2.98 3.92 -0.94
General medicine 3.10 4.23 -1.13
ANOVA p = 0.26 p < 0.005 p < 0.003
Total service quality Associate degree 3.19 3.91 -0.72
Bachelor of Science 3.07 3.98 -0.90
General medicine 3.08 4.32 -1.24
ANOVA p = 0.17 p < 0.001 p < 0.001
Publish with BioMed Central and every scientist can read your work free of charge "BioMed Central will be the most significant development for disseminating the results of biomedical researc h in our lifetime."
Sir Paul Nurse, Cancer Research UK
Your research papers will be:
available free of charge to the entire biomedical community
peer reviewed and published immediately upon acceptance
cited in PubMed and archived on PubMed Central
yours — you keep the copyright
Submit your manuscript here:
http://www.biomedcentral.com/info/publishing_adv.asp
BioMedcentral
Competing interests
The authors declare that they have no competing interests.
Authors' contributions
TA designed and conducted the study, drafted and edited the manuscript. SZ designed the methodology and ana-lyzed the data.
Acknowledgements
The authors would like to thank the Research Deputy of the Hormozgan University of Medical Sciences for providing financial support for this project.
References
1. Anci DT: How satisfied are our students? Quality management unit. Office for institutional effectiveness university of Johannesburg, Johan-nesburg, South Africa 2006.
2. Tam M: Measuring Quality and Performance in Higher Educa-tion. Quality in higher Education 2001, 7(1):47-54.
3. Feldman KA: Class size and students' evaluation of college teachers and courses: A closer look. Research in Higher Education
1984, 21:45-116.
4. Ramsden PA: A Performance Indicator of Teaching Quality in Higher Education: The course Experience Questionnaire.
Studies in Higher Education 1991, 16:129-150.
5. Marsh HW, Roche L: The use of students' Evaluations and an Individually Structured Intervention to Enhance University Teaching Effectiveness. American Educational Research Journal
1993, 30:217-251.
6. Bolton RN, Drew JH: A Multistage Model of Customers' assess-ments of service quality and value. Journal of consumer research
1991:375-384.
7. Glow KE, Vorhies DW: Building a competitive advantage for service firms. Journal of services marketing 1993, 7(1):22-32. 8. Boulding W, Kalra A, Staelin R, Zeithmal VA: A dynamic process
model of service quality: From expectations to behavioral intentions. Journal of Marketing Research 1993, 30(1):7-27. 9. Adee A, Bernie OD: Exploring graduates' perceptions of the
quality of higher education. 2007 [http://www.aair.org.au/jir/ May94/Athiyaman.pdf].
10. Parasurman A, Zeithmal VA, Berry : SERVQUAL: A multiple-Item scale for measuring consumer perceptions of services quality. Journal of Retailing 1988, 64(1):12-20.
11. Berry LL: Relationship marketing of services-Growing inter-est, emerging perspectives. Journal of the Academy of Marketing sciences 1995, 26:767-86.
12. Long P, Tricker T, Rangecroft M, Gilroy P: Measuring the Satisfac-tion gap: EducaSatisfac-tion in the market place. Total quality manage-ment 1999, 10(4, 5):772-778.
13. Sander P, Stevenson K, King M, Coates D: University students' expectations of teaching. Studies in Higher Education 2000, 25(2):309-323.
14. LaBay DG, Comm CL: A case study using gap analysis to assess distance learning versus traditional course delivery. The Inter-national Journal of Education Management 2003, 17(6, 7):312-317. 15. Kebriaei A, Roudbari M: Quality gap in educational services at
Zahedan university of medical sciences: students viewpoints about current and optimal condition. Iranian Journal of Medical Education 2005, 5(1):53-60.
16. Bradley RB: Analyzing service quality: The case of post-gradu-ate Chinese students. 2007 [http://lubswww.leeds.ac.uk/research Progs/fileadmin/user_upload/documents/Barnes.pdf].
17. Chua Clare: Perception of Quality in Higher Education. AUQA Occasional Publication. 2007 [http://www.auqa.edu.au/ auqf/2004/program/papers/Chua].
18. Carl AR: Assessing Satisfaction with Selected Student Serv-ices using SERVQUAL, a Market-Driven Model of Service Quality. NASPA Journal 1998, 35(4):331-341.
19. Millson F, Kirk-Smith M: The Effect of quality circles on per-ceived service quality in financial services Marketing Prac-tice. Applied Marketing Science 1996, 2(4):75-88.
20. Campbell JL, Ramsay J, Green J: Age, gender, socioeconomic and ethnic differences in patients' assessments of primary health care. Quality in Health Care 2001, 10:90-95.
21. Lamei A: Total Quality management in health care. Ministry of Health and Education of Iran, Quality Improvement Unit; 2000.
Pre-publication history
The pre-publication history for this paper can be accessed here: