R E S E A R C H P A P E R
Evaluation of multiple variate selection methods from a biological
perspective: a nutrigenomics case study
Henri S. Tapp•Marijana Radonjic• E. Kate Kemsley•Uwe Thissen
Received: 13 October 2011 / Accepted: 8 February 2012 / Published online: 2 March 2012 The Author(s) 2012. This article is published with open access at Springerlink.com
Abstract Genomics-based technologies produce large amounts of data. To interpret the results and identify the most important variates related to phenotypes of interest, various multivariate regression and variate selection meth-ods are used. Although inspected for statistical perfor-mance, the relevance of multivariate models in interpreting biological data sets often remains elusive. We compare various multivariate regression and variate selection meth-ods applied to a nutrigenomics data set in terms of perfor-mance, utility and biological interpretability. The studied data set comprised hepatic transcriptome (10,072 predictor variates) and plasma protein concentrations [2 dependent variates: Leptin (LEP) and Tissue inhibitor of metallopro-teinase 1 (TIMP-1)] collected during a high-fat diet study in
ApoE3Leiden mice. The multivariate regression methods used were: partial least squares ‘‘PLS’’; a genetic algorithm-based multiple linear regression, ‘‘GA-MLR’’; two least-angle shrinkage methods, ‘‘LASSO’’ and ‘‘ELASTIC NET’’; and a variant of PLS that uses covariance-based variate selection, ‘‘CovProc.’’ Two methods of ranking the genes for Gene Set Enrichment Analysis (GSEA) were also investigated: either by their correlation with the protein data or by the stability of the PLS regression coefficients. The regression methods performed similarly, with CovProc and GA performing the best and worst, respectively (R-squared values based on ‘‘double cross-validation’’ predictions of 0.762 and 0.451 for LEP; and 0.701 and 0.482 for TIMP-1). CovProc, LASSO and ELASTIC NET all produced parsimonious regression models and consis-tently identified small subsets of variates, with high com-monality between the methods. Comparison of the gene ranking approaches found a high degree of agreement, with PLS-based ranking finding fewer significant gene sets. We recommend the use of CovProc for variate selection, in tandem with univariate methods, and the use of correlation-based ranking for GSEA-like pathway analysis methods. Keywords Multivariate statistical analysis
NutrigenomicsMicroarrays Pathway analysis High-fat diet
Introduction
In many life science studies, large data sets are gener-ated from metabolomics, proteomics and transcriptomics experiments. Measurement of numerous relevant metabo-lites, proteins and genes in a single experiment allows an almost unbiased investigation into the important potential Henri S. Tapp and Marijana Radonjic contributed equally to this
work.
Electronic supplementary material The online version of this article (doi:10.1007/s12263-012-0288-4) contains supplementary material, which is available to authorized users.
H. S. TappE. Kate Kemsley
Institute of Food Research, Norwich Research Park, Colney Lane, Norwich NR4 7UA, UK
M. Radonjic (&)
TNO, Microbiology and Systems Biology, P.O. Box 360, 3700 AJ Zeist, The Netherlands
e-mail: [email protected]
M. RadonjicU. Thissen
Nutrigenomics Consortium, Top Institute Food and Nutrition, P.O. Box 557, 6700 AN Wageningen, The Netherlands
Present Address: U. Thissen
Keygene N.V., P.O. Box 216, 6700 AE Wageningen, The Netherlands
biomarkers or crucial pathways associated with the original study goal. Interpreting the results, however, requires dedicated techniques that can select or rank variates from large amounts of data. Usually, statistical models are generated that describe the relationship between the genomics data and some feature of interest (e.g., a phe-notype). The models are then further analyzed to identify the most important variates.
Many variate selection methods are described in the literature. These can differ in their implementation details or in their fundamental statistical principles (Guyon and Elisseeff 2003; Guyon et al. 2006). An ideal variate selection method has principles and parameters that are well-suited to the particular study goal and/or to the data characteristics, although it is not always straightforward to make these choices in advance. Furthermore, even though the statistical principles of a method may be understood, its utility from a biological perspective is often less obvious. This paper describes the performance of a number of variate selection or ranking techniques, from both a sta-tistical and biological perspective. Representative of quite dissimilar approaches, the statistical methods used are:
• Partial least squares (PLS) regression (Martens and Naes1989)—a latent vector (LV) approach;
• Genetic algorithm (GA) (Mitchelle 1998)—a global optimization approach, combined with multiple linear regression (MLR);
• LASSO (Tibshirani 1996) and ELASTIC NET (Zou and Hastie2005)—least-angle shrinkage approaches;
• Covariance procedure (CovProc)—a PLS variant that uses variate selection based on covariance (Reinikainen and Ho¨skuldsson2003).
In broad terms, these all involve multivariate regression modeling of some kind and the estimation of a few ‘‘meta parameters’’ to summarize the model complexity. We have additionally made comparisons with univariate regression models built from individual genes and the reference pro-tein data.
The methods were applied to quantitative protein mea-surements and microarray gene expression data obtained from a nutrigenomics case study described in Radonjic et al. (2009). Nutrigenomics investigates molecular rela-tionships between dietary components and genes, proteins and/or metabolites on a large scale. It addresses the ques-tion of how nutriques-tion influences gene transcripques-tion, protein expression and/or metabolism, with the aim of under-standing how dietary factors can affect an individual’s health on a systems level (Mu¨ller and Kersten2003; Afman and Mu¨ller 2006; Baccini et al. 2008; Kaput et al. 2010; Evelo et al. 2011). The data used in the present work originate from a large-scale nutritional intervention survey performed in Apolipoprotein E3-Leiden (ApoE3Leiden)
transgenic mice (Radonjic et al.2009). The study examined the time-resolved development of high-fat-induced obesity and related pathologies and used microarrays to obtain genome-wide hepatic gene expression data. These have been used as the predictors in the variate selection meth-ods. We have focused on this single data set to allow a detailed evaluation of the biological relevance of the genes and gene sets selected by the statistical approaches used in this study. Two dependent variates have been considered: plasma concentrations of the proteins Leptin (LEP) and Tissue inhibitor of metalloproteinase 1 (TIMP-1). They were chosen for their relevance to obesity development and inflammation-related tissue remodeling upon high-fat feeding, respectively.
Materials and methods
Study design, tissue collection and analysis
A detailed description of the study characteristics including study design, sample preparation, RNA isolation and quality control is described by Radonjic et al. (2009). This section only describes the parts that are relevant for understanding the present work.
The study involved a longitudinal comparison of hepatic gene expression between animals fed a control diet and those fed diets high in either animal or vegetable fat. The mRNA expression levels were determined using NuGO Affymetrix Mouse GeneChip arrays (NuGO_Mm1a 520177) and hepatic RNA material from groups of animals from each diet immolated at eight time points (0 days (chow fed), 1 day, 3 days, 1, 2, 4, 8, 12 and 16 weeks) during a 16-week trial. In total, 116 microarray samples were taken for further analysis, comprising 3–6 biological replicates per diet, per time-point. After applying data preprocessing pipeline, hepatic gene expression values were obtained for 15,105 genes with unique identifiers and 73 Affymetrix controls. From a total of 15,178 features, 10,072 were selected based upon the following two criteria: first, for at least one of the diet-time categories, there were two or more absolute expression values greater than a threshold value of 5 units. Second, the maximum-to-min-imum expression ratio was[1.5, equivalent to a difference of 0.585 in log2transformed data. Such expression data set has been used as the predictors in the variate selection methods.
assessing the performance of the variate selection methods evaluated in the current study.
In total, 88 ApoE3Leiden liver and plasma samples were selected from the original study, on the basis of animal-matching data availability for both hepatic transcriptomics and protein measurements for assessing the performance of variate selection methods in the current study. The size of the gene expression matrix analyzed in this study was, therefore, of dimensions [88910,072]. The matching 88 animals included 31 mice fed chow diet, 33 mice fed animal fat diet and 24 mice fed plant fat diet.
Regression analysis
Multivariate modeling and univariate correlation analysis were performed using Matlab (Mathworks Inc.). The Matlab modeling routines are available on request. The transcriptomics data were log2 transformed before analy-sis, which is a standard step prior to statistical analysis (Van den Berg2006). All the regression methods used unit variance scaling. Models were assessed by cross-validation using 10 blocks. Single cross-validation (SCV) was used to determine the final model’s meta-parameters, and double cross-validation (DCV) (Smit et al. 2007; Stone 1974) was used to assess predictive performance and model consistency.
Partial Least Squares (PLS) Partial least squares is a well-known supervised multivariate latent vector modeling technique (Boulesteix and Strimmer 2007; Martens and Naes 1989). It is not a variate selection method. The number of PLS factors that minimized a modified form of the Amemiya Prediction Criterion, APC, (Norusˇis and SPSS Inc 1990) was considered to be the optimal meta-parameter: APC(a)=[(n?a)/(n-a)][1-(rscv)
2 ], where
n is the number of observations, a is the number of PLS factors used in the model, andrscvis the Pearson correla-tion between the actual values and single cross-validated predictions. The stability of the regression coefficient was calculated by dividing the final SCV coefficients by a jackknife estimate of their standard error, calculated from both DCV and SCV results, as described by Faber (2002). This was used as a basis for ranking the genes for use in conjunction with Gene Set Enrichment Analysis (see below).
Genetic Algorithm (GA) Genetic algorithm in combi-nation with multiple linear regression (MLR) was imple-mented according to Kemsley et al. (2007) and McLeod et al. (2009). The GA is a global optimization variate selection method that builds MLR models based on the best subset of variates. The closest analogue to a meta-param-eter is the number of variates used in the final model. GA regression was implemented using an in-house scheme developed at the Institute of Food Research. The GA is a
global optimization variate selection method that builds multiple linear regression models based on small subsets of variates. The GA aims to optimize both the model size (number of variates) as well as identifying the best subset. The minimum model size considered was 2 variates, and the maximum size was 69 and 78 for double cross-vali-dation, DCV, and single cross-valicross-vali-dation, SCV, respec-tively. Population sizes of 340 and 308 models were used for the DCV and SCV, respectively. The model fitness criterion used was the mean squared residuals based on block cross-validation. The cross-validation partitions were permuted after each generation. The most successful (fit-test) model automatically passed to the next generation. All models in the current population could potentially act as parents although the breading probability was weighted toward the fitter models. The algorithm halts if either of two criteria is met: 30 generations without a change in the fittest model, or if a maximum of *200 generations has passed. The size of the offspring model is chosen as a randomly assigned number that spans the size range of the parents, with a finite possibility of this value reducing by one. There are three mutation mechanisms: in neighbor and correlation-based annealing, there are finite probabilities of one variate swapping with either an adjacent variate or with one of its five most correlated alternatives. The third mechanism is the possibility of replacing or including a new variate chosen from either the list of all possible variates or from those present in the current population. Duplicate progeny is replaced with immigrants with the same number of variates as the current best model.
Least absolute shrinkage and selection operator (LASSO) (Tibshirani 1996) finds regression coefficients that minimize the squared residuals while also being con-strained such that the sum of the absolute coefficient values is less than a given value, t, which is the meta-parameter. The L1 constraint causes many of the regression coeffi-cients to be set to zero, which makes LASSO a variate selection method. No upper limit was set to the number of variates used in candidate models and the optimum model chosen is that which minimized the Aikake Information Criteria, AIC (Norusˇis and SPSS Inc1990).
Elastic Net is an extension to LASSO that uses an additional L2 ‘‘ridge-regression’’ constraint, k2, which is the second meta-parameter to be estimated (Zou and Hastie 2005). This overcomes two limitations of LASSO: (1) the number of selected variates in the model is restricted by the data sample size, and (2) only one variate is selected from a group of highly correlated ones. Candidate models were limited to a maximum of 200 variates.
variance scaled data, this corresponds to introducing vari-ates based on the strength of correlation with the dependant variate. Regression models were evaluated that used increasing numbers of variates, introduced in five-variate increments, based on the order of the ranked list. The values of the two model meta-parameters (number of variates, number of PLS factors) chosen in the final model corresponded to the combination that resulted in the overall minimum APC.
Biological interpretation of variate selection results Ingenuity Pathway Analysis suite (IPA, Ingenuity Sys-tems. http://www.ingenuity.com, version date May 2009) was used to analyze biological functions of the genes in the final models of CovProc, LASSO, ELASTIC NET and GA, by employing ‘‘Overrepresentation analysis’’ module. Biological function overrepresentation analysis aims to gain a mechanistic insight into the underlying biology of a selected group of genes. It evaluates whether gene sets associated with particular biological functions—such as those represented by Gene Ontology (GO) annotations— are statistically overrepresented in the identified gene group (for example, list of differentially expressed genes or group of genes selected by multivariate models). In this study, Fisher’s exact testp values were used to score the significance of biological functions among the genes in the final models of the four appraised variate selection approaches.
Gene Set Enrichment Analysis (GSEA, Subramanian et al.2005) was used to evaluate the biological relevance of ranking the genes based on two approaches: by their correlationrwith the protein data and by the stability of the PLS regression coefficients. The ranked gene lists were supplied as inputs into the PreRanked scoring procedure available within the GSEA software. In GSEA, a score is produced, similar to the Kolmogorov–Smirnov statistic, which summarizes the distribution of a predefined set of genes within a prioritized list of genes. Higher scores are given to gene sets that are distributed near the top or bottom of the list. The likelihood of achieving a given score is evaluated by recalculating the score after repeated random permutations of the list order. When multiple gene sets are evaluated, the permutation-basedpvalues are used to control the false discovery rate (FDR). Our analysis used gene sets from Molecular signature database (MSigDB) C2 curated gene sets collection (http://www.broad.mit.edu/ gsea/msigdb September 2008). A gene set size filter (min=15, max =500) removed 737 of the 1,687 gene sets, leaving 950 to be used in the analysis. After collapsing 10,072 native features (gene identifiers from the gene expression data set) into gene symbols, 9,985 genes were recognized and used for the analysis. The number of
permutations was set to 1,000. The permutations are used to assignpvalues to the GSEA scores calculated for each gene set. This avoids assuming the scores belong to some underlying distribution. As we evaluated 950 gene sets, the permutation-basedpvalues are also used to control the false discovery rate, FDR (e.g., Benjamini and Hochberg1995). The significantly enriched gene sets referred to in the ‘‘Results and discussion’’ section are those that passed Benjamini and Hochberg FDR threshold: gene sets are considered significantly enriched at false discovery rate (FDR) smaller than 1% (qvalueB0.01).
The MSigDB service was used to find significant (p B0.01) overlaps between CovProc selected genes and gene sets in the collection.
Results and discussion
Hepatic genome-wide gene expression levels and plasma protein levels in high-fat diet fed ApoE3Leiden mice were analyzed using five multivariate regression methods: CovProc, LASSO, ELASTIC NET, GA and PLS (‘‘ Mate-rials and methods’’). The multivariate models were used to prioritize genes that predict the expression of two proteins associated with obesity phenotypes upon high-fat feeding, namely Leptin (LEP) and Tissue inhibitor of metallopro-teinase 1 (TIMP-1). This allows elucidation of hepatic molecular mechanisms and the identification of biomarkers associated with deregulated adiposity and tissue remodel-ing, respectively, observed upon administration of high-fat diets.
Performance of five multivariate regression methods: model performance
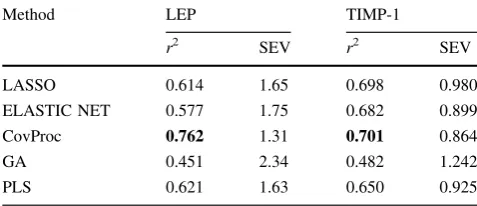
The results of the double cross-validation (DCV) prediction comparison are shown in Table 1. For both proteins stud-ied, CovProc and GA produced the best and worst
Table 1 Performance of five multivariate regression methods for the prediction of LEP and TIMP-1: predictions using double cross-validation
Method LEP TIMP-1
r2 SEV r2 SEV
LASSO 0.614 1.65 0.698 0.980
ELASTIC NET 0.577 1.75 0.682 0.899
CovProc 0.762 1.31 0.701 0.864
GA 0.451 2.34 0.482 1.242
PLS 0.621 1.63 0.650 0.925
Bold values indicate the best performance
predictions, respectively, CovProc only slightly exceeding LASSO, and all the variate selection methods performing comparably to PLS. These results can be put into context by considering the correlationrbetween individual genes and the protein data. We find that the numbers of signifi-cantly (p(r)B0.05/10,072) correlated genes were 208 (2.1% of all genes) and 486 (4.8%) for LEP and TIMP-1, respectively. Single gene regression models were evaluated using single cross-validation (SCV) to allow direct com-parison with the results in Table1. For LEP and TIMP-1, respectively, 18 and 40 genes had an individual predictive ability greater than that obtained by GA; and for TIMP-1, one gene (Serpina3n) performed even better than CovProc. This is perhaps a surprising finding, as the widespread use of multivariate analysis (MVA) methods in traditional applications involving high-dimensional data, such as spectroscopy, is due to the improved predictive ability they offer through the ‘‘multivariate advantage,’’ which deals with confounding systematic variation in the predictor data. Our findings imply that—for transcriptomic data, at least— univariate methods should also be investigated.
Note that all the variate selection methods could potentially have selected a single variate, and in the case of TIMP-1, this would have led to an improved predictive performance. That all the MVA methods instead selected multiple variates can be interpreted as evidence of over-fitting during the model optimization procedure.
The estimated values of the meta-parameters and SCV performance during the 10 rounds of DCV and for the SCV on the whole data set are provided in Online Resource 1. Comparison of subset selection methods
from a statistical perspective
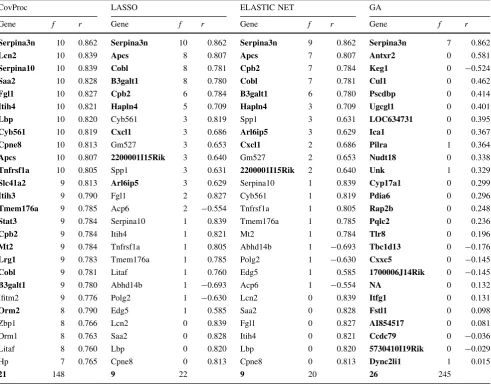
The genes selected by CovProc, LASSO, ELASTIC NET and GA for LEP and TIMP-1 are summarized in Tables2 and3, respectively. Genes present in the final SCV models are emboldened. Also shown is the number of occurrences of each gene during the rounds of DCV and the correlation with each protein. The annotations of these genes can be found in Online Resource 2.
CovProc As the predictor data were unit variance scaled, genes are introduced by CovProc based on the magnitude of their correlation with the protein. The final models for LEP and TIMP-1 used the first 16 and 21 most correlated genes, respectively. Note that in both cases, all the selected genes had positive values of r (i.e., positive correlation). For LEP, all the genes in the SCV model were selected at least 9 times during DCV. For TIMP-1,Orm2
was the only gene selected in the SCV model not selected at least 9 times during DCV. Similarly,lfitm2was the only gene selected at least 9 times during DCV not to be included in the SCV model. As these are only slight
differences, we can conclude that both final models were stable.
LASSO/ELASTIC NET Tables2 and 3 show that for both proteins, there was considerable consistency between these methods. Both methods used the same genes in their SCV models. The total numbers of genes selected at least once during DCV were also similar, as were the individual genes: there were 21 common genes selected for LEP and 19 for TIMP-1. This can be attributed to the ELASTIC NET models tending toward relatively small values for the ridge parameter and, therefore, behaving similarly to LASSO (see Online Resource 1). For both proteins, all the genes used in the SCV model had significant values of
r. There was also agreement in the genes selected by these methods and by CovProc. For LEP, all 8 genes were also present in the 16 gene model selected by CovProc. For TIMP-1, there were 5 genes common to the models by LASSO/ELASTIC NET (9 genes) and CovProc (21 genes) models. This agreement indicates that LASSO and ELASTIC NET preferentially selected genes with high absolute values of r. The four genes not present in the TIMP-1 CovProc model were ones less frequently selected during DCV.
GA Models selected by the GA showed the least sta-bility—many genes were selected with a frequency, f, of just 1. In the interests of conciseness, therefore, the results in Tables2and3comprise genes selected in the final SCV model ordered by the magnitude of the correlation to each protein. For LEP, Mogat1 was the most selected during DCV (5 occurrences). For TIMP-1,Serpina3nwas selected in 7 of the DCV models. This was the most correlated gene and was also selected by the other variate selection meth-ods. Of the genes present in the final SCV model, only 7 and 3 were significantly correlated with LEP and TIMP-1, respectively. A total of 281 and 245 genes were selected at least once during DCV for LEP and TIMP-1, respectively, indicating a lack of consistency in the GA models. Two possible contributing factors for this lack of consistency are first, the large model space—10,072 variates—and thus great potential for converging on local minima; and sec-ond, that MLR lacks any mechanism for rejecting noise. Evaluation of variate selection methods
from a biological perspective
Overrepresentation of biological functions for CovProc, LASSO, ELASTIC NET and GA selected genes
The biological relevance of the genes selected by the CovProc, LASSO/ELASTIC NET and GA was assessed using biological function overrepresentation analysis within the Ingenuity Pathway Analysis suite. The results are provided in the Online Resource 3. Based on the
pvalue of the biological function category, CovProc per-formed best with lowestpvalues of 2.43E-06 and 2.33E-07 for LEP and TIMP-1, respectively. LASSO and ELASTIC NET performed similarly with the lowest
pvalue of 5.05E-04 for LEP and 1.44E-05 for TIMP-1. GA performed least well, with a lowestpvalue of 1.30E-03 for LEP and 1.15E-1.30E-03 for TIMP-1. These results are in
broad agreement with the regression-based evaluation of these methods.
Gene Set Enrichment Analysis ofr- and PLS-ranked gene lists
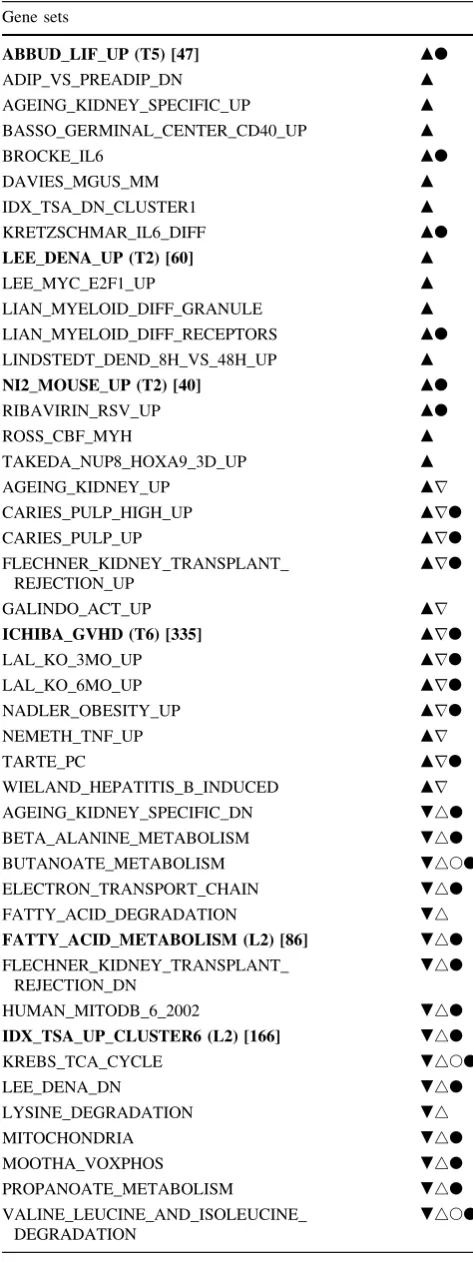
GSEA of LEP found 40 (22 positively and 18 negatively) significantly enriched gene sets using correlation r-based ranking, and 3 (3 positively and 0 negatively) using PLS regression vector stability ranking. For TIMP-1, GSEA found 51 (29 positively and 22 negatively) and 33 (16 positively and 17 negatively) enriched gene sets using the
r- and PLS-ranked lists, respectively.
Investigation into the overlaps between gene sets iden-tified by the two ranking approaches found that all (LEP) or Table 2 The genes selected by CovProc, LASSO, ELASTIC NET and GA methods for LEP
CovProc LASSO ELASTIC NET GA
Gene f r Gene f r Gene f r Gene f r
Cfd 10 0.829 G0s2 10 0.826 G0s2 10 0.826 G0s2 2 0.826
G0s2 10 0.826 Cfd 9 0.829 Cfd 9 0.829 Mogat1 5 0.816
Mogat1 10 0.816 Mogat1 9 0.816 Mogat1 9 0.816 D630002G06Rik 2 0.669
Omd 10 0.799 Cidec 9 0.770 Cidec 8 0.770 Elovl5 0 0.604
Cidea 10 0.797 Mme 8 0.686 Mme 8 0.686 Gstz1 0 0.582
Clstn3 10 0.797 Gpr98 7 0.755 Gpr98 7 0.755 Apoa4 0 0.565
Aldh3a2 10 0.784 Scd1 7 0.740 Scd1 7 0.740 Perp 0 0.484
Cidec 10 0.770 Gstk1 5 0.755 Gstk1 5 0.755 Bloc1s1 0 0.266
Gpr98 10 0.755 Fabp2 4 0.683 Fabp2 4 0.683 2700050L05Rik 0 -0.246
Gstk1 9 0.755 D630002G06Rik 4 0.669 D630002G06Rik 4 0.669 Ubxd1 0 -0.242
Inhbe 9 0.751 Omd 3 0.799 Omd 3 0.799 Ascc3l1 0 -0.222
Tnfrsf19 9 0.744 Pgrmc2 3 0.644 3110032G18Rik 3 0.725 Eif2a 0 -0.213
Scd1 9 0.740 3110032G18Rik 2 0.725 Pgrmc2 3 0.644 Lrrc8d 0 0.212
Gpc1 9 0.733 Cidea 1 0.797 Cd36 2 0.727 Pir 0 -0.197
Cd36 9 0.727 Clstn3 1 0.797 Clstn3 1 0.797 D2hgdh 0 0.175
3110032G18Rik 9 0.725 Gpc1 1 0.733 Aldh3a2 1 0.784 9430028L06Rik 0 0.142
S3-12 4 0.705 Cd36 1 0.727 Gpc1 1 0.733 Myh9 0 -0.121
Apom 4 -0.696 EG624219 1 0.593 EG624219 1 0.593 Zbtb43 0 0.116
1110028A07Rik 3 0.702 Hectd2 1 0.567 Hectd2 1 0.567 0610037D15Rik 1 -0.102
Aqp8 3 0.699 Nnt 1 0.531 Apoa4 1 0.565 Thnsl2 0 -0.096
Gbe1 3 0.691 Abcg5 1 0.521 Nnt 1 0.531 Pitpnm2 0 -0.085
Mme 3 0.686 Apoc2 1 0.456 Abcg5 1 0.521 Nt5e 0 0.066
Sema5b 3 0.679 Aldh3a2 0 0.784 Apoc2 1 0.456 Il13ra1 0 -0.059
D630002G06Rik 3 0.669 Inhbe 0 0.751 Cidea 0 0.797 Bag2 0 -0.050
Cyp2b9 3 0.659 Tnfrsf19 0 0.744 Inhbe 0 0.751 Pik3r4 0 0.046
Fabp2 2 0.683 S3-12 0 0.705 Tnfrsf19 0 0.744 Xrcc6 0 -0.040
Vnn1 2 0.679 1110028A07Rik 0 0.702 S3-12 0 0.705 Sec61a2 0 -0.012
Cryz 2 0.677 Aqp8 0 0.699 1110028A07Rik 0 0.702 Tbcc 0 -0.006
16 37 8 22 8 23 28 281
most (TIMP-1) of the gene sets identified using PLS ranking were also identified by ther-based approach. This was true for both positively and negatively enriched gene sets (Fig.1a, b). Only two positively enriched gene sets found using PLS ranking for TIMP-1 were not also found using ther-based approach.
Interestingly, many gene sets that were found positively enriched in the LEP GSEA results were also negatively enriched in the TIMP-1 results and vice versa (Table4). This is likely a consequence of the biological roles of these two proteins. TIMP-1 and LEP are associated with inflammation and fat metabolism, respectively, processes perturbed during hepatic response to a high-fat challenge. These responses are conversely timed: inflammation is evoked during the early phase (day 1 to week 2) and repressed during the late phase (week 4 to week 16) of the high-fat diet response, while lipid metabolic adaptations
show an opposite temporal pattern and are repressed during early and induced during the late phase of the high-fat feeding time-course (Radonjic et al. 2009). Given the Table 3 The genes selected by CovProc, LASSO, ELASTIC NET and GA methods for TIMP-1
CovProc LASSO ELASTIC NET GA
Gene f r Gene f r Gene f r Gene f r
Serpina3n 10 0.862 Serpina3n 10 0.862 Serpina3n 9 0.862 Serpina3n 7 0.862
Lcn2 10 0.839 Apcs 8 0.807 Apcs 7 0.807 Antxr2 0 0.581
Serpina10 10 0.839 Cobl 8 0.781 Cpb2 7 0.784 Keg1 0 -0.524
Saa2 10 0.828 B3galt1 8 0.780 Cobl 7 0.781 Cul1 0 0.462
Fgl1 10 0.827 Cpb2 6 0.784 B3galt1 6 0.780 Pscdbp 0 0.414
Itih4 10 0.821 Hapln4 5 0.709 Hapln4 3 0.709 Ugcgl1 0 0.401
Lbp 10 0.820 Cyb561 3 0.819 Spp1 3 0.631 LOC634731 0 0.395
Cyb561 10 0.819 Cxcl1 3 0.686 Arl6ip5 3 0.629 Ica1 0 0.367
Cpne8 10 0.813 Gm527 3 0.653 Cxcl1 2 0.686 Pilra 1 0.364
Apcs 10 0.807 2200001I15Rik 3 0.640 Gm527 2 0.653 Nudt18 0 0.338
Tnfrsf1a 10 0.805 Spp1 3 0.631 2200001I15Rik 2 0.640 Unk 1 0.329
Slc41a2 9 0.813 Arl6ip5 3 0.629 Serpina10 1 0.839 Cyp17a1 0 0.299
Itih3 9 0.790 Fgl1 2 0.827 Cyb561 1 0.819 Pdia6 0 0.296
Tmem176a 9 0.785 Acp6 2 -0.554 Tnfrsf1a 1 0.805 Rap2b 0 0.248
Stat3 9 0.784 Serpina10 1 0.839 Tmem176a 1 0.785 Pqlc2 0 0.236
Cpb2 9 0.784 Itih4 1 0.821 Mt2 1 0.784 Tlr8 0 0.196
Mt2 9 0.784 Tnfrsf1a 1 0.805 Abhd14b 1 -0.693 Tbc1d13 0 -0.176
Lrg1 9 0.783 Tmem176a 1 0.785 Polg2 1 -0.630 Cxxc5 0 -0.145
Cobl 9 0.781 Litaf 1 0.760 Edg5 1 0.585 1700006J14Rik 0 -0.145
B3galt1 9 0.780 Abhd14b 1 -0.693 Acp6 1 -0.554 NA 0 0.132
Ifitm2 9 0.776 Polg2 1 -0.630 Lcn2 0 0.839 Itfg1 0 0.131
Orm2 8 0.790 Edg5 1 0.585 Saa2 0 0.828 Fstl1 0 0.098
Zbp1 8 0.766 Lcn2 0 0.839 Fgl1 0 0.827 AI854517 0 0.081
Orm1 8 0.763 Saa2 0 0.828 Itih4 0 0.821 Ccdc79 0 -0.036
Litaf 8 0.760 Lbp 0 0.820 Lbp 0 0.820 5730410I19Rik 0 -0.029
Hp 7 0.765 Cpne8 0 0.813 Cpne8 0 0.813 Dync2li1 1 0.015
21 148 9 22 9 20 26 245
fNumber of occurrences in double cross-validation,rcorrelation coefficient of gene with TIMP-1 data. Genes present in the final single cross-validation model are in bold. The last row gives the number of genes in the final SCV model (bold) and the number selected at least once during DCV
15 14 2
0 17 5
PLS
19 3 0
0 0 18 b a
PLS
r r
LEP TIMP-1
inverse temporal expression of LEP and TIMP-1 under the experimental conditions used in this study (data not shown), it may be expected that gene sets that are posi-tively correlated with the expression of the one protein are negatively correlated with the expression of the other protein.
Relevance of biological analysis results in the context of LEP and TIMP-1 functions
Measurements of plasma protein concentrations of Leptin (LEP) and Tissue inhibitor of metalloproteinase 1 (TIMP-1) were considered as two dependent variates for the analysis in this study. These proteins were chosen due to their relevance in addressing the following research question: What are the processes underlying onset and progression of metabolic disorders (such as obesity) associated with high-fat feeding? The early hepatic effect of high-fat feeding involves induction of inflammatory and immune processes, while the late adaptation to excess dietary fat results in hepatic fat accumulation and development of hepatic steatosis (Radonjic et al. 2009). A statistically significant association between circulating plasma parameters and these hepatic physiological pro-cesses may be employed for the development of nonin-vasive diagnostics of the systemic disorder caused by high-fat feeding. To specifically target the representatives of inflammatory and adipogenic processes, we selected TIMP-1 and LEP plasma protein levels from the pool of plasma parameters that were assessed in the high-fat feeding study (Radonjic et al. 2009).
LEP is a circulating adipocytokine that regulates fat mass in response to nutritional status. It plays an important role in maintaining energy homeostasis and metabolic rate and its plasma levels are affected by energy-rich nutrients such as fatty acids, carbohydrates and proteins (Ahima and Flier 2000; Zou and Shao 2008). In agreement with the physiological role of LEP, the most significant functional category identified by the analysis of genes in the CovProc final SCV model is related to lipid metabolism (Online Resource 3). Also with high significance (p=4.75E-04), was the category ‘‘carbohydrate metabolism.’’ Lipid and carbohydrate metabolism were also represented in LASSO/ ELASTIC NET (p =3.03E-03) and GA results (p=1.30E-03 to 7.77E-03). Additionally, the GA model identified genes involved in metabolism of amino acids/ proteins. Consistent with the role of LEP, GSEA found significant positively enriched gene sets related to amino acid metabolism, fatty acid metabolism, energy yielding processes such as oxidative phosphorylation and tricar-boxylic acid (TCA) cycle, and conditions associated with increased adiposity (Table4). In the context of using subset selection methods (CovProc, LASSO/ELASTIC
NET and GA) to find markers associated with a given biological parameter, GOs2, Cfd and Mogat1 could be considered as the top three markers associated with LEP. They were selected by all the final models, and all have functions associated with lipid metabolism. Specifically, GOS2 regulates adipose lipolysis; CFD (adipsin) is involved in systemic lipid metabolism or energy balance; and MOGAT1 catalyzes the synthesis of precursors of physi-ologically important lipids such as triacylglycerol and phospholipids (Cook et al. 1987, Yen et al. 2003, Yang et al. 2010). Regarding the crucial role of LEP in energy homeostasis, lipid metabolism and liver pathophysiology, the specific processes mediated by GOS2, CFD and MOGAT1 may suggest the possible routes via which LEP accomplishes these functions.
matrix proteins during inflammatory response and/or other conditions.
Considering the functions of LEP and TIMP-1, we may conclude that all methods performed well in the identifi-cation of biologically relevant genes.
In summary, CovProc was the best performing MVA subset selection method. Similarly, for GSEA, ther-based ranking performed better than the ranking based on the stability of the PLS regression coefficients. In terms of biological relevance, the choice between these two meth-ods will depend on the research goal. While CovProc will be more suitable for selecting a limited set of markers associated with a given dependent parameter, GSEA using
r-based ranking may provide a more global insight into biological processes related to this parameter.
Direct comparison of CovProc selected variates with pathways prioritized by the ranking methods
To directly compare CovProc selected variates with path-ways prioritized by the ranking methods, the 16 and 21 genes used in the final SCV CovProc models for LEP and TIMP-1, respectively (bold in Tables2 and 3), were overlapped with the total C2 gene sets collection (1,892 Table 4 Enriched gene sets identified by GSEA using r-based
ranking
Gene sets
ABBUD_LIF_UP (T5) [47] md
ADIP_VS_PREADIP_DN m
AGEING_KIDNEY_SPECIFIC_UP m
BASSO_GERMINAL_CENTER_CD40_UP m
BROCKE_IL6 md
DAVIES_MGUS_MM m
IDX_TSA_DN_CLUSTER1 m
KRETZSCHMAR_IL6_DIFF md
LEE_DENA_UP (T2) [60] m
LEE_MYC_E2F1_UP m
LIAN_MYELOID_DIFF_GRANULE m
LIAN_MYELOID_DIFF_RECEPTORS md
LINDSTEDT_DEND_8H_VS_48H_UP m
NI2_MOUSE_UP (T2) [40] md
RIBAVIRIN_RSV_UP md
ROSS_CBF_MYH m
TAKEDA_NUP8_HOXA9_3D_UP m
AGEING_KIDNEY_UP mr
CARIES_PULP_HIGH_UP mrd
CARIES_PULP_UP mrd
FLECHNER_KIDNEY_TRANSPLANT_ REJECTION_UP
mrd
GALINDO_ACT_UP mr
ICHIBA_GVHD (T6) [335] mrd
LAL_KO_3MO_UP mrd
LAL_KO_6MO_UP mrd
NADLER_OBESITY_UP mrd
NEMETH_TNF_UP mr
TARTE_PC mrd
WIELAND_HEPATITIS_B_INDUCED mr
AGEING_KIDNEY_SPECIFIC_DN .4d
BETA_ALANINE_METABOLISM .4d
BUTANOATE_METABOLISM .4sd
ELECTRON_TRANSPORT_CHAIN .4d
FATTY_ACID_DEGRADATION .4
FATTY_ACID_METABOLISM (L2) [86] .4d
FLECHNER_KIDNEY_TRANSPLANT_ REJECTION_DN
.4d
HUMAN_MITODB_6_2002 .4d
IDX_TSA_UP_CLUSTER6 (L2) [166] .4d
KREBS_TCA_CYCLE .4sd
LEE_DENA_DN .4d
LYSINE_DEGRADATION .4
MITOCHONDRIA .4d
MOOTHA_VOXPHOS .4d
PROPANOATE_METABOLISM .4d
VALINE_LEUCINE_AND_ISOLEUCINE_ DEGRADATION
.4sd
Table 4 continued
Gene sets
BILE_ACID_BIOSYNTHESIS .
GLUTATHIONE_METABOLISM .d
HCC_SURVIVAL_GOOD_VS_POOR_UP .
IDX_TSA_UP_CLUSTER5 .d
TRYPTOPHAN_METABOLISM .d
WANG_MLL_CBP_VS_GMP_DN .
ADIP_VS_FIBRO_UP (L3) [35] 4
ADIP_VS_PREADIP_UP (L3) [36] 4
LEE_CIP_UP (L4) [62] 4
LEE_MYC_TGFA_DN 4
TNFALPHA_ADIP_DN (L2) [59] 4
ZMPSTE24_KO_DN (L2) [32] 4
IDX_TSA_DN_CLUSTER2 r
MYOD_NIH3T3_DN r
ROS_MOUSE_AORTA_DN r
STEMCELL_COMMON_DN r
TRANSLATION_FACTORS r
TRNA_SYNTHETASES r
gene sets including 17,544 genes). Using a p value threshold of 0.01, 15 gene sets were identified for LEP and 9 for TIMP-1.
Of the identified gene sets, 7 and 4 were also identified byr-ranked GSEA and 0 and 3 identified by PLS-ranked GSEA for LEP and TIMP-1, respectively (Table4). This shows that the biological interpretation of genes selected by CovProc corresponds well with the interpretation of the
r-ranked results. All the overlapping gene sets between
rand CovProc are found among positively enriched gene sets. This is consistent with CovProc selected genes that were exclusively positively correlated with LEP and TIMP-1.
Conclusions
This study has compared five methods currently used for variate selection or ranking: PLS, GA, LASSO/ELASTIC NET and CovProc. Based on statistical model performance and parsimony, the GA is outperformed by the other methods, with CovProc as the best method. From a bio-logical perspective, it appears that all methods select meaningful variates, either for variate subsets (CovProc, LASSO/ELASTIC NET) or for gene rankings (correlation and PLS coefficient stability), although CovProc somewhat outperforms the other methods for selecting a definite list of genes. We would also recommend that any multivariate analysis should be used in conjunction with more tradi-tional univariate analyses. The results of biological inter-pretation usingr-based rankings are superior to those using ranking by PLS coefficient stability.
In conclusion, based on the biological interpretability of the results, CovProc and correlation-ranked methods are both highly recommended, complementary methods for analyzing transcriptomic data. CovProc is particularly suited to select a limited set of markers associated with a given biological parameter, while correlation-ranked GSEA is more appropriate for gaining global insight into biological processes associated with that parameter. Acknowledgments Age Smilde (Universiteit van Amsterdam, The Netherlands) and Marjan van Erk (TNO, The Netherlands) are thanked for their discussions. This work has been performed with the help of a grant of The European Nutrigenomics Organisation linking genomics, nutrition and health research (NuGO). HST was funded by the Biotechnology & Biological Sciences Research Council under their Strategic Competitive Grant. MR and UT were funded by Top Institute Food and Nutrition, The Netherlands (Nutrigenomics Con-sortium, project A-006 (http://www.nutrigenomicsconsortium.nl).
Open Access This article is distributed under the terms of the Creative Commons Attribution License which permits any use, dis-tribution, and reproduction in any medium, provided the original author(s) and the source are credited.
References
Afman L, Mu¨ller M (2006) Nutrigenomics: from molecular nutrition to prevention of disease. J Am Diet Assoc 106:569–576 Ahima RS, Flier JS (2000) Adipose tissue as an endocrine organ.
Trends Endocrinol Metab 11:327–332
Baccini M et al (2008) The NuGO proof of principle study package: a collaborative research effort of the European Nutrigenomics Organisation. Genes Nutr 3:147–151
Benjamini Y, Hochberg Y (1995) Controlling the false discovery rate: a practical and powerful approach to multiple testing. J R Stat Soc Ser B 57(1):289–300
Boulesteix AL, Strimmer K (2007) Partial least squares: a versatile tool for the analysis of high-dimensional genomic data. Brief Bioinform 8:32–44
Cook KS et al (1987) Adipsin: a circulating serine protease homolog secreted by adipose tissue and sciatic nerve. Science 237:402– 405
Evelo CT et al (2011) Answering biological question—querying a systems biology database for nutrigenomics. Genes Nutr 6:81–87 Faber NM (2002) Uncertainty estimation for multivariate regression
coefficients. Chemom Intell Lab Syst 64:169–179
Gaudin P et al (2000) TIMP-1/MMP-9 imbalance in an EBV-immortalized B lym-phocyte cellular model: evidence for TIMP-1 multifunctional properties. Biochim Biophys Acta-Mol Cell Res 11:19–33
Guedez L et al (1996) The role of metalloproteinases and their inhibitors in hematological disorders. Crit Rev Oncog 7:205–225 Guyon I, Elisseeff A (2003) An introduction to variable and feature
selection. J Mach Learn Res 3:1157–1182
Guyon I, Gunn S, Nikravesh M, Zadeh L (eds) (2006) Feature extraction, foundations and applications. Series Studies in Fuzziness and Soft Computing. Physica-Verlag, Springer, Berlin Johnatty RN et al (1997) Cytokine and chemokine regulation of proMMP-9 and TIMP-1 production by human peripheral blood lymphocytes. J Immunol 158:2327–2333
Kaput J et al (2010) Connecting the Human Variome Project to nutrigenomics. Genes Nutr 5:275–283
Kemsley EK et al (2007) Multivariate techniques and their applica-tion in nutriapplica-tion: a metabolomics case study. Br J Nutr 98:1–14 Martens H, Naes T (1989) Multivariate calibration, 2nd edn. Wiley,
Chichester
McLeod G et al (2009) A comparison of variate pre-selection methods for use in partial least squares regression: a case study on NIR spectroscopy applied to monitoring beer fermentation. J Food Eng 90:300–307
Mitchelle M (1998) An Introduction to Genetic Algorithms. MIT Press, Cambridge, MA
Mu¨ller M, Kersten S (2003) Nutrigenomics: goals and perspectives. Nat Rev Genet 4:315–322
Norusˇis MJ, SPSS Inc (1990) SPSS base system user’s guide. SPSS, SPSS Inc, Chicago
Radonjic M et al (2009) Genome-wide mRNA expression analysis of hepatic adaptation to high-fat diets reveals switch from an inflammatory to steatotic transcriptional program. PLoS ONE 4:e6646
Ray JM, Stetler-Stevenson WG (1994) The role of matrix metallo-proteases and their inhibitors in tumour invasion, metastasis and angiogenesis. Eur Respir J 7:2062–2072
Smit S et al (2007) Assessing the statistical validity of proteomics based biomarkers. Anal Chim Acta 592:210–217
Stone M (1974) Cross-validatory choice and assessment of statistical predictions. J R Stat Soc B 36:111–147
Subramanian A et al (2005) Gene set enrichment analysis: a knowledge-based approach for interpreting genome-wide expression profiles. Proc Natl Acad Sci 102:15545–15550 The Gene Ontology Consortium (2000) Gene Ontology: tool for the
unification of biology. Nat Genet 25:25–29
Tibshirani R (1996) Regression shrinkage and selection via the lasso. J R Stat Soc B 58:267–288
Van den Berg RA (2006) Centering, scaling, and transformations: improving the biological information content of metabolomics data. BMC Genomics 7:142
Yang X et al (2010) The G0/G1 switch gene 2 regulates adipose lipolysis through association with adipose triglyceride lipase. Cell Metab 11:194–205
Yen CL et al (2003) MGAT2, a monoacylglycerol acyltransferase expressed in the small intestine. J Biol Chem 278:18532–18537 Zou H, Hastie T (2005) Regularisation and variable selection via the
elastic net. J R Stat Soc B 67:301–320