www.atmos-meas-tech.net/4/923/2011/ doi:10.5194/amt-4-923-2011
© Author(s) 2011. CC Attribution 3.0 License.
Measurement
Techniques
Tailored graphitized soot as reference material
for EC/OC measurement validation
O. Popovicheva1, D. Baumgardner2, R. Subramanian3, G. Kok3, R. Cary4, E. Vlasenko1, T. Khokhlova1, N. Shonija1, and E. Kireeva1
1Moscow State University, Moscow, 119991, Russia
2UNAM, Centro de Ciencias de la Atm´osfera, Mexico City, 04150, Mexico 3Droplet Measurement Technologies, Boulder, CO, 80301, USA
4Sunset Laboratories, Tigard, OR, 97223, USA
Received: 24 March 2010 – Published in Atmos. Meas. Tech. Discuss.: 15 April 2010 Revised: 7 October 2010 – Accepted: 3 May 2011 – Published: 20 May 2011
Abstract. The lack of standard reference materials for
cali-brating, troubleshooting and intercomparing techniques that measure the composition of black carbon, commonly re-ferred to as soot, has been a major obstacle that hinders im-proved understanding of how climate and health is impacted by this ubiquitous component of the atmosphere. A different approach is offered here as a means of constructing precisely controlled material with fractions of organic carbon (OC) on the surface of elemental carbon (EC) whose structure re-flects that of the combustion produced particles found in the atmosphere. The proposed soot reference material (SRM) uses EC as a basis substrate for surface coatings of organic compounds that are representative of the main classes of or-ganics identified in the coverage of soot produced by fos-sil fuel burning. A number of methods are used to demon-strate the quality and stability of the reference EC and SRM. Comparison of the nominal fraction of OC deposited on the EC substrate with the fraction measured with thermal/optical analysis (TOA) shows excellent agreement. Application of this type of reference material for evaluating the different methods of carbon analysis may help resolve differences that currently exist between comparable measurement techniques when trying to separate OC and EC from ambient samples.
Correspondence to: D. Baumgardner ([email protected])
1 Background
Soot, also commonly referred to as black carbon (BC) is a ubiquitous substance, produced by incomplete combustion of fossil fuels, that contains a variable mixture of organic car-bon (OC) and elemental carcar-bon (EC). It is a long-term geo-chemical sink of carbon that is found not only in soil and wa-ter but is one of the most important particulate species in the atmosphere as a tracer for anthropogenic activity. Soot alters climate on a global scale and health on a local scale. As re-cently highlighted by Ramanathan and Carmichael (2008), in regions with large anthropogenic emissions, soot is currently the second strongest contributor to global warming after car-bon dioxide. In urban areas soot particles are considered a dangerous pollutant with respect to human health and can cause or exacerbate respiratory, cardiovascular, and allergy-related diseases (Balbus et al., 2007).
In order to establish the accuracy and reliability of these different techniques, it is common practice to calibrate the sensors with a material having the well characterized prop-erties that are being measured by the instrument in question. These materials are referred to as reference standards and, in addition to providing a method for calibration, they are the means of ensuring that reasonable comparisons can be made among different measurements of the same quantity. There are a number of challenges, however, to finding appropriate soot reference materials (SRMs). In this paper we focus on SRMs specifically for use with instruments that measure the elemental and organic (EC/OC) components of soot.
The mass of OC and EC in ambient particulate matter is typically measured by the thermal/optical analysis (TOA) technique. A punch from a filter sample is heated to high temperatures, either in an oxidizing atmosphere (most ther-mal techniques) or first in an inert atmosphere, followed by an oxidizing atmosphere. When OC associated with soot is heated some fraction of it chars into an EC-like, light-absorbing, refractory substance. TOA methods monitor ei-ther light transmission through or reflection from the sample punch to correct for the charred OC (Chow et al., 1993; Birch and Cary, 1996).
The standard procedure for calibrating the TOA is to pre-pare preconditioned filters with known organic material, like sucrose or potassium hydrogen phthalate (KHP) whose num-ber of carbon molecules is precisely known. This provides an accurate procedure for relating the output of the analyzer of carbon dioxide or methane (depending on the TOA technique used) with the number of carbon molecules in the aerosol sample on the filter. This does not, however, test the fidelity of the technique for separating the EC from the OC since the carbon from these calibration materials contains no EC nor do they typically produce much charring.
Intercomparisons between the TOA methods have shown that the temperature protocol and the optical technique can make a difference in the measured EC content (Chow et al., 2001; Schmid et al., 2001; Schauer et al., 2003; Subrama-nian et al., 2006). The organic composition can also affect the measured EC, as not all organic matter chars (Schauer et al., 2003). Inorganic matter such as mineral oxides and salts found in biomass smoke (such as KCl) can alter the tem-perature at which complex/large organic compounds and EC evolve off the filter (Novakov and Corrigan, 1995; Boparai et al., 2008). This means that using a single cut-off temperature to determine OC/EC content may introduce uncertainties that are not easily quantified since changes in the rate at which charred OC and EC evolve affect the optically-determined OC/EC split (Subramanian et al., 2006).
Build-up of refractory mineral oxides on the filters used in semi-continuous OC/EC analyzers can also affect the OC/EC split (Polidori et al., 2006). The effect of varying mineral oxide content on the thermal behavior of soot can be iso-lated and quantified with a “pure soot” material, if avail-able. Comparing different TOA techniques with ambient or
atmospherically-relevant samples is difficult, however, since the actual chemical composition – the fraction of OC/EC in the sample – is not known a priori. Mixtures of a known quantity of soot with known masses of different organic com-pounds or organic extracts of ambient particle mass can over-come this difficulty. Thus, a well-characterized (with respect to OC/EC) SRM will reduce some of the uncertainties as-sociated with the different thermal and thermal-optical tech-niques.
A number of potential candidates for soot reference ma-terials have been introduced in recent years (Yang and Yu, 2002; Chen et al., 2004; Klouda et al., 2005); however, none have been generally accepted as the standard by those who measure BC properties. For example, a filter-based NIST standard, reference material 8785 was specifically developed for calibrating TOA methods. This SRM is produced by re-suspending Urban Dust (NIST standard 1649a) and filter-ing it with quartz fiber filters (Klouda et al., 2005). This approach is compelling because the chemical composition of the urban dust is very well characterized. When these filters were evaluated, however, with a two standard proto-cols – the Interagency Monitoring of Protected Visual Envi-ronments (IMPROVE) and the Speciation Trends Network; National Institute of Occupational Safety and Health (STN-NIOSH; Chow et al., 1993; Birch and Cary, 1996; NIOSH, 1999) – even though the sum of the EC and OC agreed quite well, the measured fraction of OC differed by more than 60 % (Klouda et al., 2005). Due to the complexity of the NIST 8785 SRM, the source of the differences between the two techniques could not be resolved and it was concluded that the separation of EC and OC is method dependent with no way to assess which of the two protocols was providing the more accurate results.
The objective of the current work is to introduce the con-cept of a well characterized, laboratory-fabricated SRM for the express purpose of validating the methodology of thermal optical analyzers with respect to the accuracy of separating EC from OC. An approach is presented for the fabrication of SRM with precisely controlled mixtures of EC and OC that are representative of compounds found in the particles produced by combustion of fossil fuel. The utility of this approach is illustrated with an analysis of a number SRM samples using the TOA method.
2 Methodology
in combustion particles may significantly restrict the utility of such an approach. To resolve this problem a simplifica-tion was suggested by McFiggans et al. (2005) who grouped organic aerosol species into a relatively small number of rep-resentative compounds. In our work we use a basic elemental carbon substrate and deposit organic compounds from these groups on it, compounds that are representative of the main classes of organics identified in the surface coverage of soots produced by fossil fuel burning, an approach suggested by Popovicheva et al. (2009).
The basic elemental carbon substrate, referred to herein as elemental carbon reference material (ECRM), is produced from combustion particles using a graphitization procedure. In this procedure the randomly ordered microstructure of technical carbon (also known as thermal black) undergoes graphitization at temperatures of ≈3000◦C in an
oxygen-free atmosphere (Avgul and Kiselev, 1970) and the amor-phous carbon microstructure changes to well-organized crys-tallites of graphite platelets. Simultaneously during this pro-cedure, soot loses any inorganic or organic coverage, volatile oxygen-containing groups and mineral contaminations (ash). Several kinds of technical carbon, commercially produced by pyrolysis of natural gas, were tested in our work as pri-mary material for ECRM production. The ones eventually selected were the thermal soots TG-10 and TG-100 (Elec-trougly Ltd. and Uchta OPP) with surface areas of 10 and 98 m2g−1, respectively, because they could be easily graphi-tized and have distinct primary particle sizes. These were heated in an oven with nitrogen at 3000◦C producing graphi-tized thermal soots (GTS) with surface areas of near 6 and 80 m2g−1 (GTS-6 and GTS-80), respectively. The repro-ducibility of the GTS properties was evaluated using multiple samples generated from this technique.
The main classes of non-polar organics that have been identified in diesel and aviation soot are alkanes and pol-yaromatic hydrocarbons (PAHs) (Popovicheva et al., 2009). Polyethyleneglucol (PEG) is representative of the polymer polar compounds, and aromatic and aliphatic acids are re-lated to polar materials. In our work representative organ-ics were selected from each group of identified compounds: (1) octacosane, C28H58, for alkanes, (2) pyrene, C16H10, for PAHs, (3) 2,6-naphthalene dicarboxylic acid, C12H8O4, 1,2,4-benzene tricarbocylic acid (trimellitic acid), C9H6O6, and 1,3,5-benzenetricarboxylic acid (trimesic acid), C9H6O, for aromatic acids and (4) PEG Carbowax 600 (M 570–630) OH [−C2H4O−]nH for polymer compounds. These choices take into account that the organic compounds deposited on the surface should be nonvolatile at normal temperatures and pressures and strongly bonded on the surface with a mono-layer coverage stable up to 200–250◦C as required by the methodology for OC coverage (see below).
Synthetic soot was created by this method to estimate the amount of organic matter deposited from the solution from a given number concentration of the modifier. For this test GTS-6 was chosen as the basic EC substrate with
organic dyes acid orange C16H11N2O4SN (MW = 350) and acid antraquinonic C16H9N2O7SNa (M = 372) as organic modifiers. Adsorption was performed from the aqueous solu-tion of a given acid concentrasolu-tion. The concentrasolu-tion is con-trolled by measurements of the optical density of the aque-ous solutions during adsorption and the process is assumed completed when the solution loses its color. The solution is removed and the soot residual is dried at 110◦C for five hours.
The method of “forced adsorption” is used for producing coverage by deposition of a given organic species on the EC substrate (Vlasenko et al., 1997; Esteve et al., 2004). It is based on the techniques developed in adsorption science for the production of modified soot with “programmable prop-erties”. The forced adsorption is generated from the organic solutions dependent on the nature of the modifier and its sol-ubility in a given solvent. The concentration of the modifier is chosen to be less than its solubility in the solution. For ad-sorption of octacosane,n-hexane is used as a solvent while pyrene is deposited from benzene. For adsorption modifica-tion by trimesic acid, trimellitic acid and dicarboxylic acid, naphthalene dimethyl formamide, acetone and water solution of ammonia are used, respectively. Carbowax is deposited from dichlormethane.
A given modifier, in the amount proposed for modifica-tion, is mixed with the solvent and GTS is then introduced into the prepared solution where the ratio of modifier to soot mass defines the thickness of the proposed coverage. The so-lution volume should be larger than GTS volume by 5–10 %. The mixture of solvent with modifier and GTS is heated for 2–10 h and a homogeneous distribution of the modifier over the GTS surface is achieved by carefully mixing the solution with GTS in a rotor evaporator. The solvent is partially re-moved in the evaporator then further extracted in an oven at a temperature 10–20◦C higher than the solvent boiling tem-perature. The final purification of fabricated samples takes place in an inert gas flow at high temperature determined by the thermal stability of the deposited organics. Experi-ence indicates that a 1–3 % variation in the coating can be expected.
Variation of the solution concentration allows the depo-sition of organic matter from sub-monolayer to multilayers, i.e. the production of up to 10 % of an organic coverage, by weight percent, where the methodology proposed may pro-vide the most stable, strongly bonded compounds on the sur-face. For this purpose the concentration of GTS soot in the solvent is varied from 5 to 50 %. Reproducibility of results is proven by numerous repetitions of the laboratory soot pro-duction and characterization of its properties.
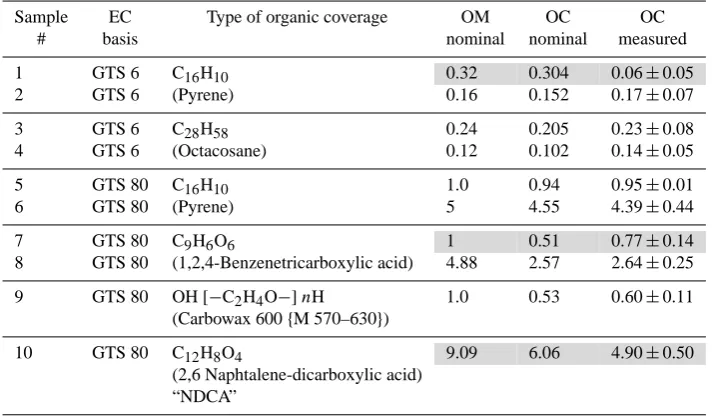
Table 1. Soot reference materials: EC basic and nominal organic matter (OM), organic carbon (OC), nominal and derived by the thermo/optical technique, wt %. Shaded cells indicate differences between the nominal and measured OC that are found to be outside the estimated uncertainty.
Sample EC Type of organic coverage OM OC OC
# basis nominal nominal measured
1 GTS 6 C16H10 0.32 0.304 0.06±0.05
2 GTS 6 (Pyrene) 0.16 0.152 0.17±0.07
3 GTS 6 C28H58 0.24 0.205 0.23±0.08
4 GTS 6 (Octacosane) 0.12 0.102 0.14±0.05
5 GTS 80 C16H10 1.0 0.94 0.95±0.01
6 GTS 80 (Pyrene) 5 4.55 4.39±0.44
7 GTS 80 C9H6O6 1 0.51 0.77±0.14
8 GTS 80 (1,2,4-Benzenetricarboxylic acid) 4.88 2.57 2.64±0.25
9 GTS 80 OH[−C2H4O−]nH 1.0 0.53 0.60±0.11 (Carbowax 600{M 570–630})
10 GTS 80 C12H8O4 9.09 6.06 4.90±0.50
(2,6 Naphtalene-dicarboxylic acid) “NDCA”
slightly coated with organic compounds (0.1–0.3 %). Cre-ating an SRM with a very small coCre-ating of OC serves to demonstrate the sensitivity of techniques for measurements of the OC fraction in soot (Sect. 4). Larger amounts of pyrene and trimellitic acid (up to 5 %), deposited on GTS-80 can be used for evaluating those techniques where the thickness of the OC coverage may play a role. A maximum organic cov-erage of 9 % has thus far been deposited on GTS-80 using naphthalene dicarboxylic acid.
To demonstrate the quality of the applied graphitization procedure the selected materials have been characterized with respect to the elemental composition (carbon and oxy-gen content), the amount of impurities (ash) and quality of the surface (homogeneity). The morphology and the shape of soot particles deposited on a conductive silicone plate were determined by scanning electron microscopy (SEM) using a LEO 1430-vp (Karl Zeiss) with a spatial resolution of 5 nm. When coupled with X-ray Energy Dispersive Spectroscopy (XREDS) this analysis approach allowed the evaluation of soot elemental composition with a sensitivity of 0.3 wt %. The SEM measurements were accompanied by conventional bulk analysis that provides the average composition. Chem-ical elements with atomic numbers larger than 11 are de-termined by X-ray fluorescence spectroscopy (XFS) using a scanning vacuum crystal diffraction spectrometer SPEC-TROSCAN (40 kV) with the detection limit of 1 µg g−1. The volatile fraction (volatility) of technical carbons and GTS soot was roughly determined by weighing the sample before and after heating at 537 K for 30 min. The water soluble frac-tion (WSF) was obtained after washing in deionized water followed by filtration and evaporation.
Fig. 1. Typical SEM image of (A) technical carbon (thermal soot) which was chosen for production of EC RM and (B) GTS-6 soot after
graphitization of thermal soot.
3 Characterization of Elemental Carbon RM (ECRM)
Typical particles of thermal TG-100 soot are shown in Fig. 1a. The average diameter,D, of the primary particles is 260±1.4 nm, evaluated from more than six hundred TEM images of thermal soot (Popovicheva et al., 2008). Graphiti-zation of thermal soot significantly changes the shape and size of primary particles. Analysis of TEM images of GTS-6 and GTS-80 shows that the average diameters are 180±1.4 nm and 32±1.24 nm, respectively. Figure 1b il-lustrates a typical SEM image of GTS-6 soot particles and shows the polyhedron structure of primary particles that arises due to graphitization of soot under high temperature exposure.
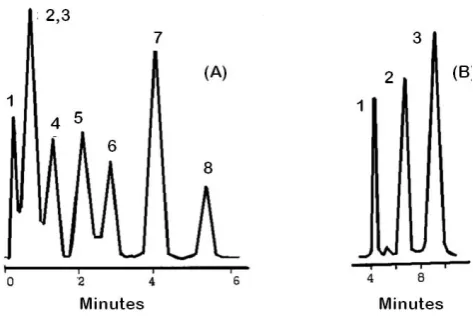
There are numerous studies in the literature demonstrat-ing that the surface of graphitized soot is flat, chemically and geometrically homogeneous, and therefore inert and stable (Avgul and Kiselev, 1970; Kiselev and Yashin, 1969). Our examination of typical features of the interaction of probe molecules with the surfaces of GTS-6 and GTS-80 in the gas chromatograph validates these properties for fabricated SRMs. Figure 2a shows the chromatogram for a number of probe molecules on GTS-6 which are highly symmetric. Together with the independence of the retention time from the amount of interacting probe molecules, and the linear dependence of the retention volume on a number of atoms in a hydrocarbon probe molecule, these features indicate the homogeneous surface of fabricated ECRM. Similar features of homogeneous surfaces are demonstrated for SRMs with deposited organics. Figure 2b shows the chromatogram of complete separation of highly symmetric isomers on GTS-6 with 0.32 % pyrene (sample No. 1 of Table 1). Adamantane, with a more compact molecule structure, is eluted first fol-lowed by endo- trimethylenenorbornane (TMNB) which has
Fig. 2. Chromatograms on (A) GTS-6 for demonstration of high
ge-ometrical and chemical uniformity of the surface. The peaks corre-spond to (1)n-hexane, (2) adamantane, (3)n-heptane, (4)n-octane, (5)n-nonane, (6) indene, (7) tetralin, and (8)n-decane. (B) GTS-6 with 0.32 % pyrene (sample 1 in Table 1). The peaks correspond to (1) adamantane, (2) endo- and (3) exo-trimethylenenorbornane.
a larger number of surface contacts. Exo-TMNB, which has the most planar structure, is finally eluted.
928 O. Popovicheva et al.: Tailored graphitized soot as reference material for EC/OC measurement validation
Fig. 3. Retention volume vs weight percent of pyrene deposited
on GTS-6 and GTS-80 (samples are indicated with respect to Ta-ble 1. Probe molecules are used:
16
0,0 0,1 0,2 0,3 0,4 0,5 0,6 0,7 -2 -1 0 1 2 3 6 1 2 5 lnVa
pyrene coverage, mg/m2
Figure 3. Retention volume vs weight percent of pyrene deposited on GTS-6 and GTS-80 (samples are indicated with respect to Table1. Probe molecules are used: ▲) n-heptane, Δ) methylethylketon, ○) benzene, ●) n-hexane.
n-heptane,
16
0,0 0,1 0,2 0,3 0,4 0,5 0,6 0,7 -2 -1 0 1 2 3 6 1 2 5 lnVa
pyrene coverage, mg/m2
Figure 3. Retention volume vs weight percent of pyrene deposited on GTS-6 and GTS-80 (samples are indicated with respect to Table1. Probe molecules are used: ▲) n-heptane, Δ) methylethylketon, ○) benzene, ●) n-hexane.
methylethylketon,
16
0,0
0,1
0,2
0,3
0,4
0,5
0,6
0,7
-2
-1
0
1
2
6
1
2
lnVa
pyrene coverage, mg/m
2Figure 3.
Retention volume vs weight percent of pyrene deposited on GTS-6 and GTS-80
(samples are indicated with respect to Table1. Probe molecules are used:
▲
) n-heptane,
Δ
)
methylethylketon,
○
) benzene,
benzene,●
) n-hexane.
16
0,0
0,1
0,2
0,3
0,4
0,5
0,6
0,7
-2
-1
0
1
2
6
1
2
lnVa
pyrene coverage, mg/m
2Figure 3.
Retention volume vs weight percent of pyrene deposited on GTS-6 and GTS-80
(samples are indicated with respect to Table1. Probe molecules are used:
▲
) n-heptane,
Δ
)
methylethylketon,
○
) benzene,
●
) n-hexane.
n-hexane.It is observed that increasing the pyrene coverage decreases the retention volumes. At 0.54 mg m−2 the minimum re-tention volume is seen to be related to the formation of a statistically dense pyrene monolayer (Kiselev et al., 1971). At higher coverages the interaction of probe molecules is en-hanced by the formation of a pyrene monolayer. Thus, this chromatographic calibration determines the monolayer cov-erage providing the quantitative analyses of deposited mate-rial and the reproducibility of the production methodology from a sub-monolayer up to a few monolayers.
The measured surface areas of GTS are 5.6±0.3 and 79±2 m2g−1for GTS-6 and GTS-80, respectively. The de-crease of the surface area after graphitization leads also to the decrease by a factor of 1.5 of the mesopore volume for GTS-6 (Popovicheva et al., 2008). This nearly non-porous crostructure is a good prerequisite for the stable particle mi-crostructure. The heat treatment of technical carbon reduces the oxygen content and water soluble fraction from 4.0 and 0.45 wt %, respectively, leading to a negligible amount of both oxygen and water in GTS-6 soot (within the measure-ment accuracy). The volatile fraction of technical carbon is determined to be 0.6 wt % before and .0032 wt % after treat-ment. Table 2 lists the content of mineral and metal impu-rities in TG-100 and GTS-80 obtained by XFS, demonstrat-ing the negligible amount of any inorganic contaminations in graphitized soot.
Additional examination of the composition of the SRM may be made by reasonably assuming a high sensitivity of water molecule absorbability to oxygen-containing function-alities and water soluble compounds on the surface. Compar-ative analysis of water uptake on original thermal and fabri-cated GTS (Popovicheva et al., 2008) validates that thermal soot may be classified as hydrophobic soot due to water ad-sorption on some active sites (oxygen-containing functional
Table 2. Content of mineral and metal impurities in thermal and
graphitized soots, 10−3wt %.
Si A1 Ca Cu B Mn Mg Fe V Ti
TG-100 .5 .29 .72 .14 .35 .43 .36 1.24 .11 .17 GTS-80 0 .01 .61 0 .04 .11 .11 .13 0 0
Fig. 4. These distributions show how the concentration of basic
GTS-80 and GTS-80 soots with various organic coatings varies with size. Adding layers of material leads to an apparent shift in the distribution to smaller sizes but this is possibly due to changes in the shape of the particles that alter their behavior in the differential mobility analyzer.
groups of the surface organic and inorganic contaminations). In contrast, GTS shows negligible adsorption, so little that we could not estimate the number of active sites. It has been pointed out in Gregg and Sing (1982) that when heating at 1300 K the functional groups which are responsible for the water adsorption are almost removed from the soot surface, together with the surface coverage. Thus, GTS should be classified as extremely hydrophobic soot with chemically ho-mogeneous surface of high quality cleanness.
4 Evaluation of SRM properties
4.1 Size distributions
Samples of fabricated ECRMs and SRMs, always in powder form, were analyzed with a TSI Inc, scanning mobility parti-cle sizer (SMPS) to evaluate the relative number concentra-tion as a funcconcentra-tion of the mobility diameter. Figure 4 shows an example of the size distribution of uncoated GTS-80 par-ticles (black curve), GTS-80 coated with 0.12 % and 0.24 % of octacosane, Samples No. 4 and 3 (blue and pink curves) and with 0.16 % and 0.32 % of pyrene, Samples No. 2 and 1 (green and red curves). The relative concentrations are a
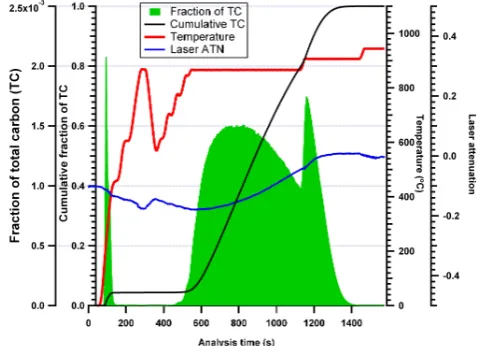
Fig. 5. This graph shows a typical time evolution of carbon that
evolves from ECRM sample (GTS-6) during the thermal/optical process. The shaded green curve shows the fraction of total car-bon (TC) that is released as the sample is heated. The cumulative percent of TC is shown in the black curve. The temperature history is given in red and the attenuation of the laser transmitted through the sample filter is given in blue.
function, not of the composition, but of the degree of dilution when dispersing a given sample with a nebulization system. There is a slight decrease in the modal diameter as the rela-tive fraction of organic material is increased. This is related to how the SMPS sorts particles by size, measuring the mo-bility rather than the geometric diameter of particles. Parti-cles are removed from the sample volume of the SMPS based upon their electrical and mechanical mobility and their aero-dynamic behavior in the moving airflow in the SMPS sample chamber. The motion of non-spherical particles in the airflow and electrical field are different than spherical particles under the same conditions (Zelenyuk and Imre, 2007) due to how non-spherical particle align themselves in the electrical field. The result is that those particles that have shape factors1, i.e. highly non-spherical, will have apparently larger mobility diameters than more symmetrical particles. This is apparent in Fig. 4 where the coating of OC on the SRM changes the more irregular shape of GTS to a smoother and more spheri-cal form that has a subsequently smaller mobility diameter.
4.2 OC and EC content of the SRMs
The SRM samples listed in Table 1 were evaluated at Sunset Laboratories using TOA with Transmission (TOT) to mea-sure the relative fraction of OC and EC. The methodology for preparing the sample for analysis was as follows:
1. A clean Pallflex quartz filter was pre-fired and several segments were punched from this filter with dimensions of 1.5×1.0 cm.
2. Each punch was weighed.
Fig. 6. This graph is the same as shown in Fig. 5 except the analysis
is for GTS-80 covered with 5 % of pyrene (Sample No. 6).
3. The reference material, stored in a glass test tube, was gently mixed by shaking and then a small amount re-moved with a small spatula. The rere-moved material just covered the surface of the spatula.
4. The material was transferred to the filter punches (at least two samples per filter) by gently tapping the ula and spreading the material with the edge of the spat-ula over the center portion of the filter where the laser transmission is maximimum.
5. The punch is weighed again to determine the sample weight.
6. The punch is placed in the analyzer and evaluated using the NIOSH protocol that is used in all Sunset Labora-tory analysis.
7. After the analysis, the punch is weighed again to deter-mine the weight of refractory materials.
used to indicate when the light absorbing carbon (EC) has been totally removed. When the transmitted light reaches its maximum value and remains constant, this indicates that no EC remains.
As seen in Fig. 5, since there is no OC on the ECRM there is no fractional TC appearing until 500 s when the tem-perature has exceeded 600◦C. In Fig. 6, however, the frac-tional TC is seen to momentarily increase at 50 seconds when the temperature reaches 100◦C then decreases as all of OC is removed by 150 s at 400◦C. Once again at 400 s and 600◦C, fractional TC is again seen to increase until all EC is completely removed by 1400 s. For the uncoated GTS-6 and coated GTS-80, the mass fraction of OC is found to be 0.065 % and 4.39 %, respectively. Analysis of the pure GTS showed very good precision, less than 5 % deviation amongst multiple samples.
The ten SRM samples listed in Table 1 were analyzed to compare the nominal OC mass deposited on EC basic substrates to the OC derived by the Sunset Labs TOA. As shown in Table 1 seven of the ten samples demonstrated a very good correspondence between the nominal and mea-sured OC, within the expected uncertainty in the meamea-sured OC fraction. We especially pay attention to the SRMs with low OC, Samples No. 2, 3 and 4 that demonstrate the sen-sitivity of TOA techniques to low fractional amounts of OC. For one sample, Sample No. 1, the difference between the nominal and measured OC fraction is far outside the expected uncertainty. This sample was measured a number of times with the similar result that the OC fraction is significantly smaller than the nominal. The differences in nominal and measured in Samples No. 7 and 10 are only marginally out-side of the estimated uncertainty. At this time the discrep-ancy in the first sample cannot be explained. The other two samples, although outside of the expected deviation are still in reasonably good agreement with the nominal values.
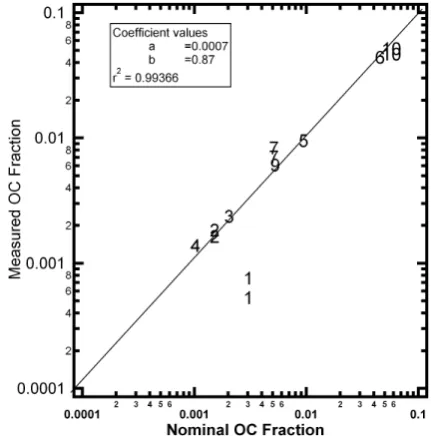
Figure 7 summarizes the comparisons between the nomi-nal and measured soot reference materials listed in Table 1, where the numbers refer to the sample numbers tabulated in the table. Multiple markers with the same sample number represent those filters that were analyzed more than once. As the regression analysis shows, the slope of the best-line is within 13 % of one to one and an offset of only 0.0007. If the measurements from the first sample are removed, the slope of the best fit line becomes 0.95. The linearity (r2= 0.993) and almost 1:1 slope over almost two orders of magnitude sug-gests that, even though this is not an exhaustive evaluation, these soot reference materials provide a very good method for assessing the accuracy and sensitivity of the TOA tech-nique for estimating EC and OC.
SRM stability
The property of particles to adsorb water vapor from a humid atmosphere and organic gases from polluted environments, given sufficient time, is of particular concern when working
Fig. 7. The SRM samples that are listed in Table 1 were analyzed
using the thermal/optical analysis (examples shown in Figs. 5 and 6) to derive the weight percent of OC for comparison with the nomi-nal values. This graph shows the comparison where the numbers refer to the samples in Table 1. The coefficient values refer to the linear regression,Y=a+ bX, whereXandY are the nominal and measured values, respectively. The correlation coefficient is given byr2.
with soot that has a high surface area such as GTS-80. There-fore, any reference material that is prepared for instrument calibration may acquire either a water or an organic cover-ing if stored for too long after it has been fabricated. The susceptibility of the GTS reference materials was tested by evaluating some samples of SRMs after six months of stor-age in a plastic box with a loosely fitted lid. The sample of GTS-80 that had been stored for more than six months at the Moscow University laboratory was sent back to Sunset Lab-oratories for reanalysis. The OC/TC ratio measured for the first GTS-80 sample was 0.0549 % and for the second sample it was 0.0575 %, compared to zero for nominal value for de-posited organic matter. The good reproducibility of the water adsorption isotherm and very low volatility, just 0.03 wt %, indicates the high level of chemical inertness of this material and hence, a good candidate for an SRM. Moreover, as a re-sult of thermo/optical measurements of these stored samples we have obtained very low OC for samples of GTS-6 and GTS-80, for both the original ones and those specially pre-treated before measurements (out-gassing at 350◦C). There-fore we may conclude that during the storage and transporta-tion there are insignificant changes to the prepared samples due to absorption of ambient OC.
morphology and microstructure, in contrast to microporous particulates generated from combustion that are susceptible to contamination (Everett and Ward, 1986). Cycling the GTS-6 soot particles through high relative humidity (humidi-fied to 98 % RH and then dried to 0.5 % RH) does not change the water adsorbability, unlike, for example, kerosene flame produced particles (Popovicheva et al., 2008).
Special attention has been focused on evaluating SRMs af-ter long-time storage. The methodology of the stable, strong bonding of deposited compounds on the surface, applied for reference material production, should guarantee a stable cov-ering of GTS. In order to evaluate the quality of samples that had been stored in the plastic boxes during four months they were exposed to nitrogen at 150◦C for eight hours then weighed to analyze the loss of mass. For example, for the sample No. 1 in Table 1 the mass loss was 0.08 %. For the sample No. 5 the measurements of the retention volumes for three probe molecules were repeated after four months. The retention volume for benzene was changed from 93 to 95.8 cm3g−1, a value that is well within the framework of the measurement accuracy of 5 %. These results indicate negligi-ble change in the composition of the SRM during long-time storage.
5 Summary
Calibration and validation of instruments that measure the properties of black carbon (soot) is a major obstacle to our understanding of how this ubiquitous atmospheric particle is formed, evolves and impacts health and climate. The lack of reference materials whose properties are well character-ized has hampered efforts by the atmospheric community to arrive at standard calibration techniques that allow evalua-tion of measurement methods and comparison of data sets taken at multiple locations over different periods of time. An SRM is proposed that consists of graphitized thermal soot coated with precise coverings of organic material with dif-ferent molecular structures, similar to those found in the nat-ural environment. A preliminary evaluation has been con-ducted of ten samples of this SRM with organic matter from 0.102 %–9.09 %. The OC mass percent was measured with a Sunset Laboratory’s EC/OC Thermal/Optical analyzer with a nearly one to one correspondence between the nominal and measured OC percent by weight. Evaluation of the long-term stability of the samples showed negligible change in the chemical or morphological properties after storage for four months. These results suggest that tailored graphitized soot is an excellent candidate as an SRM, for evaluating the sen-sitivity of thermal/optical analyzers with respect to the dif-ferentiation of OC from EC as a function of different organic coatings. The range of OC/TC ratios that we used in the ini-tial tests would be a reasonable set of standards; however, all ten would not necessarily be needed as there does not seem to be any sensitivity to the type of OC. It is necessary to choose
a set of the smaller percentages of OC/TC to establish the sensitivity of a particular TOA methodology and as high a percentage as possible to look for non-linearities.
Acknowledgements. This work was funded by CSIC-RFBR
project 11-08-93980 and by grant of the President of the Russian Federation SS-3322.2010.2. The authors thank M. A. Timofeyev (Moscow State University) for SEM measurements.
Edited by: A. Wiedensohler
References
Avgul, N. N. and Kiselev, A. V.: Physical Adsorption of Gases and Vapours on Graphitized Carbon Blacks, Chemistry and Physics of Carbons, edited by: Walker, P. L., 6, Dekker, New York, 1– 124, 1970.
Balbus, J. M., Maynard, A. D., Colvin, V. L., Castranova, V., Daston, G. P., Denison, R. A., Dreher, K. L., Goering, P. L., Goldberg, A. M., Kulinowski, K. M., Monteiro-Riviere, N. A., Oberd¨orster, G., Omenn, G. S., Pinkerton, K. E., Ramos, K. S., Rest, K. M., Sass, J. B., Silbergeld, E. K., and Wong, B. A.: Meeting report: hazard assessment for nanoparticles – report from an interdisciplinary workshop, Environ. Health Persp., 115, 1654–1657, 2007
Birch, M. E. and Cary, R. A.: Elemental Carbon-Based Method for Monitoring Occupational Exposures to Particulate Diesel Ex-haust, Aerosol Sci. Tech., 25, 221–241, 1996.
Boparai, P., Lee, J., and Bond, T. C.: Revisiting Thermal-Optical Analyses of Carbonaceous Aerosol Using a Physical Model, Aerosol Sci. Tech., 42, 930–948, 2008.
Chen, L.-W. A., Chow, J. C., Watson, J. G., Moosm¨uller, H., and Arnott, W. P.: Modeling Reflectance and Transmittance of Quartz-Fiber Filter Samples Containing Elemental Carbon Parti-cles: Implications for Thermal/Optical Analysis, J. Aerosol Sci., 35, 765–780, 2004.
Chow, J. C., Watson, J. G., Pritchett, L. C., Pierson, W. R., Frazier, C. A., and Purcell, R. G.: The DRI Thermal Optical Reflectance Carbon Analysis System – Description, Evaluation and Applica-tions in United-States Air-Quality Studies, Atmos. Environ. A-Gen., 27, 1185–1201, 1993.
Chow, J. C., Watson, J. G., Crow, D., Lowenthal, D. H., and Mer-rifield, T.: Comparison of IMPROVE and NIOSH Carbon Mea-surements, Aerosol Sci. Tech., 34, 23–34, 2001.
Everett, D. H. and Ward, R. J.: A study of the effects of heat treat-ment on the physical properties of the carbon black Vulcan 3, J. Chem. Soc., 1, 2915–2928, 1986.
Esteve, W., Budzinski, H., and Villenave, E.: Relative rate con-stants for the heterogeneous reactions of NO2and OH radicals with polycyclic aromatic hydrocarbons adsorbed on carbona-ceous particles, Part 2: PAHs adsorbed on diesel particulate ex-haust SRM 1650a, Atmos. Environ., 38, 6063–6072, 2004. Gregg, S. J. and Sing, K. S. W.: Adsorption, surface area and
poros-ity, Academic Press, New York, 2nd edition, 320 pp., 1982. Kiselev, A. V. and Yashin, Y. I.: Gas-Adsorption Chromatography,
Plenum Press, New York, 289 pp., 1969.
Klouda, G. A., Filliben, J. J., Parish, H. J., Chow, J. C., Watson, J. G., and Cary, R. A.: Reference Material 8785: Air Particulate Matter on Filter Media, Aerosol Sci. Tech., 39, 173–183, 2005. McFiggans, G., Alfarra, M. R., Bower, K., Coe, H., Cubison, M.,
Topping, D., Williams, P., Desesari, S., Facchini, C., and Fuzzi, S.: Simplification of the representation of the organic compo-nent of atmospheric particulates, Faraday Discuss., 130, 345– 362, 2005.
Moteki, N., Kondo, Y., Miyazaki, Y., Takegawa, N., Komazaki, Y., Kurata, G., Shirai, T., Blake, D. R., Miyakawa, T., and Koike, M.: Evolution of mixing state of black carbon particles: Aircraft measurements over the western Pacific in March 2004, Geophys. Res. Lett., 34, L11803, doi:10.1029/2006GL028943, 2007. NIOSH – National Institute of Occupational Safety and Health:
ElementalC arbon (Diesel Particulate): Method 5040, Issue 3 (Interim), NIOSHManual of Analytical Methods, 4th edition, DHHS (NIOSH) Publication No. 94-113, edited by: Cassinelli, M. E. and O’Connor, P. F., National Institute for Occupational Safety and Health, US Department of Health and Human Ser-vices, Cincinnati, OH, 1999.
Novakov, T. and Corrigan, C. E.: Thermal Characterization of Biomass Smoke Particles, Mikrochim. Acta, 119, 157–166, 1995.
Polidori, A., Turpin, B. J., Lim, H.-J., Cabada, J. C., Subrama-nian, R., Pandis, S. N., and Robinson, A. L.: Local and Re-gional Secondary Organic Aerosol: Insights from a Year of Semi-Continuous Carbon Measurements at Pittsburgh, Aerosol Sci. Tech., 40, 861–872, 2006.
Popovicheva, O. B., Persiantseva, N. M., Shonija, N. K., DeMott, P., Koehler, K., Petters, M., Kreidenweis, S., Tishkova, V., Demird-jian, B., and Suzanne, J.: Water interaction with hydrophobic and hydrophilic soot particles, Phys. Chem. Chem. Phys., 10, 2332– 2344, 2008.
Popovicheva, O. B., Kireeva, E. D., Shonija, N. K., and Khokhlova, T. D.: Water interaction with laboratory-simulated fossil fuel combustion particles, J. Phys. Chem. A., 113, 10503–10511, 2009.
Ramanathan, V. and Carmichael, G.: Global and regional climate changes due to black carbon, Nat. Geosci., 1, 221–227, 2008. Rudzinski, W. and Everett, D. H.: Adsorption of Gases on
Hetero-geneous Surface, Academic Press, London, 578 pp., 1992. Schauer, J. J., Mader, B. T., Deminter, J. T., Heidemann, G., Bae, M.
S., Seinfeld, J. H., Flagan, R. C., Cary, R. A., Smith, D., Huebert, B. J., Bertram, T., Howell, S., Kline, J. T., Quinn, P., Bates, T., Turpin, B., Lim, H. J., Yu, J. Z., Yang, H., and Keywood, M. D.: ACE-Asia Intercomparison of a Thermal-Optical Method for the Determination of Particle-Phase Organic and Elemental Carbon, Environ. Sci. Technol., 37, 993–1001, 2003.
Schmid, H., Laskus, L., Abraham, H. J., Baltensperger, U., La-vanchy, V., Bizjak, M., Burba, P., Cachier, H., Crow, D., Chow, J., Gnauk, T., Even, A., ten Brink, H. M., Giesen, K. P., Hitzen-berger, R., Hueglin, E., Maenhaut, W., Pio, C., Carvalho, A., Putaud, J. P., Toom-Sauntry, D., and Puxbaum, H.: Results of the “Carbon Conference” International Aerosol Carbon Round Robin Test Stage I, Atmos. Environ., 35, 2111–2121, 2001. Subramanian, R., Khlystov, A. Y., and Robinson, A. L.: Effect of
Peak Inert-Mode Temperature on Elemental Carbon Measured using Thermal-optical Analysis, Aerosol Sci. Tech., 40, 763– 780, 2006.
Vlasenko, E. V., Gavrilova, T. B., and Daidakova, I. V.: Intermolec-ular interaction in gas chromatography on carbon black coated with monolayers of hydrocarbons with different electronic struc-tures, Adsorpt. Sci. Technol., 15, 79–90, 1997.
Yang, H. S. and Yu, J.: Uncertainties in Charring Correction in the Analysis of Elemental and Organic Carbon in Atmospheric Par-ticles by Thermal/Optical Methods, Environ. Sci. Technol., 36, 5199–5124, 2002.