www.the-cryosphere.net/5/219/2011/ doi:10.5194/tc-5-219-2011
© Author(s) 2011. CC Attribution 3.0 License.
The Cryosphere
Northern Hemisphere spring snow cover variability and change
over 1922–2010 including an assessment of uncertainty
R. D. Brown1and D. A. Robinson2
1Climate Processes Section, Climate Research Division, Environment Canada @ Ouranos, 550 Sherbrooke St. West, 19th Floor, Montr´eal, QC, H3A 1B9, Canada
2Department of Geography, Rutgers University, 54 Joyce Kilmer Avenue, Piscataway, NJ 08854-8054, USA Received: 5 November 2010 – Published in The Cryosphere Discuss.: 24 November 2010
Revised: 22 February 2011 – Accepted: 27 February 2011 – Published: 16 March 2011
Abstract. An update is provided of Northern Hemisphere
(NH) spring (March, April) snow cover extent (SCE) over the 1922–2010 period incorporating the new climate data record (CDR) version of the NOAA weekly SCE dataset, with annual 95% confidence intervals estimated from re-gression analysis and intercomparison of multiple datasets. The uncertainty analysis indicates a 95% confidence interval in NH spring SCE of±5–10% over the pre-satellite period and±3–5% over the satellite era. The multi-dataset anal-ysis shows larger uncertainties monitoring spring SCE over Eurasia (EUR) than North America (NA) due to the more complex regional character of the snow cover variability and larger between-dataset variability over northern Europe and north-central Russia.
Trend analysis of the updated SCE series provides evi-dence that NH spring snow cover extent has undergone sig-nificant reductions over the past∼90 yr and that the rate of decrease has accelerated over the past 40 yr. The rate of de-crease in March and April NH SCE over the 1970–2010 pe-riod is∼0.8 million km2per decade corresponding to a 7% and 11% decrease in NH March and April SCE respectively from pre-1970 values. In March, most of the change is be-ing driven by Eurasia (NA trends are not significant) but both continents exhibit significant SCE reductions in April.
The observed trends in SCE are being mainly driven by warmer air temperatures, with NH mid-latitude air tempera-tures explaining∼50% of the variance in NH spring snow cover over the 89-yr period analyzed. However, there is also evidence that changes in atmospheric circulation around 1980 involving the North Atlantic Oscillation and Scandina-vian pattern have contributed to reductions in March SCE over Eurasia.
Correspondence to: R. Brown
(brown.ross@ouranos.ca)
1 Introduction
Reliable information on spatial and temporal variability in continental and hemispheric snow cover extent (SCE) is im-portant for climate monitoring (e.g. Arndt et al., 2010), cli-mate model evaluation (e.g. Foster et al., 1996; Frei et al., 2005; Roesch, 2006; Brown and Frei, 2007) and cryosphere-climate feedback studies (e.g. Hall and Qu, 2006; Fernan-des et al., 2009; Flanner et al., 2011). Previously published estimates of Northern Hemisphere (NH) monthly SCE used for evaluating climate models and monitoring variability and change in hemispheric SCE have typically been based on sin-gle datasets such as the National Oceanic and Atmospheric Administration (NOAA) weekly snow cover dataset (Robin-son et al., 1993) or passive microwave-derived snow cover data (Armstrong and Brodzik, 2001), with little or no in-formation on the likely range of uncertainty in the observa-tions. Brown et al. (2010) showed there can be large differ-ences in the amount of snow cover seen by different satellite sensors related to spatial resolution, cloud cover (for optical sensors) and wavelength specific interactions with the atmo-sphere, snowpack, terrain and land cover. Estimates of SCE derived from surface-based observations also have spatially and temporally varying uncertainties related to the uneven distribution of in situ observations.
monitor NH SCE since 1966 (Robinson et al., 1993). The fixed uncertainty interval applied in the IPCC report does not reflect the different uncertainty levels associated with the pre-satellite in situ-based SCE information, or improvements in snow mapping over the satellite era from increases in satellite resolution and frequency.
Brown et al. (2010) used a multi-dataset approach to esti-mate the observational uncertainty in Arctic spring SCE over the 1967–2008 period. This approach is applied here to pro-vide estimates of the uncertainty in the NH spring SCE series presented in the 4th IPCC Assessment and to update the se-ries using the new climate data record (CDR) version of the NOAA dataset (http://climate.rutgers.edu/snowcover). This version includes corrections to account for a change in map-ping procedures that took place in 1999 (Ramsay, 1998; Hel-frich et al., 2007). The updated series (with estimated uncer-tainty levels) is used to document trends in NH spring SCE over the period from the early 1920s, and to examine associ-ations with air temperature and atmospheric circulation.
2 Datasets
The various sources of snow cover data used in this study are summarized in Table 1. Detailed descriptions of these datasets are provided by Brown et al. (2010) and are not re-peated here. The NH March and April SCE series presented in the 4th IPCC assessment were based on the historical snow cover index of Brown (2000) (henceforth defined as B2000) up to the start of the satellite era in the late-1960s, with SCE values after 1966 obtained from the NOAA weekly dataset (Robinson et al., 1993). The B2000 index was derived from reconstructed and observed daily snow depth over a fixed net-work of climate stations and is available over North Amer-ica (NA) from 1915–1992 for the months of November to April, but is limited to October, March and April over Eurasia (EUR) for the 1922–1991 period due to a sparser network of observations. Consequently this dataset only provides hemi-spheric information in the months of March and April from 1922–1991. McCabe and Wolock (2010) reconstructed NH March SCE back to 1902 using gridded monthly tempera-ture and precipitation data from the Climatic Research Unit (CRU) in a simplified snow accumulation and melt model calibrated with the NOAA SCE dataset to define tempera-ture thresholds for rain-snow probability and melt rate. The results agree reasonably closely with the B2000 series (not surprisingly since SCE and air temperature are strongly cor-related over the NH in March) but the method is not consid-ered to be particularly robust because of the monthly time-step, the use of non-physically based temperature thresholds, and the fact the method requires calibration with the NOAA SCE series.
The NOAA dataset is based on weekly charts of snow cover extent derived from manual interpretation of visible satellite imagery up to 1999. The charting method changed
in May 1999 with the introduction of the higher resolution 24 km daily Interactive Multi-Sensor (IMS) snow cover prod-uct (Ramsay, 1998). A pseudo-weekly prodprod-uct is automati-cally derived from the IMS 24 km daily product assuming the analysis for Monday is representative of the previous week. This change was found to map less snow in mountain regions and has been corrected in the CDR version of the NOAA dataset. SCE was derived with the monthly version of the CDR dataset which gives the fraction of the month that snow cover was present. While efforts have been made to correct for changes in charting procedures in the CDR dataset, it is not possible to correct for any technological bias related to the increase in the volume and resolution of satellite informa-tion over time as well as variainforma-tions in analyst experience and improvements in analysis tools. However, these errors are expected to be small compared to seasonal and interannual fluctuations in continental snow cover extent, and compari-son of NOAA SCE over NA and EUR with a multi-dataset average (Sect. 4.1) showed that the difference series did not contain any trend which provides some evidence that these errors are not affecting the homogeneity of continental SCE in March and April.
The other datasets shown in Table 1 (B2003, CMC, ERA-40, ERA40-rec, NCEP, and PMW) were used to establish the confidence interval in March and April hemispheric SCE series as outlined in Sect. 3. The CMC and B2003 SCE se-ries were combined (henceforth referred to as B2003+CMC) to provide additional NA monthly SCE series for estimating confidence intervals. These two datasets used different pre-cipitation and temperature products to derive the first-guess snow depth field for optimal interpolation of surface snow depth observations, but SCE should be largely insensitive to the background field in the November–April period when the snow line fluctuates across the mid-latitudinal zone of NA where there is a dense network of surface observations (Brown, 2000).
3 Methodology
Table 1. Summary of data sources used in the analysis.
Acronym Dataset Description Period Resolution Data Source
B2000 Monthly snow cover index for NA and Eurasia
based on gridded observed and reconstructed daily snow depth at surface climate stations
NA, 1915–1992 EUR, 1922–1991
190.5 km Brown (2000)
B2003 Daily snow depth analysis over NA from
optimal interpolation of historical in situ snow depth observations
1979–1997 ∼35 km Brown et al. (2003)
CMC Canadian Meteorological Centre global daily
snow depth analysis from optimal interpolation of real-time in situ observations
1998–2010 ∼35 km National Snow and Ice
Data Center (NSIDC), Brasnett (1999)
ERA-40 ERA-40 reanalysis daily snow depths
from assimilated surface observations
1957–2002 ∼275 km European Centre for
Medium-Range Weather Forecasts (ECMWF), Uppala et al. (2005).
ERA-40rec ERA-40 reconstructed snow cover duration
with temperature-index snow model of Brown et al. (2003)
1957–2002 ∼275 km
(with 5 km em-pirical elevation adjustment)
Brown et al. (2010)
NCEP Snow cover proxy derived from National
Centers for Environmental Prediction
Reanalysis daily temperatures (land area inside the 0◦C isotherm)
1948–2008 ∼275 km Brown et al. (2010), Earth
System Research Laboratory, NOAA, Kalnay et al. (1996)
NOAA National Oceanic and Atmospheric
Administration weekly snow/no-snow charts
1966–2010 190.5 km Rutgers, U.,
Robinson et al. (1993)
PMW Snow water equivalent from Scanning
Multichannel Microwave Radiometer (SMMR, 1978–1987) and the Special Sensor
Microwave/Imager (SSM/I, 1987–2008)
1978–2008 24 km NSIDC, Savoie et al. (2009)
SCE estimates represent an independent source of SCE in-formation that is highly correlated to the NOAA dataset in March and April (see bottom row Table 2) when the snow line is located where the observing network is relatively dense. The B2000 and NOAA datasets were retained as the base series for applying the confidence intervals to maintain the continuity of the series presented in Brown (2000) and the 4th IPCC Assessment, and because there is greater confi-dence in the homogeneity of these series.
3.1 Regression-based estimate of confidence interval
Regression analysis was used to estimate the confidence in-terval from the standard error of forecast (SEf)when there were insufficient datasets to compute a multi-dataset estimate of the confidence interval. SCE series were converted to stan-dardized anomalies with respect to the period of the regres-sion analysis which makes the error analysis insensitive to the choice of dependent and independent variables, and re-duces the computation of SEfin each year to Eq. (1) as the
anomaly series has a standard deviation of 1, and the mean and sum of the anomaly series are both 0.
SEf=SEres
q
[(1+(1/n)(1+xi2)) (1)
where SEres is the standard error of the residuals from the best fit line,xi is the standardized anomaly of the
indepen-dent variable in yeari, andnis the number of pairs of anoma-lies included in the regression analysis. A 95% confidence interval is then obtained from ±tcSEf wheretc is the
Stu-dent’st-statistic corresponding to 0.05 level of significance for n-1 degrees of freedom. An estimate of the root mean squared error in the dependent data was obtained from a stan-dard leave-one-out cross-validation (LOOCV) analysis.
3.2 Multi-dataset estimate of confidence interval
Table 2. Correlation and root mean square differences (rmsd) in
detrended SCE anomalies versus the multi-dataset average anomaly (excluded the dataset being evaluated) in three periods of data over-lap. The units of rmsd are dimensionless (standardized anomalies). The correlations and rmsd (from LOOCV) are also shown for the re-gression analyses used to estimate the confidence interval in B2000 prior to 1967 and for NOAA after 2002. All correlations are statis-tically significant at the 0.05 level.
Dataset overlap period: North America Eurasia
1959–1991 March April March April
r rmsd r rmsd r rmsd r rmsd
B2000 0.87 0.45 0.90 0.41 0.85 0.53 0.78 0.61 ERA-40 0.73 0.67 0.83 0.53 0.86 0.49 0.72 0.68 ERA-40rec 0.81 0.56 0.92 0.37 0.95 0.30 0.91 0.42 NCEP 0.67 0.73 0.77 0.61 0.87 0.50 0.78 0.56
Dataset overlap period: 1979–2002
B2003+CMC 0.95 0.33 0.91 0.38 n/a n/a ERA-40 0.66 0.75 0.84 0.53 0.87 0.40 0.81 0.54 ERA-40rec 0.87 0.48 0.91 0.41 0.89 0.37 0.84 0.45 NCEP 0.72 0.68 0.91 0.39 0.80 0.51 0.91 0.44 NOAA 0.84 0.54 0.90 0.43 0.65 0.65 0.62 0.74 PMW 0.88 0.42 0.86 0.47 0.77 0.60 0.70 0.71
Regression analysis results for B2000 versus multi-dataset for 1967–1992 period
0.94 0.28 0.91 0.34 0.91 0.34 0.84 0.48
Regression analysis results for NOAA versus CMC for 1998–2010 period
0.97 0.22 0.99 0.16 0.98 0.18 0.91 0.43
due to sample size. The datasets available in this period were B2000 (up to 1992), B2003+CMC (NA only from 1979), ERA-40, ERA-40rec, NCEP, NOAA, and PMW. Datasets were converted to standardized anomalies for a 1979–2002 reference period and an estimate of the confidence interval in monthly SCE obtained from the standard error (SE) of the average multi-dataset standardized anomaly series computed from
SE=s/p(n−1) (2)
which depends on the standard deviation,s, of thendatasets included in the average anomaly. The 95% confidence inter-val was then computed from±tc SE as previously defined.
The B2000 series was padded with values estimated from regression against the NOAA dataset for the 1993 to 2002 period to convert the series to anomalies with respect to the 1979–2002 reference period. The error estimates were con-verted back to SCE in units of 106km2using the reference period mean and standard deviation from the NOAA dataset. An evaluation of the degree of consistency between datasets in March-April was carried out as part of the multi-dataset uncertainty analysis over two periods of multi-dataset over-lap: 1959–1991, and 1979–2002. This included the corre-lation and root mean square difference between detrended SCE anomalies for each dataset and the multi-dataset aver-age anomaly series (excluding the dataset being evaluated).
4 Results
4.1 Dataset evaluation
The dataset evaluation results for March and April separated by continent (Table 2) show a clear contrast in dataset consis-tency between the two continents in April with most datasets exhibiting closer agreement over NA than EUR. The NOAA dataset is a case in point; it had the lowest agreement with the multi-dataset average over EUR in March–April in the 1979– 2002 overlap period but had comparable correlations to the other datasets over NA in the same period. The reason for the overall greater dataset consistency over NA is likely related to the more regionally constrained character of the continen-tal snow cover variability compared to EUR which is clearly seen in the principal component analysis of NH SCE vari-ability provided by Frei and Robinson (1999). Other note-worthy points are the generally strong performance of the in situ based estimates of SCE (B2000 and B2003+CMC) and the fact that downscaling SCE from ERA-40 temperature and precipitation provided superior results than SCE derived from ERA-40 snow depth fields. There was no evidence of any systematic trends or step changes in the difference series between NOAA and the multi-dataset average in March and April over the 1967 to 2002 period (not shown), confirming the work by the Rutgers Global Snow Lab to maintain the homogeneity of the NOAA snow cover series.
March
March
April
April %
Fig. 1. Top: spatial pattern of between-dataset variability expressed
as the average annual standard deviation in monthly snow cover anomalies over the 1979–2002 period for five datasets with data in the 1979–2002 overlap period (excluding PMW). The red line shows the mean position of the multi-dataset 50% snow cover con-tour. Bottom: spatial pattern of interannual variability in snow cover over the same period from the standard deviation in monthly snow cover fraction computed with the NOAA dataset. Units are % snow cover fraction.
0.00 0.25 0.50 0.75 1.00 1.25 1.50
1915 1925 1935 1945 1955 1965 1975 1985 1995 2005
95%
co
n
fi
d
en
ce i
n
te
rval
(
s
td
. an
o
m
al
y)
NA March NA April
EUR March EUR April
Fig. 2. Smoothed (13-term binomial filter) values of the 95%
con-fidence interval in standardized SCE anomalies computed from the two methods outlined in Sect. 3.
4.2 Confidence interval
The results of the confidence interval analysis for March and April SCE are shown in Fig. 2 for both continents. The val-ues are smoothed with a 13-term binomial filter to facilitate the comparison, as the estimated confidence intervals from the multi-dataset method can vary greatly from one year to the next. The uncertainty is highest in the period prior to 1967 when the estimate is based solely on the regression analysis and decreases rapidly over the 1970s and 1980s in response to an increase in the number of datasets and in-creased frequency and resolution of snow cover information. The larger confidence interval for Eurasia April SCE is evi-dent reflecting the larger differences between datasets noted previously. The confidence limits are shown in Fig. 3 for NH SCE expressed as percentages of monthly SCE. These range from±5% to±9% for March and April SCE over the early period of record to±3% to±5% over the more recent period of satellite-based observations.
4.3 Analysis of updated SCE series including estimated
confidence interval
The estimated confidence intervals were applied to the merged B2000 and NOAA SCE anomaly series to update the SCE series published in Brown (2000) (Fig. 4). The final NH series were converted to SCE in million km2using the 1979– 2002 reference period mean and standard deviation from the NOAA dataset (Fig. 5). A 13-term binomial filter was ap-plied to remove fluctuations on less than decadal time scales following the approach used in the 4th IPCC Assessment (Trenberth et al., 2007, Appendix 3.A). The updated anomaly series in Fig. 4 show that NA March SCE increased over the first half of the 20th Century followed by a period of rapid decrease in the late-1980s and early-1990s that rebounded slightly during the late-1990s. Over Eurasia, March SCE has remained more or less stable from the 1920s up to the end of the 1980s when SCE underwent a similar rapid step de-crease as NA to lower values that have remained more or less constant since. The NA April SCE series shows some simi-larity to March with the notable point that the 2010 anomaly is the lowest in the 96 yr period (the second warmest April over NA mid-latitudes after 1987 based on air temperature anomalies averaged over 40–60◦N for each continent from the CRUTEM3 dataset (Brohan et al., 2006). Eurasian April SCE differs from NA with more evidence of long-term de-creases over the entire period of record. The rapid reductions in SCE in the late-1980s and early 1990s seen in both conti-nents in March and April coincide with a change in NH circu-lation patterns to more positive values of the North Atlantic and Arctic Oscillations (Watanabe and Nitta, 1999; Overland et al., 1999).
0 1 2 3 4 5 6 7 8 9 10
1922 1932 1942 1952 1962 1972 1982 1992 2002
95% co n fi d en ce i n ter val ( % S C E ) March April
Fig. 3. Smoothed (13-term binomial filter) 95% confidence
inter-vals for NH March and April SCE expressed as a % of the corre-sponding mean SCE.
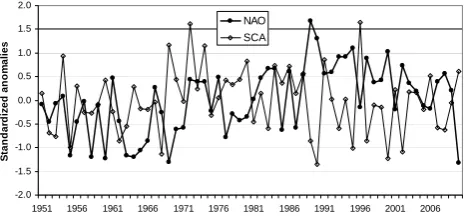
Climate Prediction Center (http://www.cpc.noaa.gov/data/ teledoc/telecontents.shtml) and NH SCE with 21-yr running correlations over the period from 1951–2010 showed evi-dence of an abrupt strengthening of the relationship between the North Atlantic Oscillation (NAO) and NH March SCE around 1980, and an increase in the importance of the Scan-dinavian (SCA) pattern over the period after the mid-1980s (Fig. 6). The SCA pattern (originally referred to as the Eurasia-1 pattern by Barnston and Livezey, 1987) describes the strength of the quasi-permanent ridge of winter high pressure over Scandinavia and northern Europe with posi-tive (negaposi-tive) values of SCA contributing to cold (warm) March temperature anomalies over central Eurasia and to an opposite response over northwestern NA (Fig. 7, top panel). NAO has been shown to be a significant factor in winter precipitation and snow cover variability across western Eu-rope and eastern North America (Gutzler and Rosen, 1992; Clark et al., 1999; Bednorz, 2004; Henderson and Leathers, 2010) and positive (negative) values of NAO contribute to warm (cold) March temperature anomalies over central Eura-sia (Fig. 7, bottom panel) and an opposite albeit weaker re-sponse over NA. Prior to the mid-1980s, NAO and SCA were not significantly correlated but since then the two patterns exhibit a significant negative correlation that reinforces the influence on temperature anomalies. The two patterns have also tended to be in modes that favor warm winter tempera-ture anomalies over Eurasia since 1980 (Fig. 8). The same analysis for April (not shown) revealed similar evidence of an increase in the importance of NAO around 1980 but the correlations were much weaker than March and ceased to be statistically significant after about 1990. There were no sustained significant correlations between April SCE and the SCA index over the 1951–2010 period. While atmospheric circulation may be playing a role in some of the recent SCE decreases, long-term changes in air temperature dominate the hemispheric response of spring SCE with NH mid-latitude air temperatures explaining ∼50% of the variance in NH spring snow cover over the 89-yr period analyzed (Fig. 9).
NA March -4 -3 -2 -1 0 1 2 3 4 5
1915 1925 1935 1945 1955 1965 1975 1985 1995 2005
S C E st d ano m al y ( w rt 1979-2 002) Frei (1999) B2000 NOAA NA April -4 -3 -2 -1 0 1 2 3 4 5
1915 1925 1935 1945 1955 1965 1975 1985 1995 2005
S C E st d an om al y ( w rt 1979-2002) B2000 NOAA EUR March -4 -3 -2 -1 0 1 2 3 4 5
1915 1925 1935 1945 1955 1965 1975 1985 1995 2005
S C E st d ano m al y ( w rt 1979-2 002) B2000 NOAA EUR April -4 -3 -2 -1 0 1 2 3 4 5
1915 1925 1935 1945 1955 1965 1975 1985 1995 2005
S C E st d an o m al y ( w rt 1979-2002) B2000 NOAA
Fig. 4. Variability in NA and EUR March and April SCE anomalies
NH March SCE
32 34 36 38 40 42 44 46
1915 1925 1935 1945 1955 1965 1975 1985 1995 2005
S
C
E
(
m
il
li
o
n
sq km
)
NH April SCE
22 24 26 28 30 32 34 36
1915 1925 1935 1945 1955 1965 1975 1985 1995 2005
S
C
E
(m
illio
n
s
q
k
m
)
Fig. 5. Same as Fig. 4 for NH SCE estimated from the anomaly series using the NOAA 1979–2002 reference period mean and standard deviation (excludes Greenland which averages 2.16×10⁶km2).
-1.0 -0.8 -0.6 -0.4 -0.2 0.0 0.2 0.4 0.6 0.8 1.0
1961 1966 1971 1976 1981 1986 1991 1996
C
o
rre
la
ti
o
n
NAO SCA
Fig. 6. Running 21-yr correlations between the NAO and SCA
modes of NH winter (JFM) circulation and NH March SCE. Cor-relations exceeding 0.4 are nominally significant at a 0.05 level as-suming data series are not autocorrelated.
Results of linear trend analysis including annual estimates of error in SCE are shown in Table 3 for the entire data pe-riod as well as for the more recent pepe-riod of satellite data from 1970, along with corresponding trends in land sur-face air temperatures over 40–60◦N from the CRU dataset. The 2010 updates show greater evidence of systematic de-creases in continental spring SCE than those published in Brown (2000), particularly over NA where April SCE trends are now showing statistically significant decreases over the period from 1915, and an acceleration of SCE decreases over recent decades. SCE decreases over NA in March are still not statistically significant and it is plausible that the SCA and NAO patterns discussed above are playing a role, as these patterns have tended to be in modes since 1980 that contribute to cooler spring temperatures over western NA (Fig. 7).
-SCA
+NAO
Fig. 7. Average March surface air temperature anomalies from the
NCEP reanalysis for the 10 winters in the 1951–2010 period with the most negative values of the SCA index (top) and the most posi-tive values of the NAO index (bottom). The plots were generated us-ing the online composite plottus-ing tool at http://www.esrl.noaa.gov/ psd/cgi-bin/data/composites/printpage.pl.
Table 3. Summary of linear least-squares regression trend analysis results for snow cover extent including annual error estimates. Trends
significant at a 0.05 level are indicated with asterisks. The corresponding least square estimates of temperature trends are included for land areas between 40–60◦N from the CRU dataset.
Region March April
SCE Temp SCE Temp
106km2(100 yr)−1 ◦C(100 yr)−1 106km2(100 yr)−1 ◦C(100 yr)−1 North America
1915–2010 −0.22 1.63* −0.83* 1.23*
1970–2010 −0.77 2.55 −3.77* 2.84*
Eurasia
1922–2010 −3.20* 3.06* −1.17* 2.24*
1970–2010 −4.83* 5.98* −5.33* 3.57*
Northern Hemisphere
1922–2010 −3.24* 2.50* −4.72* 1.87*
1970–2010 −7.26* 4.69* −8.30* 3.30*
-2.0 -1.5 -1.0 -0.5 0.0 0.5 1.0 1.5 2.0
1951 1956 1961 1966 1971 1976 1981 1986 1991 1996 2001 2006
S
tan
d
a
rd
iz
ed
an
o
m
al
ie
s
NAO SCA
Fig. 8. Variation in standardized anomalies of winter
(January-March) values of the NAO and SCA indices over the period from 1951 to 2010 as computed by the NOAA Climate Prediction Cen-ter.
during a period when hemispheric snow cover was relatively high and include the recent period of rapid warming. The ob-served trends in spring SCE are consistent with the obob-served warming (see Table 3) and with evidence of earlier snowmelt and a shift in hydrologic regimes over NH land areas (e.g. Yang et al., 2002; Stewart et al., 2005; Aziz and Burn, 2006; Tan et al., 2011).
The temperature sensitivity values for the updated NH spring SCE series were computed using March and April monthly temperature anomaly series from the CRUTEM3 dataset averaged over NH land areas between 40 and 60◦N following Brown (2000) (Table 4). A least-squares re-gression method was used that included the annual es-timates of observational errors in SCE. The results ob-tained with the updated NH series with annual error esti-mates included are −1.44×10⁶km2◦C−1 (r2=0.50) and
−2.00×10⁶km2◦C−1 (r2=0.49) for March and April
respectively which are similar to the values published in Brown (2000) except that temperature explains a larger frac-tion of the variance with the updated series. The tempera-ture sensitivity results shown in Table 4 suggest that EUR will dominate the NH SCE response to warming in March, while the April response will have important contributions from both continents. The larger temperature sensitivity in April is consistent with the findings of Flanner et al. (2011) that NH terrestrial snow cover feedbacks are strongest in the April–May period.
NH March SCE vs NH March Air Temp 40-60N
30 32 34 36 38 40 42 44 46
-3.0 -2.0 -1.0 0.0 1.0 2.0 3.0
Air temperature anomaly (C)
S
C
E
(
m
illio
n
s
q
. k
m
)
NH April SCE vs NH April Air Temp 40-60N
20 22 24 26 28 30 32 34 36
-2.0 -1.0 0.0 1.0 2.0
Air temperature anomaly (C)
S
C
E
(
m
illio
n
s
q
. k
m
)
Fig. 9. Relationship between NH March and April SCE and
corre-sponding land area air temperature anomalies over 40–60◦N from the CRU dataset. The amount of variation explained by air temper-ature was 49.6% and 48.7% for March and April respectively.
5 Summary and conclusions
An update to the NH spring SCE series used in the 4th IPCC Assessment (Lemke et al., 2007) is provided based on the B2000 index and the latest CDR version of the NOAA weekly SCE dataset with annual error estimates obtained from regression analysis and intercomparison of multiple datasets. The analysis revealed that the 95% confidence in-terval in NH spring SCE is in the±5–10% range over the pre-satellite period and ±3–5% over the satellite era. The multi-dataset analysis indicated there are larger uncertain-ties monitoring spring SCE over Eurasia than NA which is considered to be related in part to the more complex re-gional character of snow cover variability. The between-dataset variability was largest over northern Europe and north-central Russia in March.
Trend analysis of the updated SCE series showed that NH spring snow cover extent has undergone significant reduc-tions over the past∼90 yr and that the rate of decrease has
Table 4. Summary of regression analysis between continental and hemispheric monthly SCE and air temperature anomalies over
land areas between 40–60◦N from the CRU dataset. Units are
106km2◦C−1. The fraction of the variance explained by the regres-sion is shown in parentheses. Statistically significant (0.05 level) values are indicated with a single asterisk while a plus symbol sig-nifies that the 1970–2010 slope is significantly different (0.05 level) from the period prior to 1970.
Region March April
North America
1922–1969 −0.46* (0.38) −0.62* (0.48)
1970–2010 −0.36* (0.32) −0.92*+(0.73)
1922–2010 −0.37* (0.34) −0.81* (0.61)
Eurasia
1922–1969 −0.94* (0.47) −1.49* (0.43)
1970–2010 −0.93* (0.60) −0.94*+(0.45)
1922–2010 −0.91* (0.55) −1.09* (0.49)
Northern Hemisphere
1922–1969 −1.69* (0.51) −2.36* (0.41)
1970–2010 −1.53* (0.46) −1.83* (0.40)
1922–2010 −1.44* (0.50) −2.00* (0.49)
accelerated over the past 40 yr. Warmer temperatures were determined to be the dominant factor in the observed SCE decreases, with air temperature anomalies over NH mid-latitude land areas explaining∼50% of the observed variabil-ity in SCE. However, there was also evidence that changes in atmospheric circulation around 1980 involving the NAO and the SCA pattern were enhancing reductions in March SCE over Eurasia. The rate of decrease in March and April NH SCE over the 1970–2010 period is∼0.8 million km2per decade which corresponds to a 7% and 11% decrease in NH March and April SCE respectively from pre-1970 values. In March, most of the change is being driven by Eurasia (NA trends are not significant) but both continents exhibit signifi-cant reductions in April SCE. Evidence of recent contrasting changes in SCE temperature sensitivity over NA and EUR in April (NA increasing, EUR decreasing) may be a response to the northward shift in snowlines and/or continental dif-ferences in winter snow accumulation trends; further work is needed to more clearly understand the mechanisms in-volved in these differing continental snow cover responses to a changing climate.
Supplementary material (SCE time series) related to this article is available online at:
Acknowledgements. The authors thank Mary-Jo Brodzik (NSIDC)
for supplying the PMW dataset and Bruce Brasnett (CMC)
for the CMC global daily snow depth analysis. ECMWF is
acknowledged for providing the ERA-40 data used in this study through the ECMWF data server (http://data.ecmwf.int/data/). NCEP data were provided by the Physical Sciences Division, Earth System Research Laboratory, NOAA, Boulder, Colorado (http://www.esrl.noaa.gov/psd/). Chris Derksen (Env. Canada) and Gina R. Henderson (Rutgers University) are gratefully acknowl-edged for helpful comments on the draft manuscript. D. Robinson acknowledges funding support from NASA MEaSURES award NNX08AP34A and NOAA Climate Program Office awards
EA133E10SE2623 and NA08AR4310678. Cathy Smith of the
NOAA Earth System Research Laboratory is acknowledged for her work in developing and maintaining the online analysis and plotting tools for NCEP Reanalysis output.
Edited by: S. Dery
References
Armstrong, R. L. and Brodzik, M. J.: Recent Northern Hemisphere snow extent: a comparison of data derived from visible and mi-crowave sensors, Geophys. Res. Lett., 28, 3673–3676, 2001. Arndt, D. S., Baringer, M. O., and Johnson, M. R.: State of
the Climate in 2009, B. Am. Meteorol. Soc., 91, S1–S222, doi:10.1175/BAMS-91-7-StateoftheClimate, 2010.
Aziz, O. I. A. and Burn, D. H.: Trends and variability in the hy-drological regime of the Mackenzie River Basin, J. Hydrol., 319, 282–294, doi:10.1016/j.jhydrol.2005.06.039, 2006.
Barnston, A. G. and Livezey, R. E.: Classification, seasonality and persistence of low-frequency atmospheric circulation patterns, Mon. Weather Rev., 115, 1083–1126, 1987.
Bednorz, E.: Snow cover in Eastern Europe in relation to tempera-ture, precipitation and circulation, Intl. J. Climatol., 24, 591–601, 2004.
Brasnett, B.: A global analysis of snow depth for numerical weather prediction, J. Appl. Meteorol., 38, 726–740, 1999.
Brohan, P., Kennedy, J. J., Harris, I., Tett, S. F. B., and Jones, P. D.: Uncertainty estimates in regional and global observed tempera-ture changes: a new dataset from 1850, J. Geophys. Res., 111, D12106, doi:10.1029/2005JD006548, 2006.
Brown, R. D. and Braaten, R. O.: Spatial and temporal variability of Canadian monthly snow depths, 1946–1995, Atmos.-Ocean, 36, 37–45, 1998.
Brown, R. D.: Northern Hemisphere snow cover variability and change, 1915–1997, J. Climate, 13, 2339–2355, 2000.
Brown, R. D., Brasnett, B., and Robinson, D.: Gridded North Amer-ican monthly snow depth and snow water equivalent for GCM evaluation, Atmos.-Ocean, 41, 1–14, 2003.
Brown, R. D. and Frei, A.: Comment on “Evaluation of surface albedo and snow cover in AR4 coupled models” by Roesch, A., J. Geophys. Res., 112, D22102, doi:10.1029/2006JD008339, 2007.
Brown, R., Derksen, C., and Wang, L.: A multi-data set
analysis of variability and change in Arctic spring snow cover extent, 1967–2008, J. Geophys. Res., 115, D16111, doi:10.1029/2010JD013975, 2010.
Bulygina, O. N., Razuvaev, V. N., and Korshunova, N. N.: Changes in snow cover over Northern Eurasia in the last few decades, En-viron. Res. Lett., 4, 045026, doi:10.1088/1748-9326/4/4/045026, 2009.
Clark, M. P, Serreze, M. C., and Robinson, D. A.: Atmospheric controls on Eurasian snow cover extent, Intl. J. Climatol., 19, 27–40, 1999.
Fernandes, R., Zhao, H., Wang, X., Key, J., Qu, X., and Hall, A.: Controls on Northern Hemisphere snow albedo feedback quan-tified using satellite Earth observations, Geophys. Res. Lett., 36, L21702, doi:10.1029/2009GL040057, 2009.
Flanner, M. G., Shell, K. M., Barlage, M., Perovich, D. K., and Tschudi, M. A.: Radiative forcing and albedo feedback from the Northern Hemisphere cryosphere between 1979 and 2008, Nat. Geosci., 4, 151–155, doi:10.1038/ngeo1062, 2011.
Foster, J., Liston, G., Koster, R., Essery, R., Behr, H., Dumenil, L., Verseghy, D., Thompson, S., Pollard, D., and Cohen, J.: Snow cover and snow mass intercomparisons of general circulation models and remotely sensed datasets, J. Climate, 9, 409–426, 1996.
Frei, A. and Robinson, D. A.: Northern Hemisphere snow extent: regional variability 1972–1994, Intl. J. Climatol., 19, 1535–1560, 1999.
Frei, A., Hughes M. G., and Robinson, D. A.: North American snow extent: 1910–1994, Intl. J. Climatol., 19, 1517–1534, 1999. Frei, A., Brown, R., Miller, J. A., and Robinson, D. A.: Snow
mass over North America: observations and results from the sec-ond phase of the Atmospheric Model Intercomparison Project (AMIP-2), J. Hydrometeorol., 6, 681–695, 2005.
Gutzler, D. S. and Rosen, R. D.: Interannual variability of winter-time snow cover across the Northern Hemisphere, J. Climate, 5, 441–1447, 1992.
Hall, A. and Qu, X.: Using the current seasonal cycle to constrain snow albedo feedback in future climate change, Geophys. Res. Lett., 33, L03502, doi:10.1029/2005GL025127, 2006.
Helfrich, S. R., McNamara, D., Ramsay, B. H., Baldwin, T., and Kasheta, T.: Enhancements to, and forthcoming developments in the Interactive Multisensor Snow and Ice Mapping System (IMS), Hydrol. Proc., 21, 1576–1586, 2007.
Henderson, G. and Leathers, D.: European snow cover extent vari-ability and associations with atmospheric forcings, Intl. J. Clima-tol., 30, 1440–1451. doi:10.1002/joc.1990, 2010.
Kalnay, E., Kanamitsu, M., Kistler, R., Collins, W., Deaven, D., Gandin, L., Iredell, M., Saha, S., White, G., Woollen, J., Zhu, Y., Chelliah, M., Ebisuzaki, W., Higgins, W., Janowiak, J., Mo, K. C., Ropelewski, C., Wang, J., Leetmaa, A., Reynolds, R., Jenne, R., and Joseph, D.: The NCEP/NCAR Reanalysis Project, Bull. Am. Met. Soc., 77, 437–471, 1996.
Kitaev, L., Førland, E., Razuvaev, V., Tveito, O. E., and Krueger, O.: Distribution of snow cover over Northern Eurasia, Nord. Hydrol., 36, 311–319, 2005.
Cam-bridge, United Kingdom and New York, NY, USA, 2007. McCabe, G. J. and Wolock, D. M.: Long-term variability in
North-ern Hemisphere snow cover and association with warmer win-ters, Climatic Change, 99, 141–153, 2010.
Overland, J. E., Adams, J. M., and Bond, N. A.: Decadal variability of the Aleutian Low and its relation to high-latitude circulation, J. Climate, 12, 1542–1548, 1999.
Ramsay, B.: The interactive multisensor snow and ice mapping sys-tem, Hydrol. Proc., 12, 1537–1546, 1998.
Robinson, D. A., Dewey, K. F., and Heim, R. R.: Global snow cover monitoring: an update, Bull. Am. Met. Soc., 74, 1689– 1696, 1993.
Roesch, A.: Evaluation of surface albedo and snow cover in AR4 coupled climate models, J. Geophys. Res., 111, D15111, doi:10.1029/2005JD006473, 2006.
Savoie, M. H., Armstrong, R. L., Brodzik, M. J., and Wang, J. R.: Atmospheric corrections for improved passive microwave snow cover retrievals over the Tibet Plateau, Rem. Sens. Environ., 113, 2661–2669, 2009.
Shmakin A. B.: Climatic characteristics of snow cover over North Eurasia and their change during the last decades, Ice and Snow, 1, 43–57, 2010 (in Russian with English summary).
Stewart, I. T., Cayan, D. R., and Dettinger, M. D.: Changes toward earlier streamflow timing across western North America, J. Cli-mate, 18, 1136–1155, 2005.
Tan, A., Adam, J. C., and Lettenmaier, D. P.: Change in spring snowmelt timing in Eurasian Arctic Rivers, J. Geophys. Res., 116, D03101, doi:10.1029/2010JD014337, 2011.
Trenberth, K. E., Jones, P. D., Ambenje, P., Bojariu, R., Easterling, D., Tank, A. K., Parker, D., Rahimzadeh, F., Renwick, J. A., Rusticucci, M., Soden, B., and Zhai, P.: Observations: Surface and Atmospheric Climate Change, in: Climate Change 2007: The Physical Science Basis. Contribution of Working Group I to the Fourth Assessment Report of the Intergovernmental Panel on Climate Change, edited by: Solomon S, Qin, D., Manning, M., Chen, Z., Marquis, M., Averyt, K. B., Tignor, M., and Miller, H. L., Cambridge University Press, Cambridge, United Kingdom and New York, NY, USA, 2007.
Uppala, S. M., K˚allberg, P. W., Simmons, A. J., Andrae, U., da Costa Bechtold, V., Fiorino, M., Gibson, J. K., Haseler, J., Her-nandez, A., Kelly, G. A., Li, X., Onogi, K., Saarinen, S., Sokka, N., Allan, R. P., Andersson, E., Arpe, K., Balmaseda, M. A., Beljaars, A. C. M., van de Berg, L., Bidlot, J., Bormann, N., Caires, S., Chevallier, F., Dethof, A., Dragosavac, M., Fisher, M., Fuentes, M., Hagemann, S., H´olm, E., Hoskins, B. J., Isak-sen, L., JansIsak-sen, P. A. E. M., Jenne, R., McNally, A. P., Mahfouf, J.-F., Morcrette, J.-J., Rayner, N. A., Saunders, R. W., Simon, P., Sterl, A., Trenberth, K. E., Untch, A., Vasiljevic, D., Viterbo, P., and Woollen, J.: The ERA-40 re-analysis, Quart. J. R. Meteorol. Soc., 131, 2961–3012, doi:10.1256/qj.04.176, 2005.
Watanabe, M. and Nitta, T.: Decadal changes in the atmospheric cir-culation and associated surface climate variations in the northern hemisphere winter, J. Climate, 12, 494–510, 1999.