Article
On the Impact of Microsegregation Model on the
Thermophysical and Solidification Behaviors of a
Large Size Steel Ingot
Chunping Zhang1,*, Mohammad Jahazi1and Paloma Isabel Gallego2
1 École de Technologie Supérieure, 1100 Notre-Dame Street West, Montreal, QC H3C 1K3, Canada;
Mohammad.Jahazi@etsmtl.ca
2 Finkl Steel-Sorel, 100 McCarthy Street, Saint-Joseph-de-Sorel, QC J3R 3M8, Canada; p.gallego@finkl.com
* Correspondence: chunping.zhang.1@gmail.com; Tel.:+1-514-396-8800-7868
Received: 29 October 2019; Accepted: 24 December 2019; Published: 2 January 2020
Abstract:The impact of microsegregation models on thermophysical properties and solidification behaviors of a high strength steel was investigated. The examined microsegregation models include the classical equilibrium Lever rule, the extreme non-equilibrium Scheil-Gulliver, as well as other treatments in the intermediate regime proposed by Brody and Flemings, Clyne and Kurz, Kobayashi and Ohnaka. Based on the comparative analyses performed on three representative regions with varied secondary dendrite arm spacing sizes, the classical equilibrium Lever rule and non-equilibrium Scheil scheme were employed to determine the thermophysical features of the studied steel, using the experimentally verified models from literature. The evaluated thermophysical properties include effective thermal conductivity, specific heat capacity and density. The calculated thermophysical data were used for three-dimensional simulation of the casting and solidification process of a 40 metric ton steel ingot, using FEM code Thercast®. The simulations captured the full filling, the thermo-mechanical phenomena and macro-scale solute transport in the cast ingot. The results demonstrated that Lever rule turned out to be the most reasonable depiction of the physical behavior of steel in study in large-size cast ingot and appropriate for the relevant macrosegregation simulation study. The determination of the model was validated using the experimentally measured top cavity dimension, the thermal profiles on the mold outside surface by means of thermocouples, and the carbon distribution patterns via mass spectrometer analysis.
Keywords: steel; large size ingot; casting simulation; thermo-physical properties; microsegregation model; solidification behavior; macrosegregation
1. Introduction
Ingot casting is the only method for the production of large size mono-block medium-carbon high strength steels to meet the increasing demands from the energy and transportation industries. Solidification of large-size ingots generates non-homogeneous distribution of the alloying elements at the scale of the product, called macrosegregation. From a practical viewpoint, the nature and extent of the macrosegregation [1], accompanied with the ratio of the columnar to equiaxed structure [2], determines the quality of the final product. The presence of macrosegregation results in inconsistent transformation products (i.e., martensite, bainite) during subsequent hot working and further plastic deformation [3], and causes nonuniformity in mechanical properties of the finished product. To elucidate the controlling mechanisms of the formation and development of macrosegregation, extensive studies have been conducted using finite element modeling (FEM), the most economical approach. However, the predictive reliability of the solute transport model significantly depends on the accuracy of the
Metals2020,10, 74 2 of 17
prescribed thermophysical properties. The latter is closely associated with dendritic microsegregation models [4,5]. It is the microsegregation of elements on the dendritic scale that leads to the enrichment and paucity of the liquid and macroscale segregation of chemical species, through thermo-solutal convection currents in the course of ingot solidification. Therefore, the selection of microsegregation model is of utmost significance for the accuracy of any macrosegregation predictions [4].
So far, due to the enormous computation burden, the microsegregation models used in the macroscopic solute transport works have largely been based on the classical equilibrium Lever rule model (infinite diffusion in solid) and non-equilibrium Scheil treatment (null diffusion in solid) [6–10]. In reality, microsegregation in steels often falls into the intermediate area between the two extreme cases, which are characterized by incomplete solute diffusion in the solid. That is due to the mixture of interstitial and substitutional elements present in steel and the range of solidification times given by various casting processes [1]. Moreover, simple microsegregation models often assume a fixed dendrite arm spacing [11]. It is known that there is an important variation of dendrite arm spacing in a large-size cast ingot, resulting from large temperature and concentration difference present in the system [12]. It appears that an increase in the dendritic arm spacing increases the permeability of the mushy zone [13], and thus can influence the thermophysical features. Hence, the selection of appropriate microsegregation models in different regions in the casting system of interest may be well dependent on the local temperature, concentration and the resulting dendrite arm spacing. Therefore, there is a need to make a sensitivity analysis to assess the influence of microsegregation models on thermophysical features, and their dependence on local dendritic arm spacings at various locations of the cast ingot.
The objective of the present work is to investigate the effect of microsegregation model selection on thermophysical properties and solidification behavior of a medium-carbon high strength steel. For this, notable analytical or semi-analytical models of solute redistribution problem will first be considered. These include the ideal equilibrium Lever rule [6], the extreme non-equilibrium Scheil-Gulliver treatment [7], as well as other analyses in the intermediate regime between the two extreme cases, such as those proposed by Brody and Flemings [14], Clyne and Kurz [15], Kobayashi and Ohnaka [16].
These microsegregation models were then applied to determine thermophysical properties in three regions of a 40MT (metric ton) cast high strength steel ingot. The three specified regions (each occupying 4.5×6.5 cm2) were selected on the centerline cross section along the radius of the ingot 30 cm below
the hot-top/ingot body interface. They were located in the ingot wall side, radial midway and center, with varied typical SDAS (secondary dendrite arm spacing), representing typical dendritic structures which formed in the initial, intermediate and final stages of the solidification process. The calculated thermophysical properties were used for three-dimensional simulations of the solidification process of the 40MT steel ingot, using Thercast®FEM code (Version 8.2, Transvalor S.A., Sophia Antipolis CEDEX, France) [17]. The simulations were carried out for each of the microsegregation models, and captured the full filling, the thermo-mechanical phenomena and macro-scale solute transport in the casting ingot. The reliability of the model was validated using the experimentally measured top cavity dimension, the thermal profiles on the outside of the mold surface using thermocouples, and the carbon distribution profile via mass spectrometer analysis. On the basis of the obtained results, the microsegregation model that best predicts macrosegregation was identified. The present work reveals the importance of the solid back diffusion in the solidification behavior of large size ingot. The findings could contribute to a better understanding of the underlying mechanisms responsible for the occurrence of macrosegregation in the casting process of large size ingot.
2. Microsegregation Models
concentration at the advancing solid/liquid interface,ωS, and the solid fraction,fS. Solute diffusion in the solid depends on the value of the dimensionless back-diffusion Fourier numberα[11]:
α=DStf/L2 (1)
whereDSis the diffusivity of solute element in the solid phase (µm/s),tfis the diffusion time (local solidification time) (s) andLis the length scale of the microsegregation domain (usually taken as half of secondary dendrite arm spacingd2) (µm).
For a high value ofα, the solid-mass diffusivity of carbon is assumed to be so intense that the composition is always uniform within each phase (i.e., the system is always in thermodynamic equilibrium). Then the solidification behavior is described by the classical Lever rule [6]. For a small α, the diffusion in the solid can be ignored, which is opposite to the Lever rule and described by Scheil-Gulliver or Scheil equation [7]. The reality, however, is expected to lie somewhere between the above two extremes, depending on the importance of solid state diffusion. Therefore, various models have been put forward to quantify the effect of solid state diffusion for the intermediate states between the Scheil and Lever rule cases. For them, the following assumptions are made [15]:
1. Straight liquidus and solidus lines of the concerned phase diagram (i.e., a constant partition coefficientkconnecting the slope of solidus and liquidus together);
2. A constant diffusion coefficient;
3. A plate-like or cylindrical dendrite geometry;
4. A single phase in the solid (an abrupt occurrence ofδ-ferrite/γ-austenite transformation);
5. A parabolic (v= qt/tf) or linear local solid/liquid interface advance velocity (v=L/tf). Brody-Flemings presented a decreasing parabolic model, based on one-dimensional solute redistribution, for the solid/liquid interface advance [14]. Clyne-Kurz model modified the Brody-Flemings equations by introducing a parameter, Ω (α), to be substituted for α, in order to limit the errors introduced by the geometrical simplifications. Kobayashi and Ohnaka proposed an extended mathematical model, incorporating a thermal model of solidification into the analysis, and solved more rigorously the Brody-Flemings model [16]. The equations regarding all above microsegregation models are summarized in Table1.
Table 1.Microsegregation models and equations.
Microsegregation Model Solute Concentration at the
Solid/Liquid InterfaceωS Solid FractionfS
Lever Rule ωS=kω0/(1−fS) +k fS fS=1/(1−k) n
(TL−T)/
Tf−T
o
Scheil-Gulliver Model ωS=kω0(1−fS)k
−1
fS=1− n
Tf−T
/Tf−TL o1/(k−1)
Brody-Flemings Model ωS=kω01−(1−2αk)fS (k
−1)/(1−2αk) fS=
1
(1−2αk)
1−hTf−T/Tf−TLi(1
−2αk)/(k−1)
Clyne-Kurz Model ωS=kω01−(1−2Ωk)fS (k
−1)/(1−2Ωk) fS=
1
(1−2Ωk)
1−hT
f−T
/Tf−TLi(1−2Ωk)/(k−1)
Kobayashi-Ohnaka Model ωS=kω01−[1−2αk/(1+2α)]fSη
fS=
(1+2α) (1+2α−2αk)
1−hT
f−T
/Tf−TLi1/η
In the above table,ω0is the original composition (wt.%),kis the partition coefficient,Tis the system temperature (K),TLis the liquidus temperature (K),Tfis the melting temperature for pure iron (K). For Clyne-Kurz and Kobayashi-Ohnaka models,
Ω=α
1−exp
−1
α
−1
2 exp
− 1
2α
Metals2020,10, 74 4 of 17
η= (k−1)(1+2α)/(1+2α−2αk) (3)
3. Material and Methods
3.1. Experimental and Modeling Processes
A 40 metric tons (MT) cylindrical shape steel ingot was cast at 1570◦C with a filling time of 30 min. During the casting process, the molten steel, with the chemical composition listed in Table2, was bottom poured into a big-end-up cast iron mold 250 cm in height, 150 cm in mean diameter, and hot-topped above 70 cm in height.
Table 2.Chemical composition of the investigated steel and regions (wt.%).
Steel/Regions C Si Mn S Cr Mo P Ni Fe
Nominal 0.36 0.4 0.85 0.0023 1.82 0.45 0.01 0.16 Balance Region 1 0.37 0.4 0.86 0.001 1.92 0.44 0.013 0.17 Balance Region 2 0.38 0.4 0.86 0.001 1.93 0.45 0.014 0.17 Balance Region 3 0.44 0.42 0.86 0.001 1.89 0.44 0.015 0.17 Balance
After solidification and stripping out, as shown in Figure1a, the centerline cross section (the grey face in Figure1b) of the hot-top and 30 cm thick section of the ingot’s main body were chemically characterized using the Thermo Scientific ARLTM4460 mass spectrometer (Thermo Fisher Scientific Inc., Waltham, MA, USA). Then three regions were selected along the radius of the ingot in the section 30 cm below the hot-top/ingot body interface. They were located in the ingot wall side, radial midway and center (Regions 1, 2 and 3 in Figure1b), representing the solidified regions in the initial, intermediate and final stages of the solidification process. This section was chosen to reduce the effect of defects encountered in the hot-top, which could influence dendrite evolutions [18]. The axial faces of the three regions were first chemically characterized with the Thermo Scientific ARLTM4460 mass spectrometer. They were then polished and etched in Oberhoffer’s solution (100 cm3H
2O+100 cm3alcohol+3 cm3 HCl+0.2 g CuCl2·2H2O+3 g FeCl3·6H2+0.1 g SnCl2·2H2O) for metallographic examination using a binocular microscope. Secondary dendrite arm spacing (SDAS,d2) was measured on the obtained micrographs using ImageJ software (National Institutes of Health and the Laboratory for Optical and Computational Instrumentation, Madison, WI, USA) [19]. The determined SDAS was an average value of repeated measurements in at least 5 different areas.
Metals 2019, 9, x FOR PEER REVIEW 4 of 17
3.1. Experimental and Modeling Processes
A 40 metric tons (MT) cylindrical shape steel ingot was cast at 1570 °C with a filling time of 30 min. During the casting process, the molten steel, with the chemical composition listed in Table 2, was bottom poured into a big-end-up cast iron mold 250 cm in height, 150 cm in mean diameter, and hot-topped above 70 cm in height.
Table 2. Chemical composition of the investigated steel and regions (wt.%).
Steel/Regions C Si Mn S Cr Mo P Ni Fe
Nominal 0.36 0.4 0.85 0.0023 1.82 0.45 0.01 0.16 Balance Region 1 0.37 0.4 0.86 0.001 1.92 0.44 0.013 0.17 Balance Region 2 0.38 0.4 0.86 0.001 1.93 0.45 0.014 0.17 Balance Region 3 0.44 0.42 0.86 0.001 1.89 0.44 0.015 0.17 Balance
After solidification and stripping out, as shown in Figure 1a, the centerline cross section (the grey face in Figure 1b) of the hot-top and 30 cm thick section of the ingot’s main body were chemically characterized using the Thermo Scientific ARLTM 4460 mass spectrometer (Thermo Fisher Scientific Inc., Waltham, MA, USA). Then three regions were selected along the radius of the ingot in the Section 30 cm below the hot-top/ingot body interface. They were located in the ingot wall side, radial midway and center (Regions 1, 2 and 3 in Figure 1b), representing the solidified regions in the initial, intermediate and final stages of the solidification process. This section was chosen to reduce the effect of defects encountered in the hot-top, which could influence dendrite evolutions [18]. The axial faces of the three regions were first chemically characterized with the Thermo Scientific ARLTM 4460 mass spectrometer. They were then polished and etched in Oberhoffer’s solution (100 cm3 H2O + 100 cm3 alcohol + 3 cm3 HCl + 0.2 g CuCl2·2H2O + 3 g FeCl3·6H2 + 0.1 g SnCl2·2H2O) for metallographic examination using a binocular microscope. Secondary dendrite arm spacing (SDAS, d2) was
measured on the obtained micrographs using ImageJ software (National Institutes of Health and the Laboratory for Optical and Computational Instrumentation, Madison, WI, USA) [19]. The determined SDAS was an average value of repeated measurements in at least 5 different areas.
(a) (b)
Figure 1. (a) The 40 MT cast ingot after stripping out of the mold; (b) three regions subjected to chemical and microstructure characterizations.
In the simulation work, a 3D model was constructed using the commercial finite element (FE) code Thercast® (Version 8.2, Transvalor S.A., Sophia Antipolis Cedex, France) [17] based on accurate axisymmetric geometries of the above-mentioned steel ingot and casting tools in the experiment. The boundary conditions were set to reproduce actual casting practice. The FE modeling of the casting and solidification processes of the 40 MT steel ingot were stopped when the entire casting completely solidified (i.e., around 700 °C for all the calculated micromodels). For both the experiments and simulations, temperature evolutions on the outside surface of the mold were monitored using thermocouples (TC, for experimental process) and sensors (SN, for modeling) at specific locations 2.5 cm from the mold exterior surface, for comparison and validation purposes, as shown in Figure 2. The floating or settling of equiaxed crystals in the melt and the thermomechanical deformation of the mold were not considered in the model to reduce computational cost. Other details related to
Figure 1.(a) The 40 MT cast ingot after stripping out of the mold; (b) three regions subjected to chemical and microstructure characterizations.
thermocouples (TC, for experimental process) and sensors (SN, for modeling) at specific locations 2.5 cm from the mold exterior surface, for comparison and validation purposes, as shown in Figure2. The floating or settling of equiaxed crystals in the melt and the thermomechanical deformation of the mold were not considered in the model to reduce computational cost. Other details related to macrosegregation model establishment and experimental processes can be found in references [20,21].
Metals 2019, 9, x FOR PEER REVIEW 5 of 17
macrosegregation model establishment and experimental processes can be found in references [20,21].
Figure 2. The used 3D model and the installation positions of thermocouples (TC) for experiment and sensors (SN) for simulations.
3.2. Determination of Fourier Number
The Fourier numbers for the three representative regions were determined via Equation (1), which relates the diffusivity of carbon in austenite 𝐷𝑆 (in cm2/s) to the local solidification time tf (in s) and the local measured SDAS d2 (in μm). The diffusivity of carbon in austenite was taken as a mean diffusivity over the freezing interval from the expression [22]:
𝐷𝑆= 𝐷0× exp (− 𝑄
𝑅𝑇), (4)
where D0 is the frequency factor of 0.0761 cm2/s, Q is the diffusion activation energy of 32,160 cal/mol,
R is gas constant of 1.987 cal/mol·K, and T is the temperature in Kelvin.
The local solidification time tf (in s) was determined using Won’s empirical expression for low-alloy steels with 0.15 wt.% < ωC < 0.6 wt.% [11]:
𝑑2(𝜇𝑚) = 143.9 × 𝐶𝑅−0.3616× 𝜔𝐶
(0.5501−1.996 𝜔𝐶)= 143.9 × (𝑇𝐿− 𝑇𝑆 𝑡𝑓 )
−0.3616
× 𝜔𝐶(0.5501−1.996 𝜔𝐶) (5)
where CR is the cooling rate (°C/s) and ωC is the carbon content (wt.% C). The liquidus TL (°C) and solidus TS (°C) of each region were calculated in terms of local chemical composition using the computational thermodynamics program ThermoCalc® with TCFE7 steel/Fe-alloy database [23].
3.3. Determination of Thermodynamic Properties
The temperature dependence of solid fraction (fS) was determined using the equations correlated to different microsegregation models, as given in Table 1. The effective thermal conductivity (λ), specific heat capacity (CP) and density (ρ) of the heterogeneous mixture of -ferrite, -austenite and liquid in the mushy state of the studied regions were calculated with the phase fractions and properties of each phase in the mushy state from the equations in references [22,24].
The effective thermal conductivity (𝜆) was calculated as a function of temperature (T), carbon content (𝜔𝐶) and phase fraction (f), following Meng’s equations [22]. The model was proposed by
applying regression analysis to the experimental thermal conductivity data compilation. Figure 2.The used 3D model and the installation positions of thermocouples (TC) for experiment and sensors (SN) for simulations.
3.2. Determination of Fourier Numberα
The Fourier numbersαfor the three representative regions were determined via Equation (1), which relates the diffusivity of carbon in austeniteDS(in cm2/s) to the local solidification timetf(in s) and the local measured SDASd2(inµm). The diffusivity of carbon in austenite was taken as a mean diffusivity over the freezing interval from the expression [22]:
DS =D0×exp
−Q
RT
, (4)
whereD0is the frequency factor of 0.0761 cm2/s,Qis the diffusion activation energy of 32,160 cal/mol, Ris gas constant of 1.987 cal/mol·K, andTis the temperature in Kelvin.
The local solidification timetf(in s) was determined using Won’s empirical expression for low-alloy steels with 0.15 wt.%<ωC<0.6 wt.% [11]:
d2(µm) =143.9×C −0.3616
R ×ω
(0.5501−1.996ωC)
C =143.9×
TL−TS
tf
!−0.3616
×ω(0.5501−1.996ωC)
C (5)
whereCRis the cooling rate (◦C/s) andωCis the carbon content (wt.% C). The liquidusTL(◦C) and solidusTS (
◦
C) of each region were calculated in terms of local chemical composition using the computational thermodynamics program ThermoCalc®with TCFE7 steel/Fe-alloy database [23].
3.3. Determination of Thermodynamic Properties
Metals2020,10, 74 6 of 17
The effective thermal conductivity (λ) was calculated as a function of temperature (T), carbon content (ωC) and phase fraction (f), following Meng’s equations [22]. The model was proposed by applying regression analysis to the experimental thermal conductivity data compilation.
λ= fαλα+fδλδ+ fγλγ+fLλL
λα=80.91−9.9269×10⁻²T+4.613×10⁻⁵T21−a1(ωC)a2
λδ=20.14−9.313×10⁻³T1−a1(ωC)a2
λγ=21.6+8.35×10⁻³T
λL =39
a1=0.425−4.385×10⁻⁴T a2=0.209+1.09×10⁻³T
(6)
wherefα,fδ,fγandfLare the volume fractions ofα-ferrite,δ-ferrite,γ-austenite and liquid, respectively. The density (ρin kg/m3) was expressed as a heterogeneous phase mixture containing liquid (L), ferrite (α/δ) and austenite (γ) [24]:
ρ= 1
fL ρL+
fα ρα+ρδfδ+ργfγ
ρL=8319.49−0.835T+ (−83.19+0.00835T)ωC+ (−53.58+0.00515T)ωSi
+(−17.21+0.00135T)ωMn+ (−14.77+0.00535T)ωCr
+(10.21+0.00835T)ωMo+ (12.72−0.00325T)ωNi
ρα=ρδ=7875.96−0.297T−5.62×10⁻⁵T2+−206.35+0.00778T+1.472×10⁻⁶T2ωC −36.86ωSi−7.24ωMn+−8.58+1.229×10⁻³T+0.852×10⁻⁷T2+0.018367ωCrωCr
+30.78ωMo+−0.22−0.47×10⁻³T−1.855×10⁻⁷T2+0.104608ωNiωNi
ργ=8099.79−0.506T+ (−118.26+0.00739T)ωC−68.24ωSi−6.01ωMn
+−7.59+3.422×10⁻³T−5.388×10⁻⁷T2−0.014271ωCrωCr+12.45ωMo
+1.54+2.267×10⁻³T−11.26×10⁻⁷T2+0.062642ωNiωNi
(7)
where temperatureTis in◦C, and solute contents are given in wt.%
In the same way, specific heat was determined using the following equations [22]:
Cp=Cpαfα+Cpδfδ+Cpγfγ+CpLfL
Cpα=
504.8146−0.1311139T−5.1875834×10⁶T−2+4.486659×10⁻⁴T2(f or T≤800K) −4720.324+4.583364T+1.109483×10⁹T−2 (f or800K<T≤1000K)
−11501.07+12.476362T(f or1000K<T≤1042K)
34871.21−32.0268T (f or1042K<T≤1060K)
−10068.18+5.9868T+5.217657×10⁹T (f or1060K<T≤1184K)
Cpδ=441.3942+0.17744236T Cpγ=429.8495+0.1497802T
CpL=824.6157
(8)
where temperatureTis in K. 4. Results and Discussions
4.1. SDAS and Back-Diffusion Parameter
weaker extent. Based on chemical compositions, the solidus and liquidus temperatures, corresponding to each position, were determined and given in Table3. It can be seen that stronger segregated regions are accompanied with lower phase transformation temperatures, including the liquidus and solidus. The temperature difference between liquidus and solidus present, in contrast, a progressive augmentation with the increase of segregation intensity and SDAS.
Table 3.Calculated parameters for the investigated regions.
Region TS(◦C) TL(◦C) d2(µm) tf(s) α
1 1428.5 1493.1 366 509 10.57
2 1426.5 1492.8 474 1017 12.60
3 1414.2 1486.7 536 1307 12.66
Figure3presents the optical micrographs observed on the three selected regions. Analyses on these micrographs revealed SDAS values (d2) of 366µm in the periphery of the ingot, 474µm in the
1
2radius position and 536µm in the ingot center. A Scheme was added to Figure3b to illustrate the method to determine the SDAS values. Based on the measured SDAS, local solidification time for each case was calculated using Equation (5). The results were added to Table3. It can be seen that the evolution of solidification time with the SDAS is in agreement with the reports in the literature that higher SDAS is correlated with longer solidification time [25].
Metals 2020, 10, x FOR PEER REVIEW 7 of 17
Table 3. Calculated parameters for the investigated regions.
Region TS (°C) TL (ᵒC) d2 (μm) tf (s) α
1 1428.5 1493.1 366 509 10.57
2 1426.5 1492.8 474 1017 12.60
3 1414.2 1486.7 536 1307 12.66
Figure 3 presents the optical micrographs observed on the three selected regions. Analyses on these micrographs revealed SDAS values (d2) of 366 μm in the periphery of the ingot, 474 μm in the
½ radius position and 536 μm in the ingot center. A Scheme was added to Figure 3b to illustrate the method to determine the SDAS values. Based on the measured SDAS, local solidification time for each case was calculated using Equation (5). The results were added to Table 3. It can be seen that the evolution of solidification time with the SDAS is in agreement with the reports in the literature that higher SDAS is correlated with longer solidification time [25].
(a) (b) (c)
Figure 3. Micrographs of the three studied regions on the axial face along the section of 30 cm below the hot-top/casting body separation interface: (a) Region 1 in the periphery (d2 = 366 μm); (b) region 2
in the ½ radius position (d2 = 474 μm); (c) region 3 in the center (d2 = 536 μm).
With the measured SDAS (d2), the determined diffusion coefficient DS based on Equation (4) and
the calculated local solidification time (tf), Fourier number α values were calculated using Equation
(1) and given in Table 3. It was revealed that with the increase of the dendritic arm spacing and the local freezing time from the ingot wall side chill zone to the center, the value of Fourier number α increased along the radius of the 40 MT ingot.
4.2. Impact of Microsegregation Model on Thermophysical Properties
Figure 4 gives the dependence of local solid fraction within the mushy zone on local temperature for the three investigated regions in the steel ingot. The entire ranges of Fourier numbers (3 values) were all investigated based on different microsegregation models given in Table 1. It can be seen that for the Lever rule, the decrease of the liquidus and the increase of solidus-liquidus difference (as indicated in Table 3), with the increase of SDAS and the resultant α value in the ingot radial direction, were reflected in the movement of the predicted curves to the lower temperature and their larger.
(a) (b)
Figure 3.Micrographs of the three studied regions on the axial face along the section of 30 cm below the hot-top/casting body separation interface: (a) Region 1 in the periphery (d2=366µm); (b) region 2 in the12radius position (d2=474µm); (c) region 3 in the center (d2=536µm).
With the measured SDAS (d2), the determined diffusion coefficientDSbased on Equation (4) and the calculated local solidification time (tf), Fourier numberαvalues were calculated using Equation (1) and given in Table3. It was revealed that with the increase of the dendritic arm spacing and the local freezing time from the ingot wall side chill zone to the center, the value of Fourier numberαincreased along the radius of the 40 MT ingot.
4.2. Impact of Microsegregation Model on Thermophysical Properties
Metals2020,10, 74 8 of 17
Metals 2020, 10, x FOR PEER REVIEW 7 of 17
Table 3. Calculated parameters for the investigated regions.
Region TS (°C) TL (ᵒC) d2 (μm) tf (s) α
1 1428.5 1493.1 366 509 10.57
2 1426.5 1492.8 474 1017 12.60
3 1414.2 1486.7 536 1307 12.66
Figure 3 presents the optical micrographs observed on the three selected regions. Analyses on these micrographs revealed SDAS values (d2) of 366 μm in the periphery of the ingot, 474 μm in the
½ radius position and 536 μm in the ingot center. A Scheme was added to Figure 3b to illustrate the method to determine the SDAS values. Based on the measured SDAS, local solidification time for each case was calculated using Equation (5). The results were added to Table 3. It can be seen that the evolution of solidification time with the SDAS is in agreement with the reports in the literature that higher SDAS is correlated with longer solidification time [25].
(a) (b) (c)
Figure 3. Micrographs of the three studied regions on the axial face along the section of 30 cm below the hot-top/casting body separation interface: (a) Region 1 in the periphery (d2 = 366 μm); (b) region 2
in the ½ radius position (d2 = 474 μm); (c) region 3 in the center (d2 = 536 μm).
With the measured SDAS (d2), the determined diffusion coefficient DS based on Equation (4) and
the calculated local solidification time (tf), Fourier number α values were calculated using Equation
(1) and given in Table 3. It was revealed that with the increase of the dendritic arm spacing and the local freezing time from the ingot wall side chill zone to the center, the value of Fourier number α increased along the radius of the 40 MT ingot.
4.2. Impact of Microsegregation Model on Thermophysical Properties
Figure 4 gives the dependence of local solid fraction within the mushy zone on local temperature for the three investigated regions in the steel ingot. The entire ranges of Fourier numbers (3 values) were all investigated based on different microsegregation models given in Table 1. It can be seen that for the Lever rule, the decrease of the liquidus and the increase of solidus-liquidus difference (as indicated in Table 3), with the increase of SDAS and the resultant α value in the ingot radial direction, were reflected in the movement of the predicted curves to the lower temperature and their larger.
(a) (b)
Metals 2020, 10, x FOR PEER REVIEW 8 of 17
(c)
Figure 4. Predicted solid fraction/temperature curves for the Regions 1–3 according to the classical limiting cases and the intermediate models over a range of Fourier number values: (a) α = 10.57 (ingot wall side); (b) α = 12.60 (mid-radius region); (c) α = 12.66 (ingot center).
In addition, for all the three examined regions, the freezing zones predicted using Scheil model were much larger than the predictions from other microsegregation models. This is probably due to the assumption in Scheil’s formulation that with a perfectly mixed liquid and no diffusion in the solid phase, solidification does not occur until reaching the eutectic temperature. The predictions given using Brody-Flemings model appear physically impossible, since the temperature at which solidification is complete lies above the equilibrium solidus. Similar errors predicted by Brody-Flemings equations have also been reported by others [15,16]. It is worth emphasizing here that Flemings approach has been successfully applied to cases where no solid material enters or leaves the volume element during solidification; the elementary domain for establishing the balances was defined on the undeformed solid skeleton of the mushy zone [1]. Thus, it appears probable that the approximate equations derived by Brody-Flemings do not have the physical justification. As well, it is necessary to use a more realistic model for solute microsegregation/redistribution.
The data presented in Figure 4 also reveal that for all the three Fourier number cases, the phase transformations predicted using Clyne-Kurz and Kobayashi-Ohnaka equations are similar to each other. They also nearly coincide with the Lever rule curves, whether before or after the δ/γ transformation during the cooling process. This finding indicates that the Lever rule may be regarded as a better approximation for the diffusion behavior in the solid in the large-size cast ingot.
Different segregation levels and SDAS sizes resulted in the change of the kinetics of phase transformations, and generated variations in the thermophysical properties of the formed phases. Figure 5 presents the temperature dependence of the effective thermal conductivity on the dendritic solidification model. The variations of specific heat and density as a function of temperature are given in Figures 6 and 7. For the three examined regions, Lever rule predicts significant increase of the thermal conductivity of the mushy zone as a function of temperature. The evolution of the specific heat follows the same trend while that of the density goes in the opposite direction.
It must be noted that all the changes in the dynamic thermophysical properties arose after the phase transformation during the cooling process. Hence, similar changes in the thermophysical properties are also expected to be observed in the evolution of solid phase. For instance, for all the three regions, the predictions from Brody-Flemings equations appeared questionable, and the variations in Clyne-Kurz and Kobayashi-Ohnaka curves were indistinguishable from those given by the Lever rule.
Figure 4. Predicted solid fraction/temperature curves for the Regions 1–3 according to the classical limiting cases and the intermediate models over a range of Fourier number values: (a)α=10.57 (ingot wall side); (b)α=12.60 (mid-radius region); (c)α=12.66 (ingot center).
In addition, for all the three examined regions, the freezing zones predicted using Scheil model were much larger than the predictions from other microsegregation models. This is probably due to the assumption in Scheil’s formulation that with a perfectly mixed liquid and no diffusion in the solid phase, solidification does not occur until reaching the eutectic temperature. The predictions given using Brody-Flemings model appear physically impossible, since the temperature at which solidification is complete lies above the equilibrium solidus. Similar errors predicted by Brody-Flemings equations have also been reported by others [15,16]. It is worth emphasizing here that Flemings approach has been successfully applied to cases where no solid material enters or leaves the volume element during solidification; the elementary domain for establishing the balances was defined on the undeformed solid skeleton of the mushy zone [1]. Thus, it appears probable that the approximate equations derived by Brody-Flemings do not have the physical justification. As well, it is necessary to use a more realistic model for solute microsegregation/redistribution.
The data presented in Figure4also reveal that for all the three Fourier number cases, the phase transformations predicted using Clyne-Kurz and Kobayashi-Ohnaka equations are similar to each other. They also nearly coincide with the Lever rule curves, whether before or after theδ/γtransformation during the cooling process. This finding indicates that the Lever rule may be regarded as a better approximation for the diffusion behavior in the solid in the large-size cast ingot.
thermal conductivity of the mushy zone as a function of temperature. The evolution of the specific heat follows the same trend while that of the density goes in the opposite direction.
It must be noted that all the changes in the dynamic thermophysical properties arose after the phase transformation during the cooling process. Hence, similar changes in the thermophysical properties are also expected to be observed in the evolution of solid phase. For instance, for all the three regions, the predictions from Brody-Flemings equations appeared questionable, and the variations in Clyne-Kurz and Kobayashi-Ohnaka curves were indistinguishable from those given by the Lever rule.Metals 2020, 10, x FOR PEER REVIEW 9 of 17
(a) (b)
(c)
Figure 5. Temperature dependence of thermal conductivity for the steel in study according to different microsegregation solidification models for the case (a)α = 10.57(ingot wall side); (b) α = 12.60 (mid-radius region); (c) α= 12.66 (ingot center).
(a) (b)
600 700 800 900 1000
1300 1350 1400 1450 1500
Cp
(J/Kg/°C)
T (°C)
Lever rule Scheil Brody-Flemings Clyne-Kurz Kobayashi-Ohnaka
600 700 800 900 1000
1300 1350 1400 1450 1500
Cp
(J/Kg/°C)
T (°C)
Lever rule Scheil Brody-Flemings Clyne-Kurz Kobayashi-Ohnaka
Figure 5.Temperature dependence of thermal conductivity for the steel in study according to different microsegregation solidification models for the case (a)α= 10.57(ingot wall side); (b)α =12.60 (mid-radius region); (c)α=12.66 (ingot center).
Metals 2020, 10, x FOR PEER REVIEW 9 of 17
(a) (b)
(c)
Figure 5. Temperature dependence of thermal conductivity for the steel in study according to different microsegregation solidification models for the case (a)α = 10.57(ingot wall side); (b) α = 12.60 (mid-radius region); (c) α= 12.66 (ingot center).
(a) (b) 600
700 800 900 1000
1300 1350 1400 1450 1500
Cp
(J/Kg/°C)
T (°C)
Lever rule Scheil Brody-Flemings Clyne-Kurz Kobayashi-Ohnaka
600 700 800 900 1000
1300 1350 1400 1450 1500
Cp
(J/Kg/°C)
T (°C)
Lever rule Scheil Brody-Flemings Clyne-Kurz Kobayashi-Ohnaka
MetalsMetals 20202020, ,10, 7410, x FOR PEER REVIEW 10 of 17 10 of 17
v
(c)
Figure 6. Temperature dependence of specific heat for the steel in study according to different microsegregation solidification models for the case: (a) α = 10.57 (ingot wall side); (b) α = 12.60 (mid-radius region); (c) α = 12.66 (ingot center).
(a) (b)
(c)
Figure 7. Temperature dependence of density for the steel in study according to different microsegregation solidification models for the case: (a) α = 10.57 (ingot wall side); (b) α = 12.60 (mid-radius region); (c) α = 12.66 (ingot center).
600 700 800 900 1000
1300 1350 1400 1450 1500
Cp (J/Kg/°C) T (°C) Lever rule Scheil Brody-Flemings Clyne-Kurz Kobayashi-Ohnaka 6900 7000 7100 7200 7300 7400
1300 1350 1400 1450 1500
ρ (Kg/m 3) T (°C) lever rule Scheil Brody-Flemings Clyne-Kurz Kobayashi-Ohnaka 6900 7000 7100 7200 7300 7400
1300 1350 1400 1450 1500
ρ (Kg/m 3) T (°C) lever rule Scheil Brody-Flemings Clyne-Kurz Kobayashi-Ohnaka 6900 7000 7100 7200 7300 7400
1300 1350 1400 1450 1500
ρ (Kg/m 3) T (°C) lever rule Scheil Brody-Flemings Clyne-kurz Kobayashi-Ohnaka
Figure 6. Temperature dependence of specific heat for the steel in study according to different microsegregation solidification models for the case: (a)α=10.57 (ingot wall side); (b)α=12.60 (mid-radius region); (c)α=12.66 (ingot center).
Metals 2020, 10, x FOR PEER REVIEW 10 of 17
v
(c)
Figure 6. Temperature dependence of specific heat for the steel in study according to different microsegregation solidification models for the case: (a) α = 10.57 (ingot wall side); (b) α = 12.60 (mid-radius region); (c) α = 12.66 (ingot center).
(a) (b)
(c)
Figure 7. Temperature dependence of density for the steel in study according to different microsegregation solidification models for the case: (a) α = 10.57 (ingot wall side); (b) α = 12.60 (mid-radius region); (c) α = 12.66 (ingot center).
600 700 800 900 1000
1300 1350 1400 1450 1500
Cp (J/Kg/°C) T (°C) Lever rule Scheil Brody-Flemings Clyne-Kurz Kobayashi-Ohnaka 6900 7000 7100 7200 7300 7400
1300 1350 1400 1450 1500
ρ (Kg/m 3) T (°C) lever rule Scheil Brody-Flemings Clyne-Kurz Kobayashi-Ohnaka 6900 7000 7100 7200 7300 7400
1300 1350 1400 1450 1500
ρ (Kg/m 3) T (°C) lever rule Scheil Brody-Flemings Clyne-Kurz Kobayashi-Ohnaka 6900 7000 7100 7200 7300 7400
1300 1350 1400 1450 1500
ρ (Kg/m 3) T (°C) lever rule Scheil Brody-Flemings Clyne-kurz Kobayashi-Ohnaka
Based on the above analyses, Lever rule can be regarded as a suitable approximation for the diffusion behavior in the solid in an industrial scale ingot, whether in the initial solidification stage or in the intermediate and late solidification phases. Therefore, the dynamic physical properties of the studied steel were calculated using Lever rule. The determined data were used to simulate the solidification behavior of the industrial scale 40MT steel ingot. FE simulation using Scheil equations were also performed for comparison purposes.
4.3. Impact of Microsegregation Model on Solidification Behavior
The thermophysical properties of the studied steel, determined using Lever rule and Scheil scheme, were adopted for the computation of the thermomechanical behavior and solutal distribution during the solidification process of the 40MT steel cast ingot. Figure8displays the temperature patterns (left figures) combined with liquid fraction fields (right figures), predicted using Lever rule and Scheil models, at times of 0.5 h (end of filling stage), 5.5 h, 10.5 h and 15.5 h. The results show that the solid diffusion plays a great role in the solidification behavior of the large-size steel ingot.
For the temperature fields, at the end of the filling operation (Figure8a,e), a long inclined 1550◦C isothermal curve was obtained by the application of the Lever rule, which was different from the relatively flattened and short one in the calculation at any given solidification moment, the movement of any isotherm in Scheil predictions always with Scheil equation. The high temperature area in the bulk liquid (the red region above the 1550◦C isotherm) in the Lever rule case was smaller than that from Scheil. This finding indicates the occurrence of a delayed heat dissipation in the superheated molten steel under Scheil conditions. With the solidification proceeding, lagged behind the corresponding one predicted using Lever rule. This feature is indicative of a solidification delay in Scheil due to the absence of solid diffusion.
Predicted temperature variations on the mold’s outside surface as a function of time, monitored using sensors (SN), were compared with experimental readings of thermocouples (TC) placed at five specified positions (as illustrated on the top right corner in Figure9). A better agreement can be seen, in Figure9, between the values predicted using Lever rule model and the measured profiles.
Based on the above analyses, Lever rule can be regarded as a suitable approximation for the diffusion behavior in the solid in an industrial scale ingot, whether in the initial solidification stage or in the intermediate and late solidification phases. Therefore, the dynamic physical properties of the studied steel were calculated using Lever rule. The determined data were used to simulate the solidification behavior of the industrial scale 40MT steel ingot. FE simulation using Scheil equations were also performed for comparison purposes.
4.3. Impact of Microsegregation Model on Solidification Behavior
The thermophysical properties of the studied steel, determined using Lever rule and Scheil scheme, were adopted for the computation of the thermomechanical behavior and solutal distribution during the solidification process of the 40MT steel cast ingot. Figure 8 displays the temperature patterns (left figures) combined with liquid fraction fields (right figures), predicted using Lever rule and Scheil models, at times of 0.5 h (end of filling stage), 5.5 h, 10.5 h and 15.5 h. The results show that the solid diffusion plays a great role in the solidification behavior of the large-size steel ingot.
For the temperature fields, at the end of the filling operation (Figure 8a,e), a long inclined 1550 °C isothermal curve was obtained by the application of the Lever rule, which was different from the relatively flattened and short one in the calculation at any given solidification moment, the movement of any isotherm in Scheil predictions always with Scheil equation. The high temperature area in the bulk liquid (the red region above the 1550 °C isotherm) in the Lever rule case was smaller than that from Scheil. This finding indicates the occurrence of a delayed heat dissipation in the superheated molten steel under Scheil conditions. With the solidification proceeding, lagged behind the corresponding one predicted using Lever rule. This feature is indicative of a solidification delay in Scheil due to the absence of solid diffusion.
Predicted temperature variations on the mold’s outside surface as a function of time, monitored using sensors (SN), were compared with experimental readings of thermocouples (TC) placed at five specified positions (as illustrated on the top right corner in Figure 9). A better agreement can be seen, in Figure 9, between the values predicted using Lever rule model and the measured profiles.
Metals2020,10, 74 12 of 17
Metals 2020, 10, x FOR PEER REVIEW 12 of 17
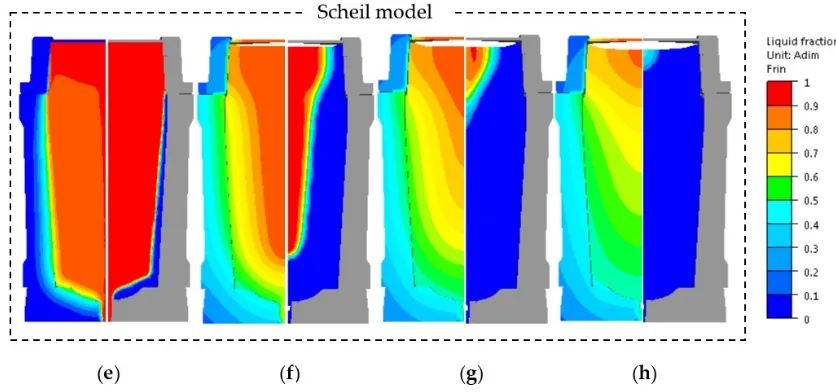
Figure 8. Temperature field (left figures) combined with liquid fraction patterns (right figures) predicted using Lever rule and Scheil models in the solidification process at times of: (a,e) 0.5 h (end of filling); (b,f) 5.5 h; (c,g) 10.5 h; (d,h) 15.5 h.
(a) (b)
Figure 9. Temperature profiles on 5 specified positions on the outside surface of the mold: (a) Temperature profiles for all 5 monitored positions; (b) temperature profiles in the higher temperature regions for the first four monitored positions.
In the liquid fraction patterns (right figures) in Figure 8, it can be seen that for both treatments, during the solidification process, three phases coexisted in the mold cavity: a full solid region (blue region), a solid+liquid mushy zone (multicolor region) and a full liquid zone (red region). In metals, the mushy zone is bounded by liquid and solid (or eutectic isotherms) and usually has a dendritic crystalline structure. In the liquid fraction fields in Figure 8, it was noted that Scheil predictions were accompanied by larger mushy zones due to the occurrence of solidification at eutectic temperature. These larger mushy regions resulted from the larger temperature difference between the liquidus and solidus, leading to smaller solid/liquid partition coefficients. This would allow more solutes to be rejected from the solidifying dendrites in the mushy region and to form higher microsegregation levels [26]. As a result, thermo-solutal convection currents present in the mushy region would carry the larger quantity of solutes away from the site of rejection, resulting in higher intensity of macrosegregation.
Figure 8.Temperature field (left figures) combined with liquid fraction patterns (right figures) predicted using Lever rule and Scheil models in the solidification process at times of: (a,e) 0.5 h (end of filling); (b,f) 5.5 h; (c,g) 10.5 h; (d,h) 15.5 h.
Figure 9. Temperature profiles on 5 specified positions on the outside surface of the mold: (a) Temperature profiles for all 5 monitored positions; (b) temperature profiles in the higher temperature regions for the first four monitored positions.
carry the larger quantity of solutes away from the site of rejection, resulting in higher intensity of macrosegregation.
Further comparative analyses of liquid fraction fields in Figure8revealed similar solidification delay tendency in the calculations with null diffusion in the solid (Scheil model), as observed above in temperature patterns. For instance, for the Scheil case, after the pouring operation, the solid front was always closer to the hot-top wall side in the hot-top part (Figure8f–h); at 15.5 h, a mushy zone was still remained, which was in contrast to the complete solidification for Lever rule.
The solidification delay in Scheil predictions was also reflected in the difference in the solidification times predicted using the two models. With Lever rule, 54,428 s (15 h 7 min) was needed for complete solute redistribution, while based on Scheil model, the solidification of the ingot did not end until 62,945 s (17 h 29 min in Figure10). The approximate 15 h for the 40MT ingot to complete solidification was in good accordance with the casting time in the actual manufacturing practice. It should be noted that the delay in solidification would allow more time for solute-rich interdendritic liquid to redistribute in the steel. This tendency would permit the formation of more carbide and aggravate macroscopic solute segregation.
Furthermore, the extents in the top shrinkage predicted by the two approaches were also different. The top shrinkage predicted using Lever rule reached 26 cm (≈8% vertical contraction measured
from the original fill height) at the end of solidification, while for the Scheil case, the top contraction arrived at 10 cm (3.2% vertical contraction) when solidification was finished. Thus, the smaller top shrinkage (as seen in Figure8) and the resulting larger ingot final volume should be the root cause for the substantial increase in the solidification time for the simulation using Scheil rule. It should be noted that the Lever rule’s predicted top shrinkage depth at the centerline of about 26 cm agreed closely with the cavity dimensions measured on the experimental obtained ingot.
Metals 2019, 9, x FOR PEER REVIEW 13 of 17
Further comparative analyses of liquid fraction fields in Figure 8 revealed similar solidification delay tendency in the calculations with null diffusion in the solid (Scheil model), as observed above in temperature patterns. For instance, for the Scheil case, after the pouring operation, the solid front was always closer to the hot-top wall side in the hot-top part (Figure 8f–h); at 15.5 h, a mushy zone was still remained, which was in contrast to the complete solidification for Lever rule.
The solidification delay in Scheil predictions was also reflected in the difference in the solidification times predicted using the two models. With Lever rule, 54,428 s (15 h 7 min) was needed for complete solute redistribution, while based on Scheil model, the solidification of the ingot did not end until 62,945 s (17 h 29 min in Figure 10). The approximate 15 h for the 40MT ingot to complete solidification was in good accordance with the casting time in the actual manufacturing practice. It should be noted that the delay in solidification would allow more time for solute-rich interdendritic liquid to redistribute in the steel. This tendency would permit the formation of more carbide and aggravate macroscopic solute segregation.
Furthermore, the extents in the top shrinkage predicted by the two approaches were also different. The top shrinkage predicted using Lever rule reached 26 cm (≈ 8% vertical contraction measured from the original fill height) at the end of solidification, while for the Scheil case, the top contraction arrived at 10 cm (3.2% vertical contraction) when solidification was finished. Thus, the smaller top shrinkage (as seen in Figure 8) and the resulting larger ingot final volume should be the root cause for the substantial increase in the solidification time for the simulation using Scheil rule. It should be noted that the Lever rule’s predicted top shrinkage depth at the centerline of about 26 cm agreed closely with the cavity dimensions measured on the experimental obtained ingot.
(a) (b)
Figure 10. Total solidification time (s) for simulations based on microsegregation models of (a) lever rule; (b) Scheil.
Macrosegregation patterns of carbon predicted in the simulations using the two microsegregation treatments are provided in Figure 11. For both cases, the carbon concentrations in the hot-top, in the head of the ingot and in the mid-radius region of the ingot body were higher than the nominal one (0.36 wt.%), indicating the occurrence of positive segregation in these regions. However, under the combined action of larger mushy zone and longer solidification time, higher macrosegregation extent and intensity could be predicted in these regions in the calculations using Scheil model.
Figure 10.Total solidification time (s) for simulations based on microsegregation models of (a) lever rule; (b) Scheil.
Metals2020,10, 74 14 of 17
Metals 2019, 9, x FOR PEER REVIEW 14 of 17
Figure 11. Segregation pattern of carbon predicted using (a) Lever rule; (b) Scheil.
The chemical predictions were compared with experimental measurements on the centerline section of hot-top and the upper part of the ingot, as displayed in Figure 12. The chemical profile was obtained based on the compilation of measurements over 250 pieces of 4.5 × 6.5 cm2 samples, using Thermo Scientific ARLTM 4460 mass spectrometer. The experimentally obtained segregation ratio pattern is symmetric about the ingot central axis, with a positive gradient in solute concentration over the ingot’s radius from the periphery to the center and along the ingot axis from the lower to the upper region. Such features are similar to the recently obtained macrosegregation pattern for a 15-ton steel forging ingot [27]. It can be seen that the general carbon pattern in the experiment was well reproduced and a fair agreement was obtained between experimental measurements and Lever rule numerical results. The predicted solute-enriched zone between the center and ingot wall in Figure 11a matched well the area enclosed by the two black solute-enriched bands in Figure 12c. In contrast, some apparent discrepancies were present between experimental results and Scheil predictions.
(a) (b) (c)
Figure 12. Segregation pattern of carbon on the axial surface of the hot-top and upper section of ingot (a) lever rule; (b) Scheil; (c) mass spectrometer measurements with macrostructure around the hot-top/ingot junction.
To further examine the segregation ratio in the solute-rich band, new experimental measurements with a sampling density of 0.9 × 0.9 cm2 were carried out on the axial section at 30 cm below the hot-top/ingot body interface. It can be seen in Figure 13 that the segregation intensity inside the solute-rich bands got to 0.34, in agreement with the value predicted using Lever rule in the corresponding regions. This finding further demonstrates the applicability of Lever rule to approach the realistic microsegregation behavior in the course of casting and solidification of large size ingots.
Based on the above analyses, it can be seen that the extent of segregation is numerically overestimated in Scheil case (Figure 12b) due to the neglect on solid back diffusion. This finding
(a) (b)
Figure 11.Segregation pattern of carbon predicted using (a) Lever rule; (b) Scheil.
The chemical predictions were compared with experimental measurements on the centerline section of hot-top and the upper part of the ingot, as displayed in Figure12. The chemical profile was obtained based on the compilation of measurements over 250 pieces of 4.5×6.5 cm2samples,
using Thermo Scientific ARLTM4460 mass spectrometer. The experimentally obtained segregation ratio pattern is symmetric about the ingot central axis, with a positive gradient in solute concentration over the ingot’s radius from the periphery to the center and along the ingot axis from the lower to the upper region. Such features are similar to the recently obtained macrosegregation pattern for a 15-ton steel forging ingot [27]. It can be seen that the general carbon pattern in the experiment was well reproduced and a fair agreement was obtained between experimental measurements and Lever rule numerical results. The predicted solute-enriched zone between the center and ingot wall in Figure11a matched well the area enclosed by the two black solute-enriched bands in Figure12c. In contrast, some apparent discrepancies were present between experimental results and Scheil predictions.
Metals 2019, 9, x FOR PEER REVIEW 14 of 17
Figure 11. Segregation pattern of carbon predicted using (a) Lever rule; (b) Scheil.
The chemical predictions were compared with experimental measurements on the centerline section of hot-top and the upper part of the ingot, as displayed in Figure 12. The chemical profile was obtained based on the compilation of measurements over 250 pieces of 4.5 × 6.5 cm2 samples, using Thermo Scientific ARLTM 4460 mass spectrometer. The experimentally obtained segregation ratio pattern is symmetric about the ingot central axis, with a positive gradient in solute concentration over the ingot’s radius from the periphery to the center and along the ingot axis from the lower to the upper region. Such features are similar to the recently obtained macrosegregation pattern for a 15-ton steel forging ingot [27]. It can be seen that the general carbon pattern in the experiment was well reproduced and a fair agreement was obtained between experimental measurements and Lever rule numerical results. The predicted solute-enriched zone between the center and ingot wall in Figure 11a matched well the area enclosed by the two black solute-enriched bands in Figure 12c. In contrast, some apparent discrepancies were present between experimental results and Scheil predictions.
(a) (b) (c)
Figure 12. Segregation pattern of carbon on the axial surface of the hot-top and upper section of ingot (a) lever rule; (b) Scheil; (c) mass spectrometer measurements with macrostructure around the hot-top/ingot junction.
To further examine the segregation ratio in the solute-rich band, new experimental measurements with a sampling density of 0.9 × 0.9 cm2 were carried out on the axial section at 30 cm below the hot-top/ingot body interface. It can be seen in Figure 13 that the segregation intensity inside the solute-rich bands got to 0.34, in agreement with the value predicted using Lever rule in the corresponding regions. This finding further demonstrates the applicability of Lever rule to approach the realistic microsegregation behavior in the course of casting and solidification of large size ingots.
Based on the above analyses, it can be seen that the extent of segregation is numerically overestimated in Scheil case (Figure 12b) due to the neglect on solid back diffusion. This finding
(a) (b)
Figure 12. Segregation pattern of carbon on the axial surface of the hot-top and upper section of ingot (a) lever rule; (b) Scheil; (c) mass spectrometer measurements with macrostructure around the hot-top/ingot junction.
To further examine the segregation ratio in the solute-rich band, new experimental measurements with a sampling density of 0.9 × 0.9 cm2 were carried out on the axial section at 30 cm below
Based on the above analyses, it can be seen that the extent of segregation is numerically overestimated in Scheil case (Figure12b) due to the neglect on solid back diffusion. This finding indicates that the degree of the error in the Scheil analysis could be reduced by including back diffusion in the solid in the calculations.
Metals 2019, 9, x FOR PEER REVIEW 15 of 17
indicates that the degree of the error in the Scheil analysis could be reduced by including back diffusion in the solid in the calculations.
(a) (b)
Figure 13. Macrograph around positive segregated bands on the longitudinal section at 30 cm below the hot-top/ingot body interface and the corresponding segregation ratio patterns of carbon: (a) Macrograph with black solute-enriched bands; (b) mass spectroscopy measurements of the carbon segregation ratio pattern with sampling density of 0.9 × 0.9 cm2.
It should be mentioned that a better approximation may be obtained if using other models considering both solidification and transformation with predicted behaviors situated between the Lever Rule and Scheil’s theory, such as the solute microsegregation/redistribution model recently proposed by Wolczynski [28,29]. Wolczynshi’s model has been justified/substantiated since solidification path is located on liquidus line, microsegregation path on solidus line and redistribution path between both lines of a given phase diagram. Moreover, the newly proposed model was applied to the study of steel solidification [30]. Considering the model complexity, the high computation cost for a 40-ton ingot, and the unavailability of all nucleation and transformation parameters, the above-mentioned model was not considered in the present study and will be applied to the future work.
5. Conclusions
In the present work, the impact of microsegregation models on thermophysical properties and solidification behavior of a medium-carbon high strength steel was studied. The examined microsegregation models include the ideal equilibrium Lever rule, the extreme non-equilibrium Scheil-Gulliver and the schemes proposed by Brody-Flemings, Clyne-Kurz, Ohnaka-Kobayashi, which are characterized by incomplete solution diffusion in the solid. Based on the comparative analyses on representative regions, and the 3D simulations of the casting and solidification process of a large-size steel ingot, the following conclusions can be drawn:
For a large-size steel ingot, Lever rule can be regarded as a better approximation for the diffusion behavior in the solid, whether in the initial solidification stage or in the intermediate and late solidification phases;
The validity of Lever rule for reasonable depiction of the physical behaviors which take place in the casting course of large size steel ingot was demonstrated with a good agreement of the simulation predictions with experimental measurements.
The application of recently introduced models that provide a more accurate description of solute microsegregation and redistribution would be an interesting addition for future studies on the solidification of large size ingots.
Author Contributions: Conceptualization, M.J. and C.Z.; methodology, C.Z.; software, C.Z.; validation, C.Z.; formal analysis, C.Z.; investigation, C.Z. and P.I.G.; resources, M.J. and P.I.G.; data curation, C.Z.; writing— original draft preparation, C.Z.; writing—review and editing, M.J.; visualization, C.Z.; supervision, M.J.; project administration, M.Z.; funding acquisition, M.J.
Funding: This research was funded by Natural Sciences and Engineering Research Council (NSERC) of Canada in the form of a Collaborative Research and Development Grant (CRDG), grant number 470174.
Acknowledgments: The authors acknowledge Finkl Steel Co. for providing the materials used for experiments. Figure 13.Macrograph around positive segregated bands on the longitudinal section at 30 cm below the hot-top/ingot body interface and the corresponding segregation ratio patterns of carbon: (a) Macrograph with black solute-enriched bands; (b) mass spectroscopy measurements of the carbon segregation ratio pattern with sampling density of 0.9×0.9 cm2.
It should be mentioned that a better approximation may be obtained if using other models considering both solidification and transformation with predicted behaviors situated between the Lever Rule and Scheil’s theory, such as the solute microsegregation/redistribution model recently proposed by Wolczynski [28,29]. Wolczynshi’s model has been justified/substantiated since solidification path is located on liquidus line, microsegregation path on solidus line and redistribution path between both lines of a given phase diagram. Moreover, the newly proposed model was applied to the study of steel solidification [30]. Considering the model complexity, the high computation cost for a 40-ton ingot, and the unavailability of all nucleation and transformation parameters, the above-mentioned model was not considered in the present study and will be applied to the future work.
5. Conclusions
In the present work, the impact of microsegregation models on thermophysical properties and solidification behavior of a medium-carbon high strength steel was studied. The examined microsegregation models include the ideal equilibrium Lever rule, the extreme non-equilibrium Scheil-Gulliver and the schemes proposed by Brody-Flemings, Clyne-Kurz, Ohnaka-Kobayashi, which are characterized by incomplete solution diffusion in the solid. Based on the comparative analyses on representative regions, and the 3D simulations of the casting and solidification process of a large-size steel ingot, the following conclusions can be drawn:
For a large-size steel ingot, Lever rule can be regarded as a better approximation for the diffusion behavior in the solid, whether in the initial solidification stage or in the intermediate and late solidification phases;
The validity of Lever rule for reasonable depiction of the physical behaviors which take place in the casting course of large size steel ingot was demonstrated with a good agreement of the simulation predictions with experimental measurements.
The application of recently introduced models that provide a more accurate description of solute microsegregation and redistribution would be an interesting addition for future studies on the solidification of large size ingots.